Earnings season is back! Are you ready to dive in?
The recent third quarter was quite eventful for the U.S. stock market. Despite significant pullbacks in early August and September, the three major indices ended the quarter with positive returns. Recession fears arose, but a shift in the Federal Reserve helped the market regain momentum, fueled by hopes of a soft landing.
During the third quarter, the Dow Jones rallied more than 8%, the S&P 500 rose more than 5%, and the Nasdaq made a 2.6% gain.
Starting from the second week of October, U.S. stocks have entered the concentrated period of Q3 earnings reports. Public companies can choose different fiscal year cycles based on their business needs and strategies. For instance, $Apple (AAPL.US)$ fiscal year ends every last Saturday of September.
However, over 80% of companies still use the calendar year as their fiscal year, typically led by major financial institutions. On October 11, $JPMorgan (JPM.US)$ will kick off the earnings season.
According to Refinitiv, 79.4% of S&P 500 companies that reported Q2 earnings exceeded analysts' expectations, compared to a long-term average of 66%. Will this strong performance continue into Q3? What strategies could be deployed?
Which sectors are in favor?
FactSet indicates that the market expects the S&P 500's earnings growth rate to be 4.6% for the third quarter. If achieved, this would mark the fifth consecutive quarter of positive growth.
Earnings for FY 2024 are expected to grow by 10% year-over-year, with 2025 projected at 15.2%. The forward price-to-earnings (P/E) ratio of the S&P 500 over the next year stands at 21.4, slightly above the five-year average of 19.5.
Among the 11 sectors of the S&P 500, eight are expected to see year-over-year earnings growth in Q3. Information technology, healthcare, and communication services are anticipated to post double-digit growth.
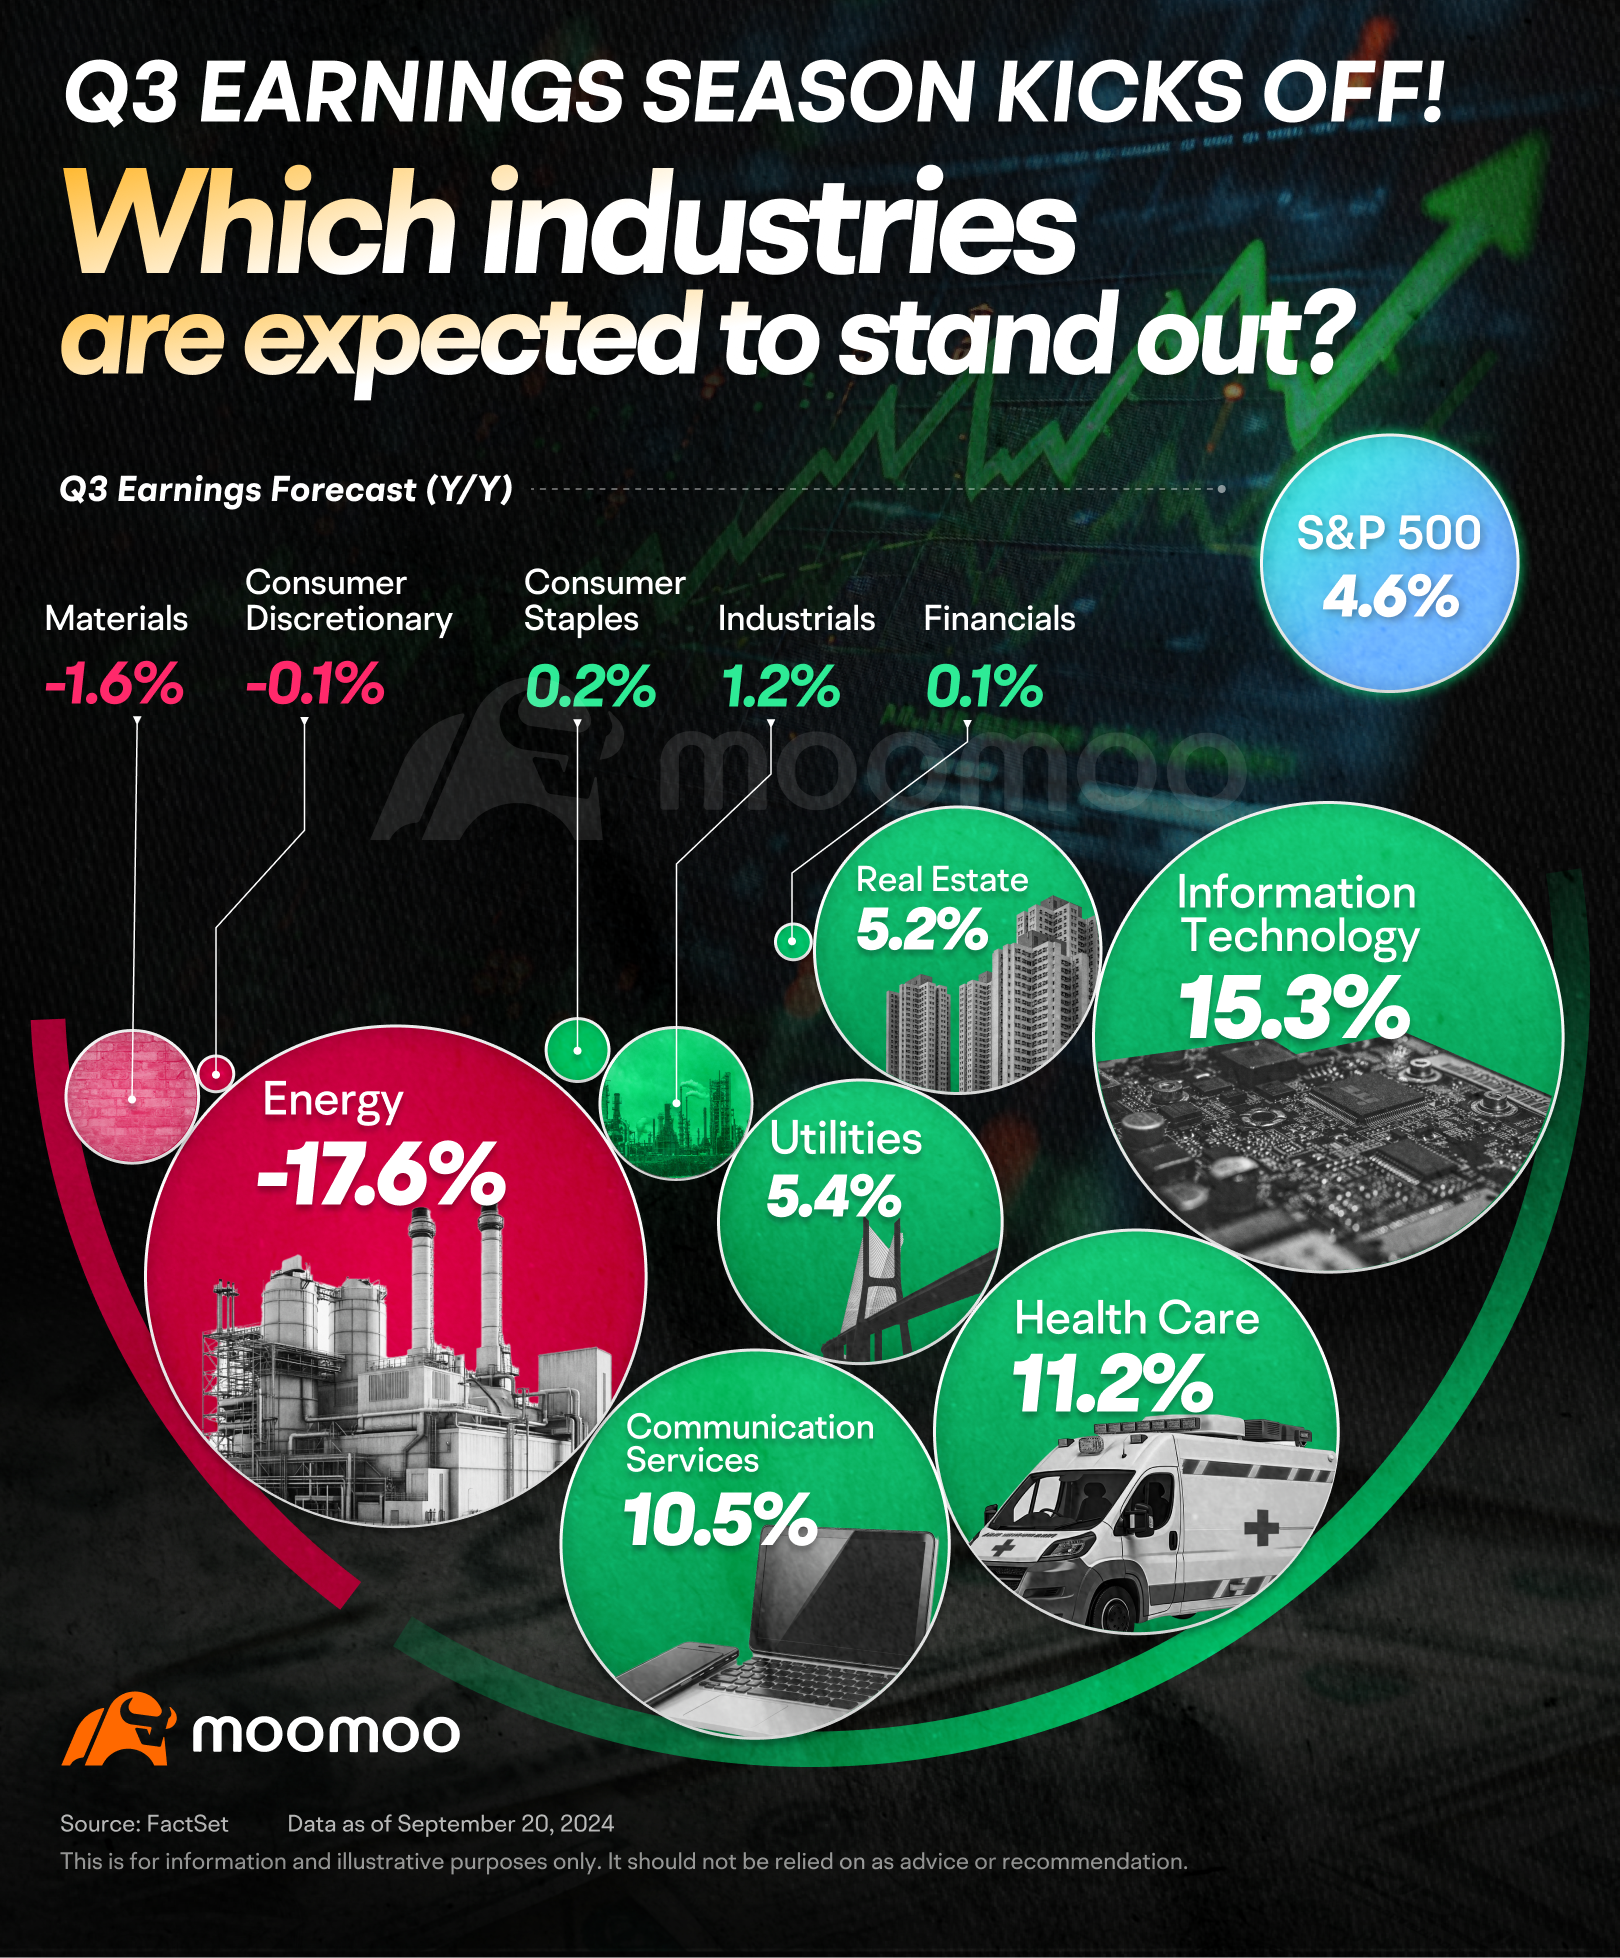
Nvidia (NVDA) from the information technology, along with $Alphabet-C (GOOG.US)$ and $Meta Platforms (META.US)$ in the communications services, are expected to drive earnings growth in their industries.
Large pharmaceutical companies like $Pfizer (PFE.US)$ and $Eli Lilly and Co (LLY.US)$ are also anticipated to be major contributors to their sector's earnings.
Conversely, the energy sector is expected to see nearly a 20% decline in earnings due to falling oil prices in the third quarter. However, oil prices have bounced back recently as the tension in the Middle East has heated up.
Top-rated companies
Of the ten companies with the highest buy ratings, three are from the 'Magnificent Seven': $Amazon (AMZN.US)$ , $Microsoft (MSFT.US)$ , and Nvidia.
Amazon leads the pack, with 95% of analysts recommending a buy and 5% a hold—no sell ratings. Meanwhile, $GE Aerospace (GE.US)$ , rejuvenated after asset divestitures, comes in third.
Other companies include oilfield services firm $Schlumberger (SLB.US)$ , gun concept stock $Axon Enterprise (AXON.US)$ , health insurance company $UnitedHealth (UNH.US)$ , and power generation leader $Vistra Energy (VST.US)$ , which benefits from AI demand.
Airlines $United Airlines (UAL.US)$ and $Delta Air Lines (DAL.US)$ are also on the list. Overall, most of these companies have performed well this year.
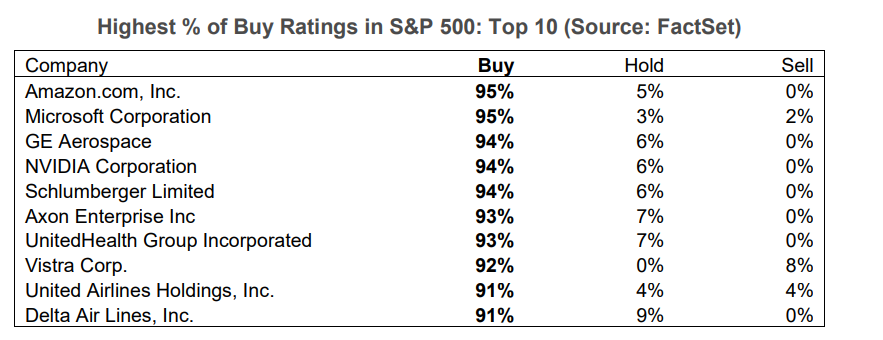
Source: FactSet. Data as of September 20, 2024. This is for information and illustrative purposes only. It should not be relied on as advice or recommendation.
Although the recent economic data slowdown has heightened market vulnerability, this does not necessarily mean investors should adopt a bearish stance.
According to Goldman Sachs Research, if the market experiences another pullback, the Federal Reserve is likely to step in, providing a buffer for the stock market and the economy. If the market adjusts in the future, it could be more of a buy-the-dip opportunity, as seen in previous months. Goldman's multi-variable model shows that while downside risk for the stock market has increased, it remains relatively low.
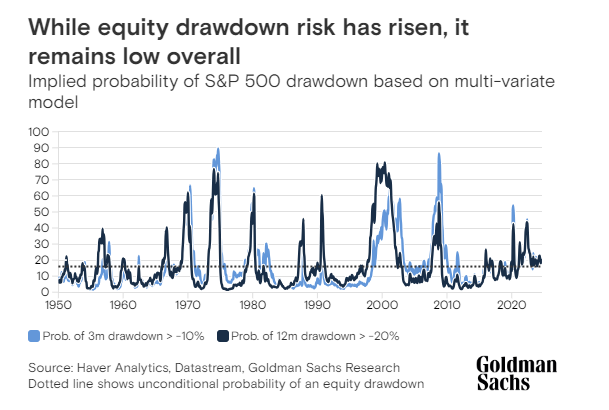
This is for information and illustrative purposes only. It should not be relied on as advice or recommendation.
How to navigate earnings season on moomoo
For companies approaching earnings releases, users can access relevant information directly on the individual stock quote page.
For example, for JPMorgan Chase, you can view current analyst target prices and ratings before the earnings release, and schedule an appointment for the company's earnings call online. You can also add a calendar reminder for the earnings release.
You can check earnings forecast data, including revenue, EPS, and EBIT. Go to a stock's Detailed Quotes Page > Company > Financial Forecast.
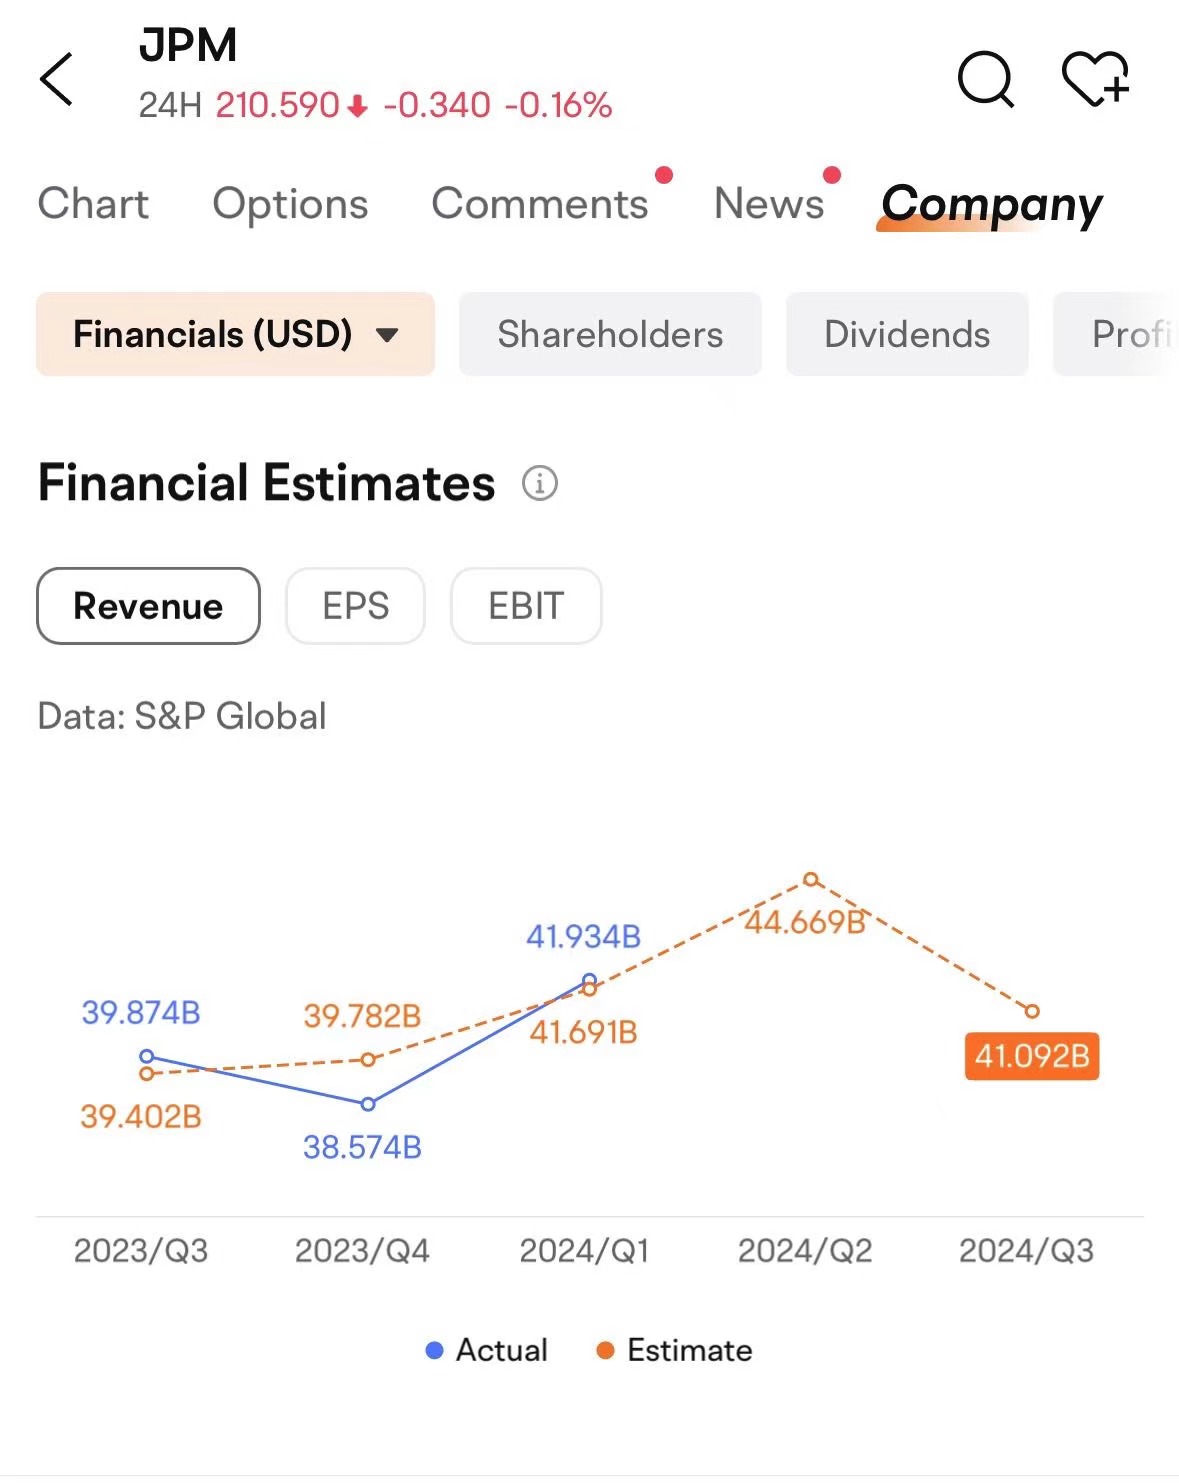
This is for information and illustrative purposes only. It should not be relied on as advice or recommendation.
If you're tracking a specific industry or company, you can make predictions based on available information and compare them to market consensus to refine your trading strategy.
The 'Company' section also offers more fundamental information, including financial statements, valuation metrics, and revenue breakdowns.
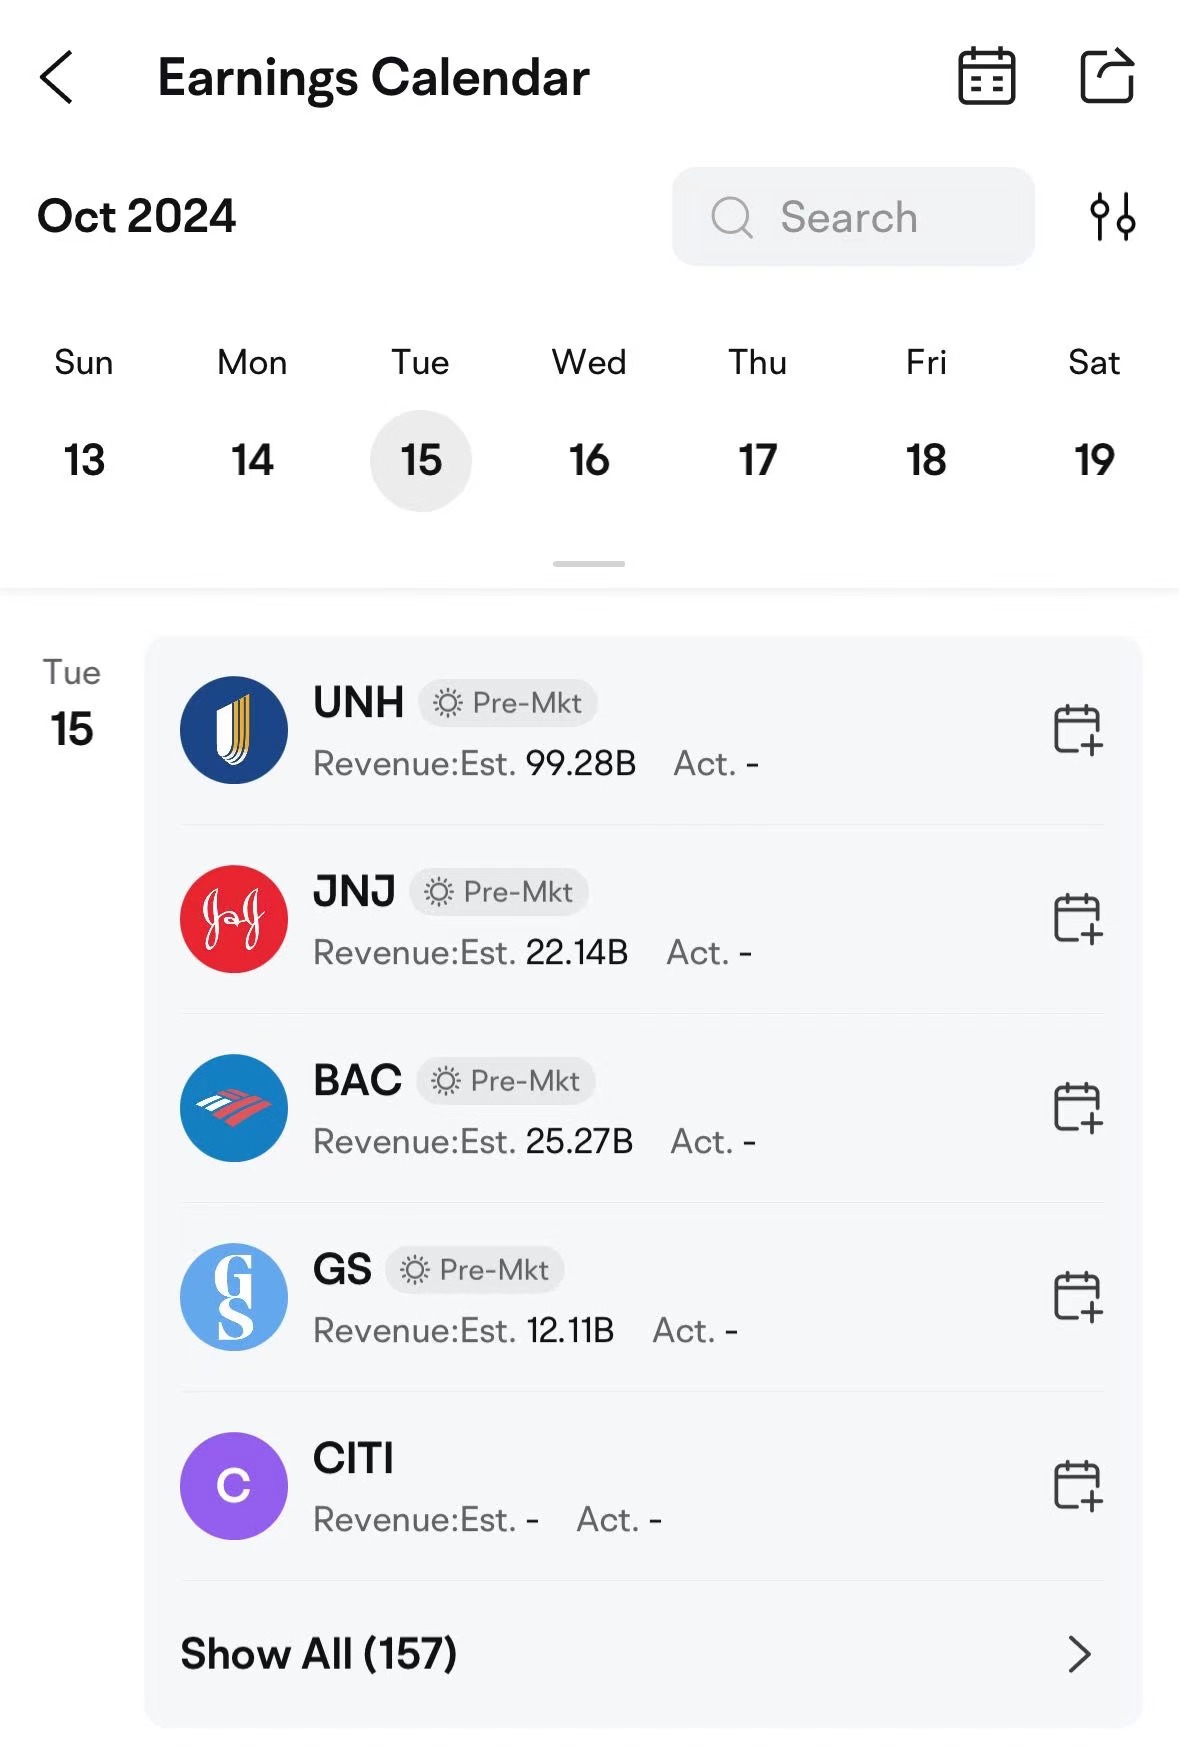
The 'Earnings Calendar' feature helps you stay updated on company events. You can search for specific companies and add calendar reminders.
This is for information and illustrative purposes only. It should not be relied on as advice or recommendation.
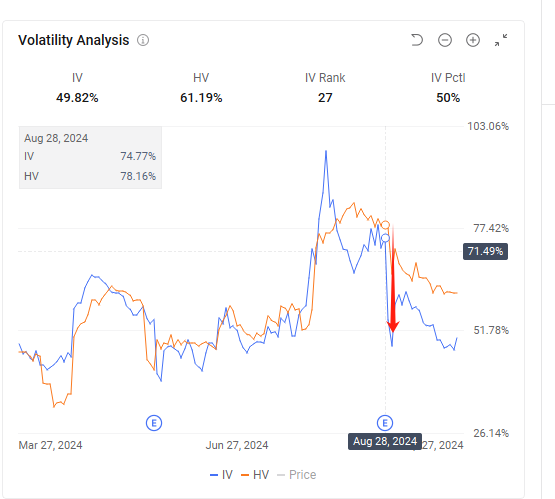
Volatility tends to rise before earnings are released and fall afterward. This pattern can be considered when building your option strategies.
For example, Nvidia's Q2 earnings report for fiscal year 2025 was released on August 28. Leading up to the release, Nvidia's volatility surged, but it quickly dropped afterward, a phenomenon known as implied volatility crush (IV Crush).
Implied volatility values, IV Rankings, and IV Percentiles are theoretical estimates, and the actual market conditions may not always align with the theoretical information shown. Investors should exercise caution and use multiple sources of information when making investment decisions.No guarantee or assurance using any tools or data provided on the moomoo app will result in investment success or reduce investment risk.
In a risk-neutral scenario, lower implied volatility of the target asset means you pay less premium, which theoretically benefits the option buyer.
If you expect volatility to rise before the earnings release but are unsure of the direction, you may construct a long straddle or long strangle when volatility is low. Alternatively, you can take advantage of the volatility crush by selling straddles or strangles when volatility is high before the earnings release.
Implied volatility values alone don’t tell the whole story because asset characteristics vary. Using volatility analysis tools can help you gauge the current volatility level, giving you a clearer picture of the target asset's overall volatility instead of just focusing on a single option.
For a better perspective, compare the target's performance over the past year. IV Rank shows how the current implied volatility compares to past values, while IV Percentile indicates the percentage of trading days when implied volatility was lower. A smaller number suggests that current implied volatility is relatively low.
Navigating the earnings season doesn't have to be a solitary endeavor. Moomoo provides timely previews and post-earnings analysis, allowing you to closely watch key company developments. Stay tuned for more updates!
Additional Disclosures: This content is also not a research report and is not intended to serve as the basis for any investment decision. The information contained in this article does not purport to be a complete description of the securities, markets, or developments referred to in this material. The information has been obtained from sources considered to be reliable, but we do not guarantee that the foregoing material is accurate or complete. Furthermore, there is no guarantee that any statements, opinions or forecasts provided herein will prove to be correct.
Options trading involves substantial risks and may not be suitable for all investors. Losses could potentially exceed your initial investment. Please also consider our US Options Product Disclosure Statement (PDS), US Options Target Market Determination (TMD) and OCC's Characteristics and Risks of Standardized Options available on the website before trading options.
This presentation is for informational and educational use only and is not a recommendation or endorsement of any particular investment or investment strategy. Investment information provided in this content is general in nature, strictly for illustrative purposes, and may not be appropriate for all investors. Read more