Apple's defining moment: Is it time for a breakout? (10/23/2024)
Hello, everyone! This week, we'll be focusing on $Apple (AAPL.US)$. The company is scheduled to report its fiscal Q4 results on October 31, following the market's close. In this article, we'll explore the latest trends and examine the company's recent market activity.
What's new?
On October 21, 2024, Apple's stock reached a record high, pushing its market capitalization to around $3.6 trillion. The company is set to launch iOS 18.1 next week, which will introduce its highly anticipated generative AI tools, Apple Intelligence, for the iPhone 15 Pro and the new iPhone 16 models.
Apple hopes these new AI features will encourage owners of older iPhone models to upgrade. Even though Apple has faced criticism for being slow in AI technology, CEO Tim Cook has clearly expressed the company's approach to AI development: "Not first, but best." He emphasizes that while Apple may not lead in introducing AI features, its focus is on making sure these technologies improve the user experience, ultimately making them “profoundly different.”
On Wednesday, October 23, 2024, industry supply chain analyst Ming-Chi Kuo reported that Apple has cut orders for the iPhone 16 by about 10 million units for the fourth quarter of this year and the first half of 2025. Kuo pointed out that most of these cuts affect the regular iPhone 16, rather than the iPhone 16 Pro models. As a result, he now estimates that iPhone 16 production in the second half of 2024 will total 84 million units, down from his previous forecast of around 88 million units.
While Kuo acknowledged that some are optimistic that Apple Intelligence could significantly boost iPhone shipments, he suggested that the order cuts indicate those expectations may not be realized in the near term.
Chart of the day
Trend analysis:
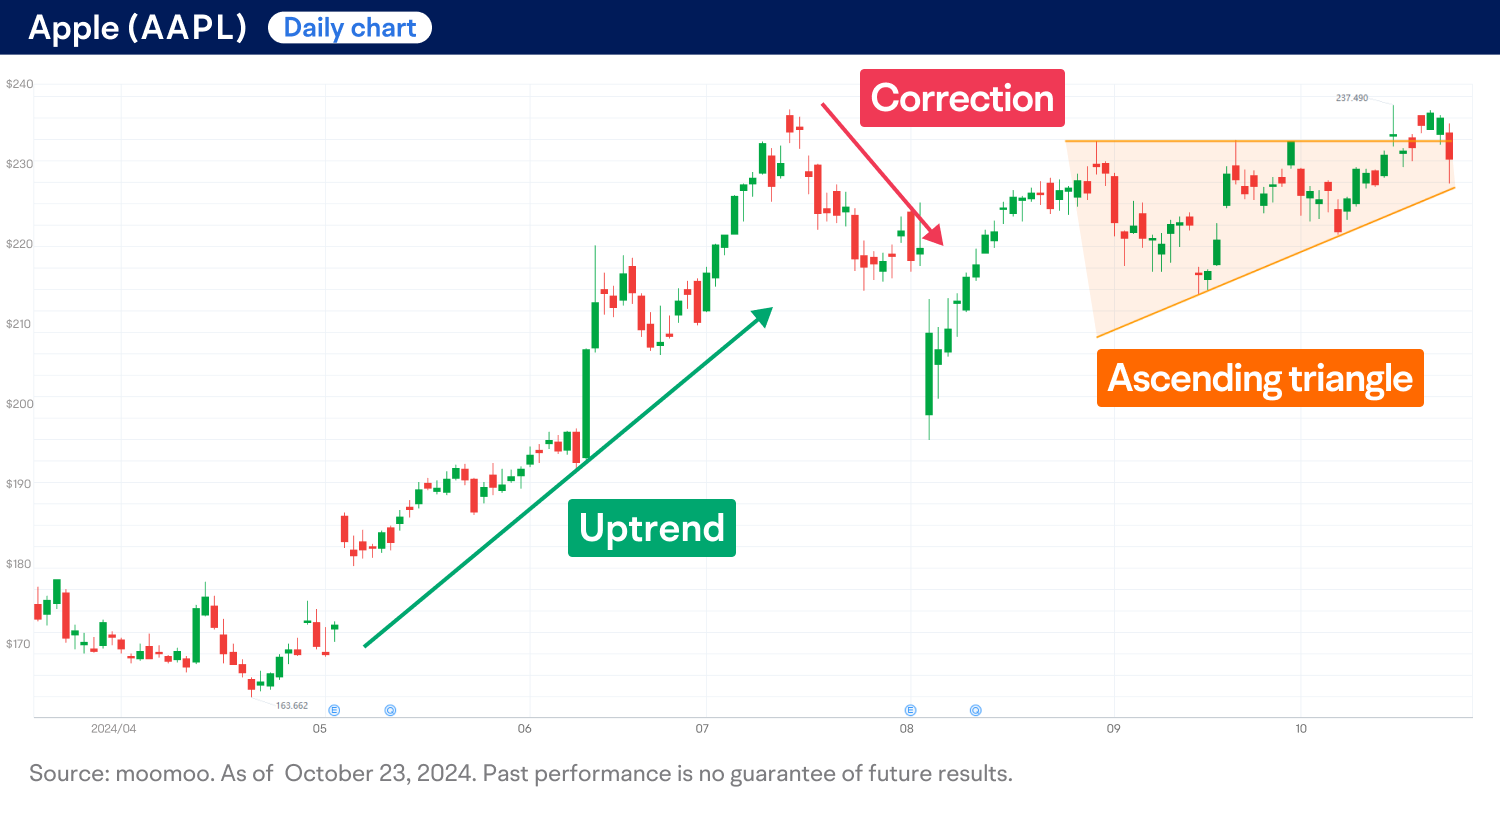
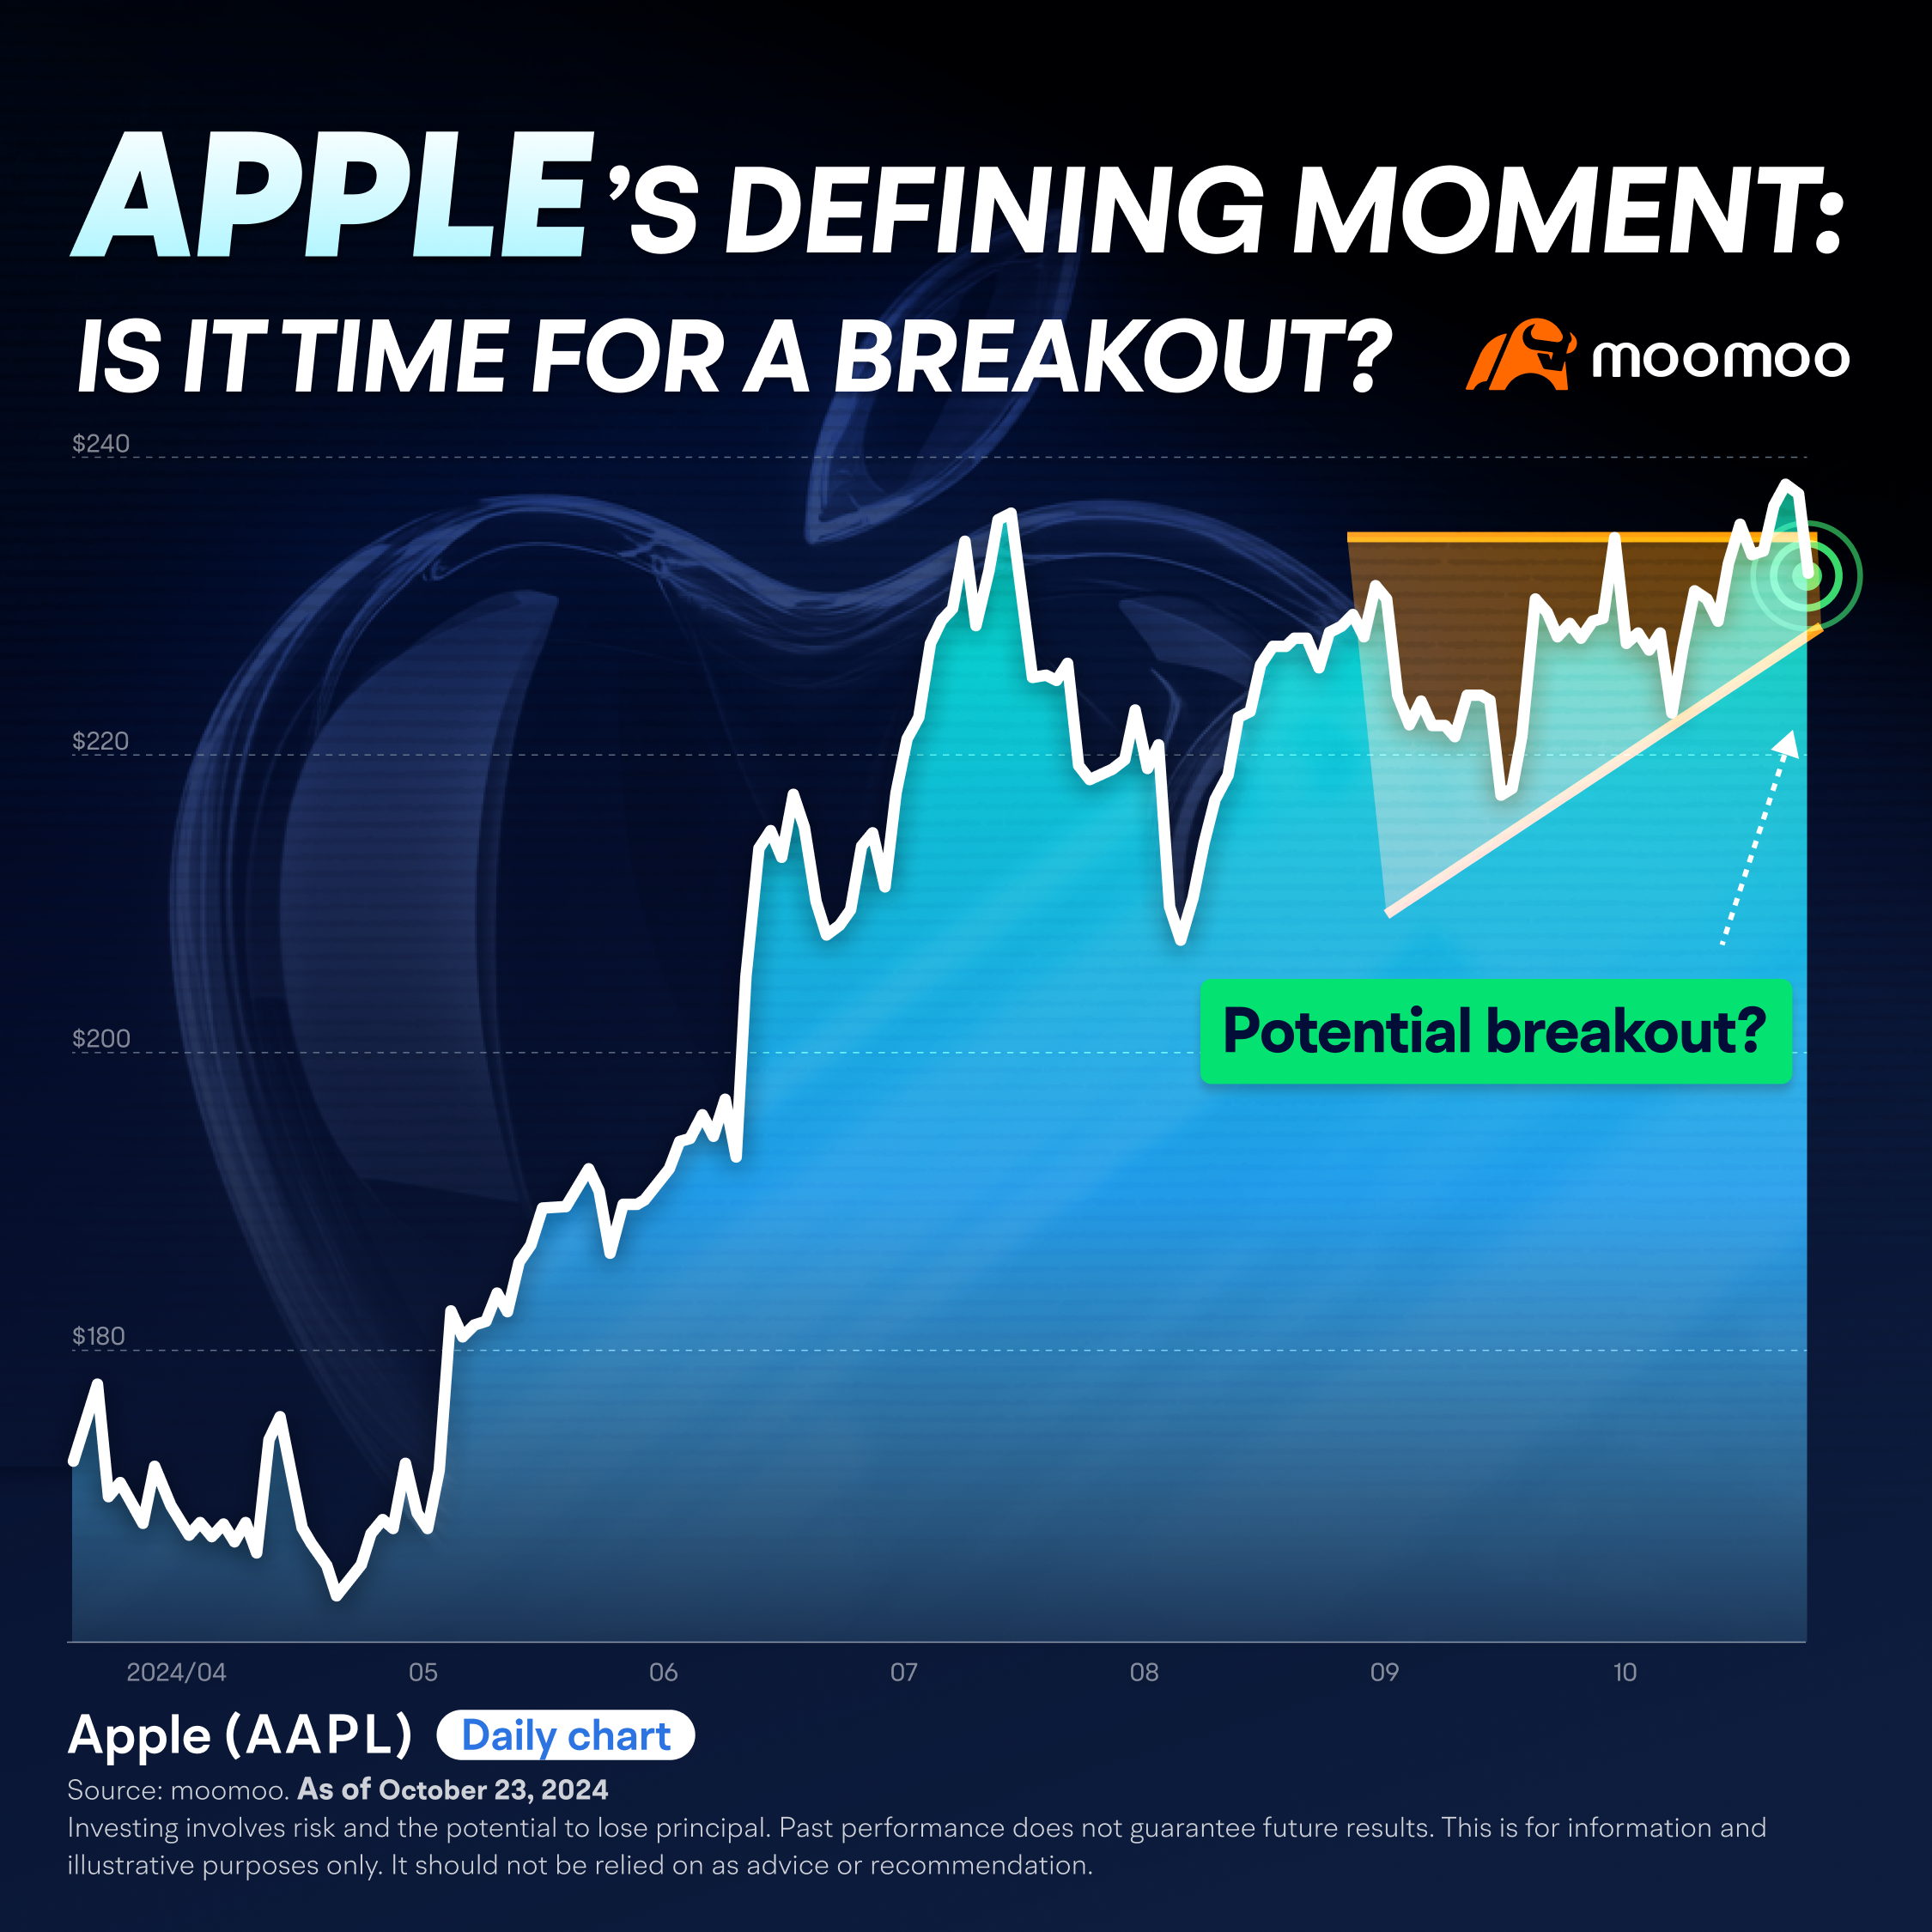
As shown on the daily chart, Apple's shares (AAPL) reached an all-time high in July 2024. Following this peak, AAPL experienced a correction of more than 10% and entered a consolidation phase, during which it formed an ascending triangle pattern. Recently, the stock climbed to a new record, briefly breaking out of the triangle formation but failing to maintain that level.
Technical indicators:
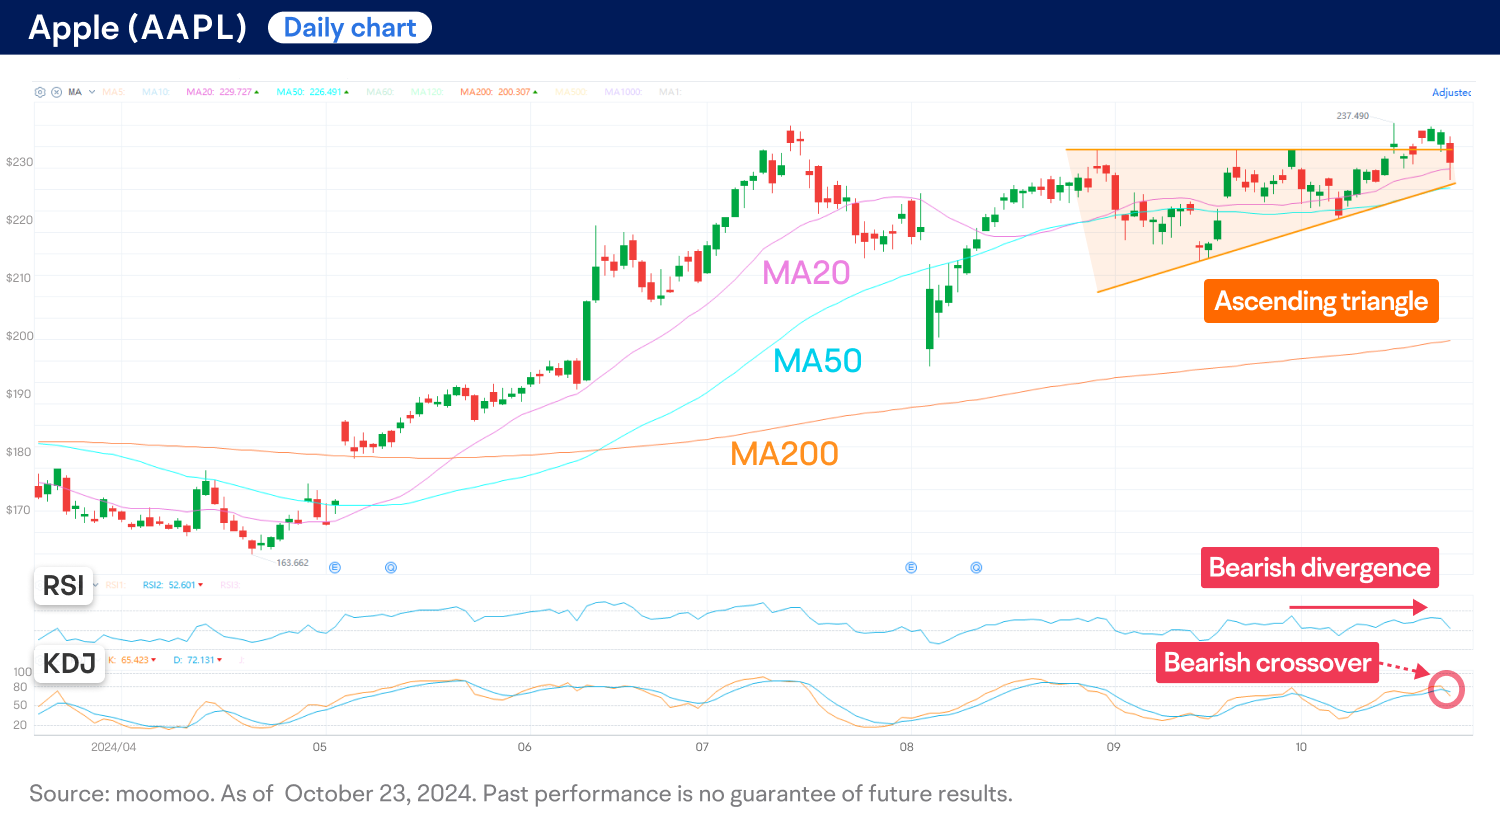
● AAPL's key moving averages (MAs) exhibit a bullish alignment, with the shorter-term MAs positioned above the longer-term ones, indicating an upward price trend.
● The RSI indicator reveals a bearish divergence, as the stock price forms a higher high while the indicator registers a lower high. This discrepancy could signal potential short-term price weakness.
● The KDJ indicator, a highly sensitive oscillator, has displayed a bearish crossover after the K line rose above the 80 overbought threshold. This suggests a potential short-term price reversal.
In summary, while AAPL recently achieved an all-time high and briefly broke above the consolidation range defined by the ascending triangle pattern, it was unable to maintain its upward momentum. This might suggest short-term weakness. The stock has entered a critical zone, where market volatility is expected to rise as the triangle contracts. Traders may be looking for clearer signals as the company gears up to unveil its highly anticipated AI features and release its upcoming quarterly results.
This presentation discusses technical analysis, other approaches, including fundamental analysis, may offer very different views. The examples provided are for illustrative purposes only and are not intended to be reflective of the results you can expect to achieve.
All investing involves risk, including the potential loss of principal, and there can be no guarantee that any investing strategy will be successful.
This presentation is for informational and educational use only and is not a recommendation or endorsement of any particular investment or investment strategy. Investment information provided in this content is general in nature, strictly for illustrative purposes, and may not be appropriate for all investors. Read more