NVDA surpasses expectations again. Can AI spark more stock gains? (11/21/2024)
Hello, everyone! This week, our spotlight falls on Nvidia Corporation $英伟达 (NVDA.US)$ , a titan in the semiconductor industry that has once again delivered stellar financial results. In this article, we’ll explore the latest trends and examine the company’s recent market activity.
What’s new?
On Wednesday, November 20, 2024, Nvidia surpassed expectations in its third-quarter earnings report, demonstrating robust growth driven by persistent high demand for its advanced artificial intelligence (AI) chips.

The tech giant expects fourth-quarter sales to be around $37.5 billion, give or take 2%, which is higher than the $37.08 billion forecasted by analysts surveyed by LSEG. This projection indicates a year-over-year growth of about 70%, a significant figure, though it marks a slowdown from the remarkable 265% growth seen in the same period last year.
Nvidia’s stock underwent a brief turbulence on Thursday, initially plunging more than 3% before rebounding to close with a modest 0.53% gain. While the exact catalyst for this temporary downturn remains elusive, it likely stems from the lofty expectations surrounding this AI powerhouse.
Nvidia has emerged as the primary beneficiary of the ongoing AI revolution. Its shares have nearly tripled in value throughout 2024, catapulting the company to become the most valuable publicly traded entity globally.
Goldman Sachs analyst Toshiya Hari on Nvidia’s earnings: “Nvidia’s FY 3Q results exceeded expectations. We see strong demand for Blackwell, continued Hopper shipments through 2025, and supply constraints as the main challenge. We maintain a Buy rating on NVDA, which remains on the Americas Conviction List.”
Goldman Sachs analysts project a 13% upside potential for Nvidia over the next year, with an average price target of $165.18. This positive outlook reflects broader market sentiment. According to moomoo data, NVDA stock has a Strong Buy consensus rating, supported by 40 Buy recommendations compared to just one Hold.

Chart of the day
Trend analysis:

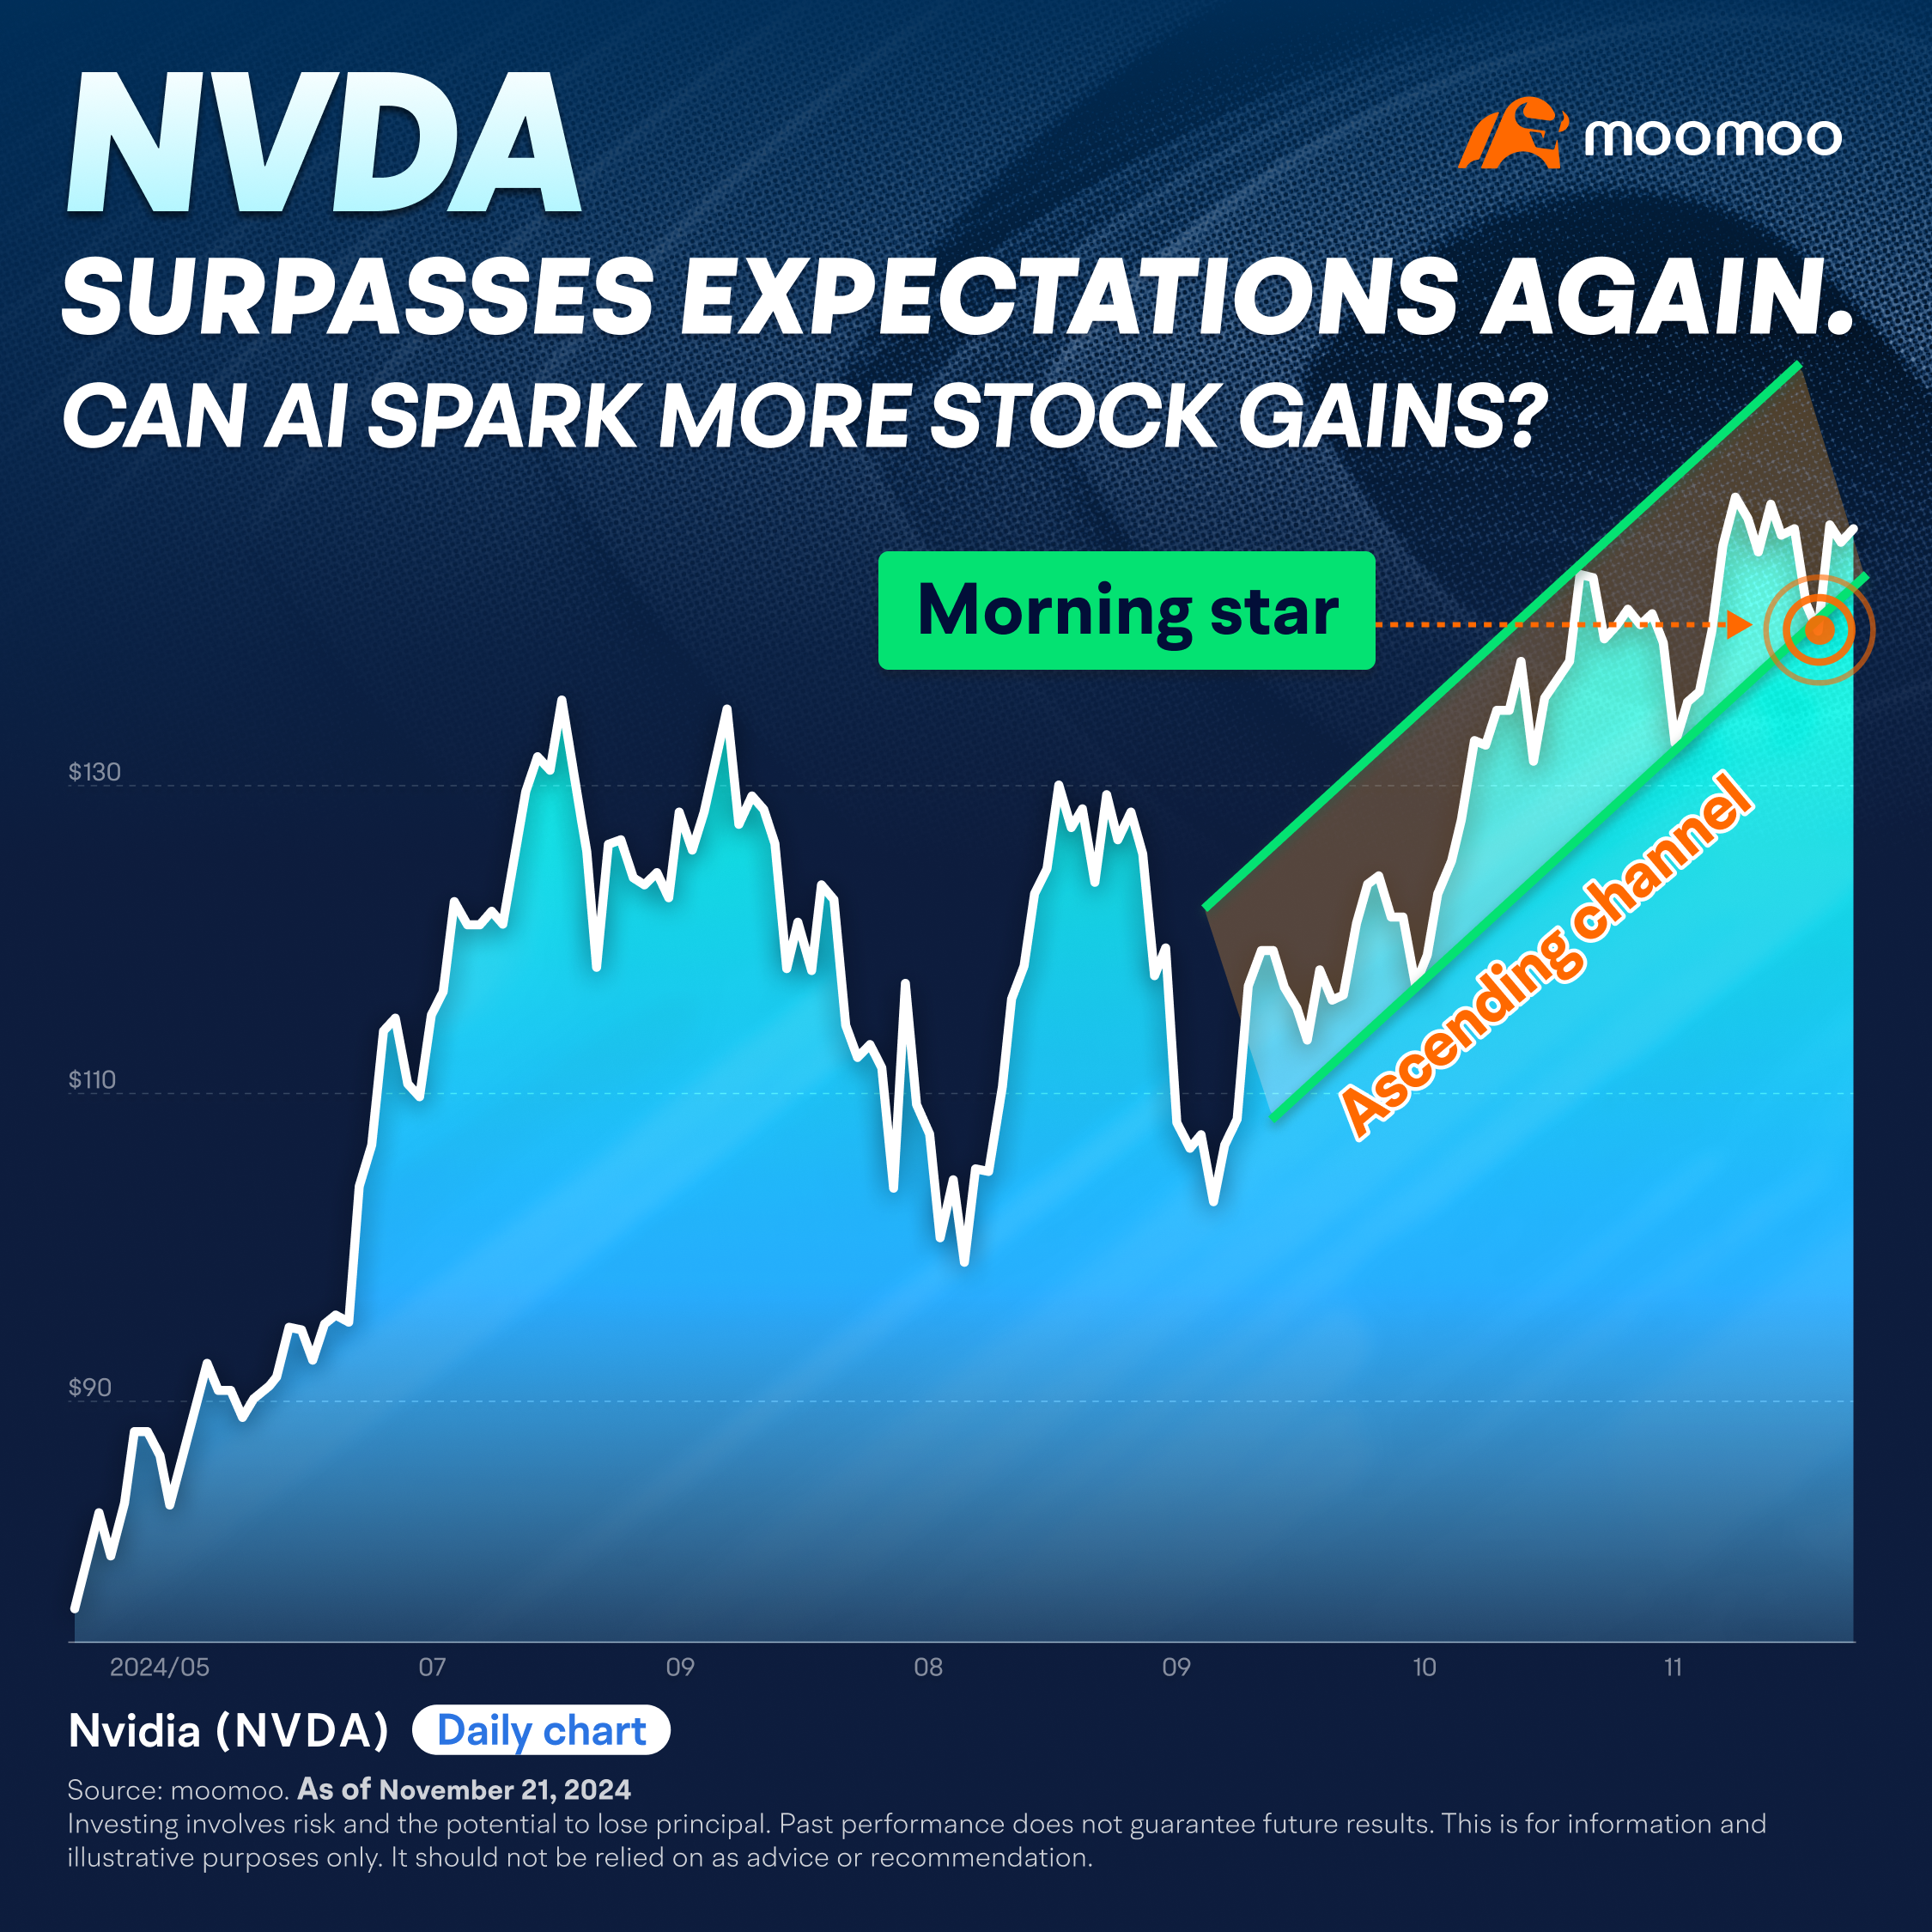
Nvidia’s stock (NVDA) is exhibiting a robust uptrend, navigating within a well-defined ascending channel over recent months, as evidenced by the daily chart. The share price has recently approached the lower boundary of the established channel, which may suggest a temporary shift in market sentiment. While this movement could be interpreted as short-term bearish pressure, it’s important to note that such fluctuations are common within broader trends. At this juncture, the overall uptrend and the structure of the ascending channel appear to remain in place, though investors should continue to monitor future price action and relevant market factors for any significant changes.
Technical indicators:
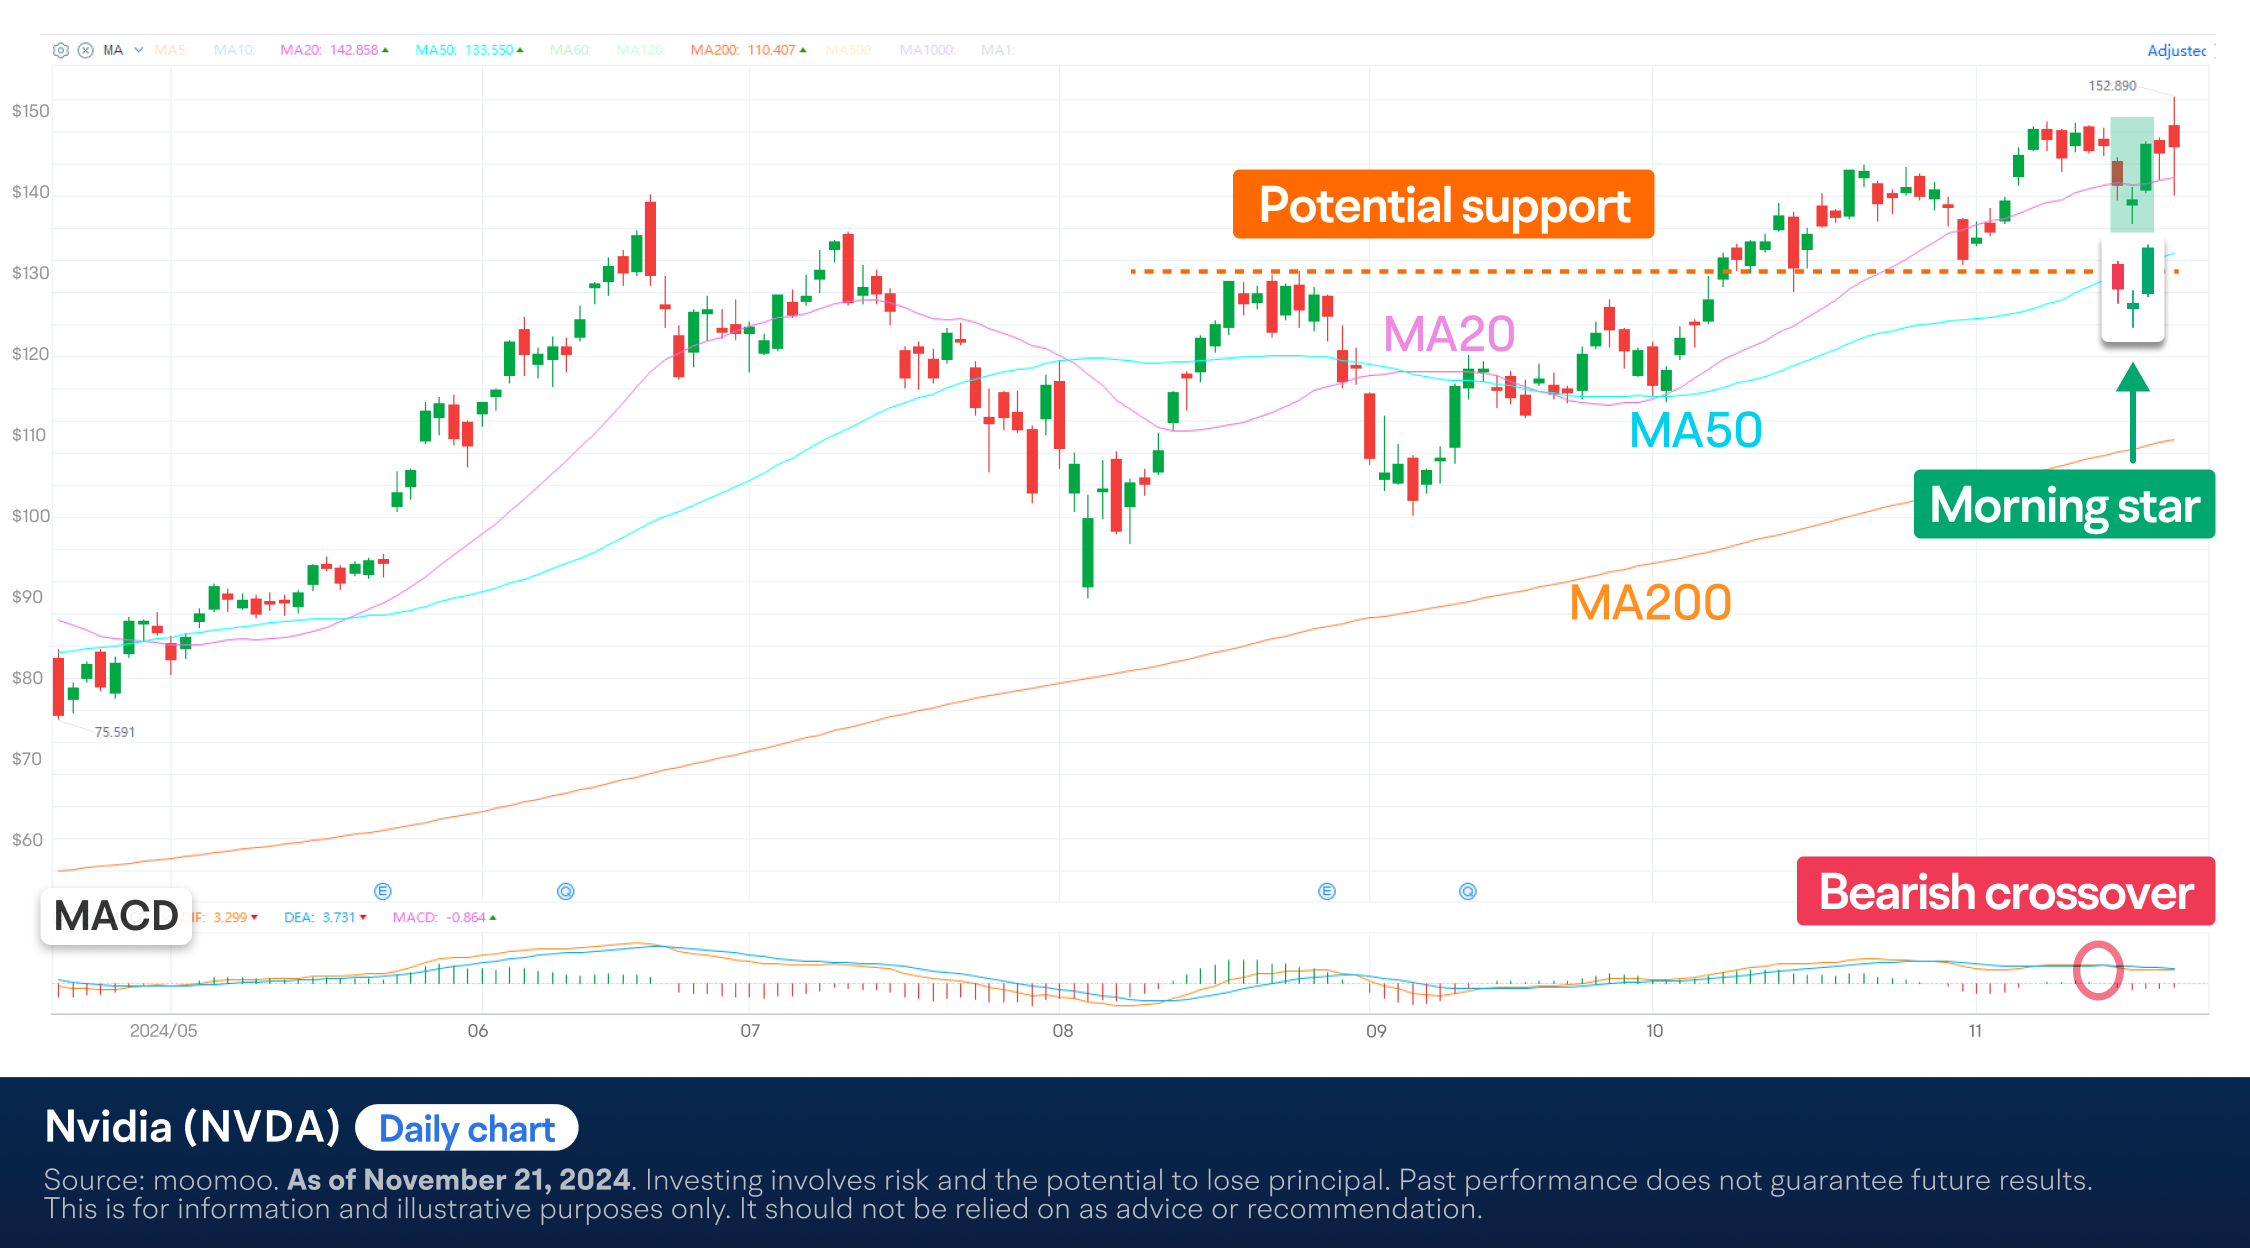
● NVDA’s moving averages (MAs) are displaying a bullish configuration, with the shorter-term MAs positioned above their longer-term counterparts. This alignment is considered a robust indicator of positive market sentiment, suggesting sustained upward momentum for the stock.
● The MACD indicator has recently exhibited a bearish crossover while remaining above the zero line. This technical formation suggests a potential short-term pullback or consolidation phase, despite the overall bullish trend.
● A morning star pattern has materialized amidst a temporary price retracement, manifesting as a three-candlestick bullish reversal formation accompanied by heightened market volatility. This important candlestick pattern might signal a return of positive momentum, suggesting the stock’s upward movement might resume soon.
● A potential support level to watch has emerged around $131, with aligns with the previous resistance high set on August 26. This price point is significant as it marks where the stock broke through former resistance, leading to new all-time highs.
In conclusion, although NVDA has experienced some short-term selling pressure, its overall trend and established price channel seem to be holding steady. The stock reached a new record high after its third-quarter results, despite increased volatility. This behavior may reflect a typical market reaction, with some investors opting to take profits after recent gains. Such actions can often result in periods of price stabilization.
This presentation discusses technical analysis, other approaches, including fundamental analysis, may offer very different views. The examples provided are for illustrative purposes only and are not intended to be reflective of the results you can expect to achieve.
All investment involves risk, including the potential loss of principal, and there can be no guarantee that any investment strategy will be successful.
This presentation is for informational and educational use only and is not a recommendation or endorsement of any particular investment or investment strategy. Investment information provided in this content is general in nature, strictly for illustrative purposes, and may not be appropriate for all investors. Read more