PDD Holdings stock tumbled by 28%! What will happen next? (08/28/2024)
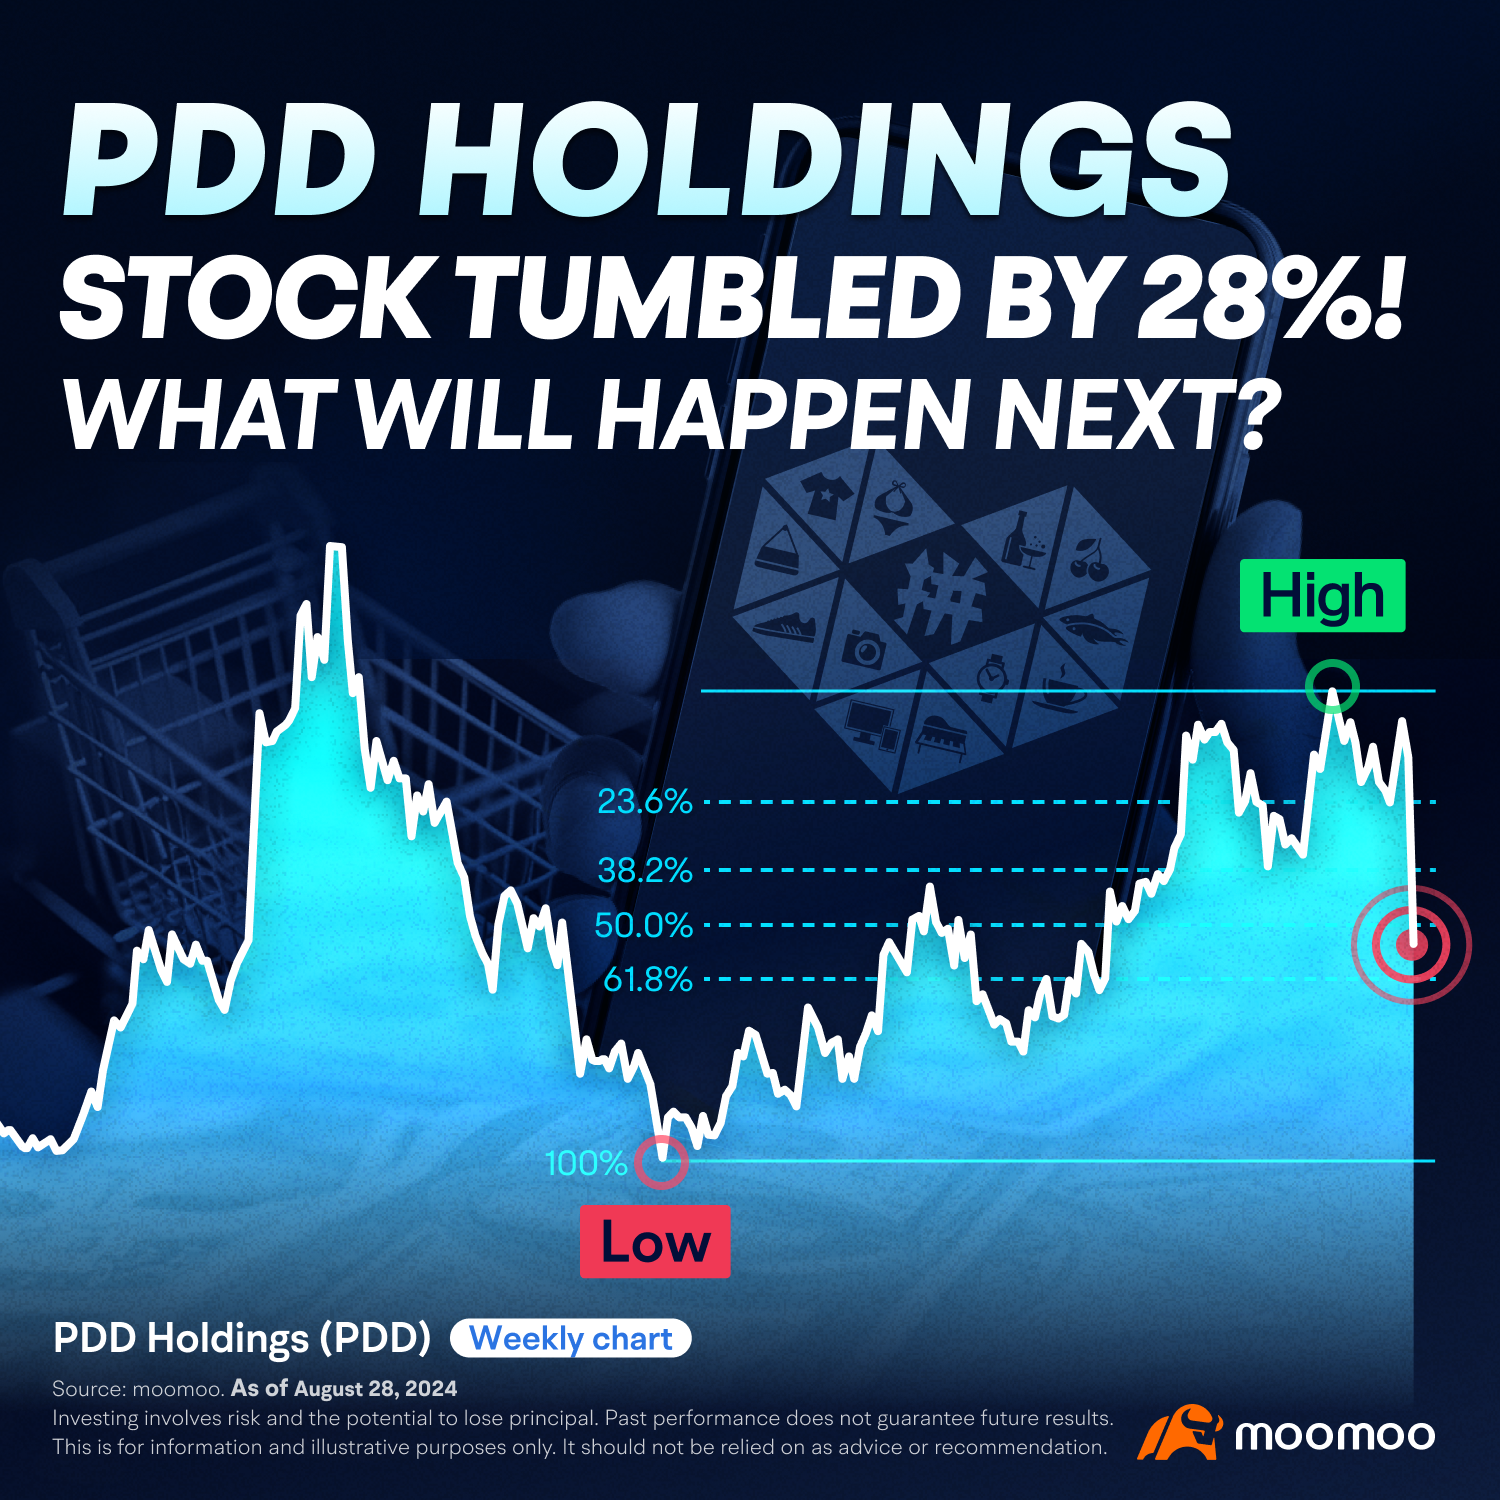
Hello, everyone! This week, let's focus on $PDD Holdings (PDD.US)$ , an e-commerce company known for its discount platforms: Pinduoduo in China and Temu for international markets. In this article, we'll explore the latest trends and examine the company's recent market activity.
What's new?
On August 26, 2024, PDD's shares dropped by over 28% after the company missed market expectations for its quarterly revenue and executives made pessimistic comments about the competitive landscape in China's domestic e-commerce sector.
This marked the largest single-day decline in PDD's stock since its debut in 2018, erasing approximately $55 billion in market capitalization.
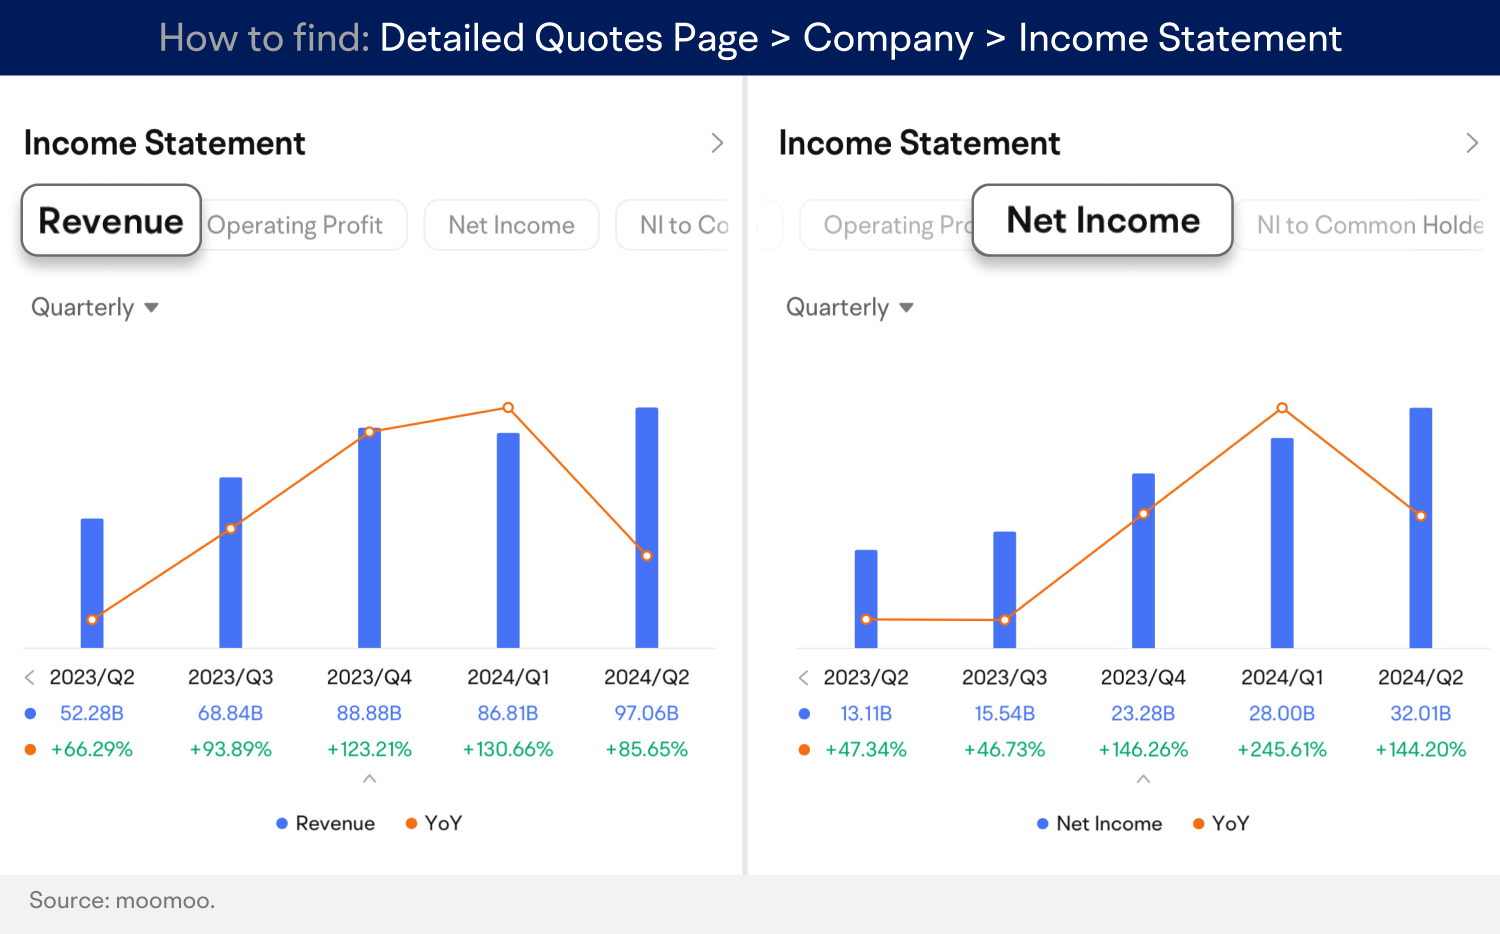
PDD reported second-quarter revenue of 97.06 billion yuan, or $13.6 billion, reflecting an 86% increase YoY. However, this figure fell short of analysts' expectations of 100 billion yuan, according to LSEG data. Despite this, the company's net income surged by 144% YoY to reach 32.01 billion yuan.
In the earnings release, Lei Chen, the chairman and co-CEO of PDD, expressed optimism about the company's solid progress in recent quarters but acknowledged that many challenges lie ahead. He emphasized PDD's readiness to make short-term sacrifices and potentially face a decline in profitability as it focuses on substantial investments in areas like trust and safety, along with enhancing its merchant ecosystem.
After PDD's earnings release, Macquarie analysts downgraded the stock to Neutral due to "lower financial visibility". Citi analysts also adjusted their rating on the stock from Buy/High Risk to Neutral/High Risk, attributing this change to "limited investor communication, lack of operating metrics and financial breakdown disclosure, and management’s intentionally cautious outlook comment."
Meanwhile, other Wall Street firms offered somewhat more positive views. JPMorgan noted that while the financial outlook may be clouded by reinvestment plans, they believe that the upcoming investments will not hinder PDD's double-digit profit growth, given its consistent market share expansion in China and the potential profitability of Temu alongside rapid growth.
Chart of the day
Trend analysis:
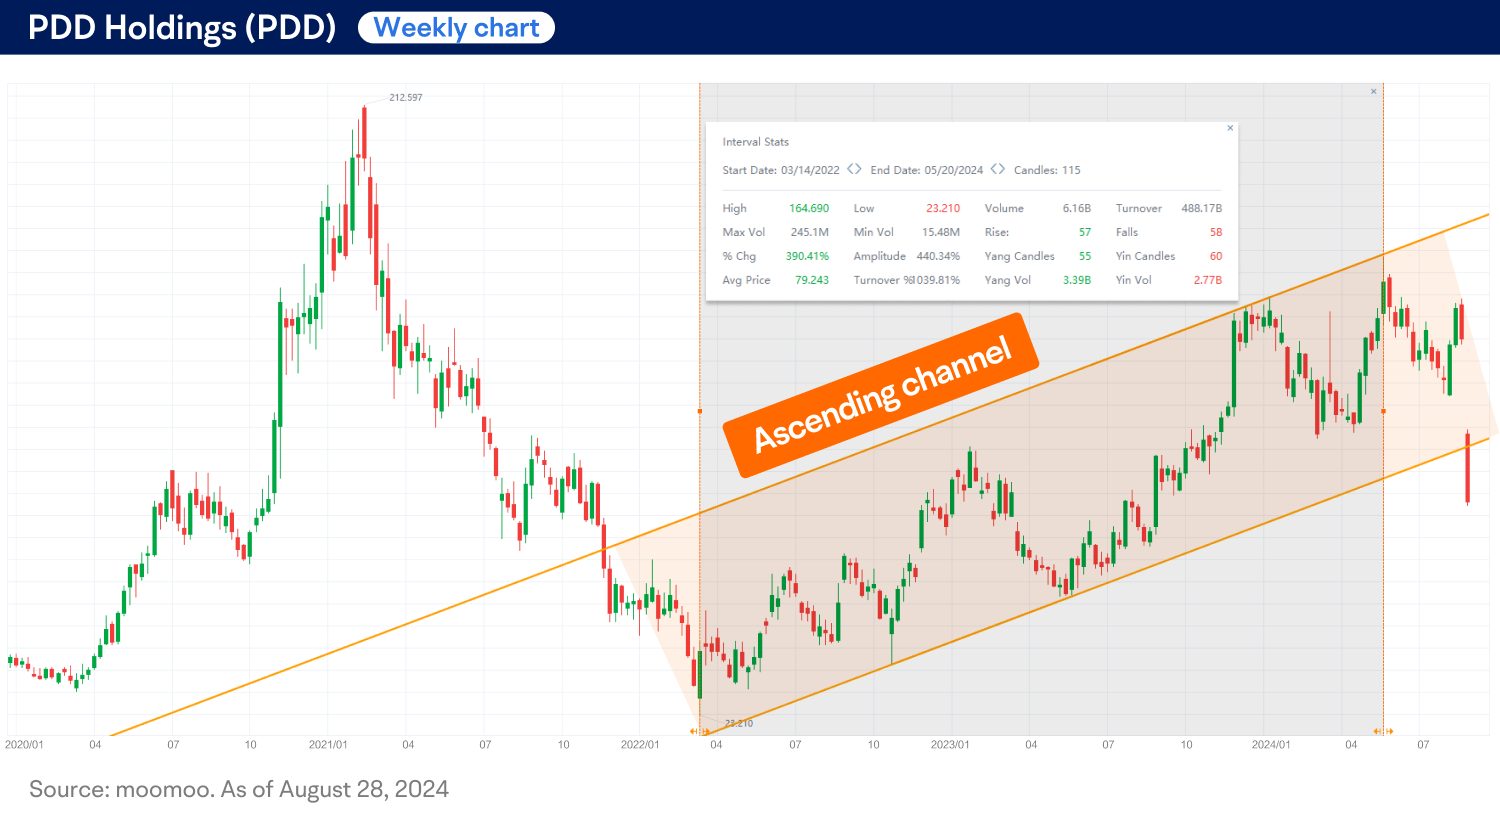
PDD Holdings' shares (PDD) have been on a steady upward trajectory since March 2022, following an ascending channel pattern, as shown on the weekly chart above. The stock price saw an impressive gain of nearly 400% over the past two years. However, a sudden 28% drop in a single day signaled a breakout from the channel and the possibility of a long-term trend reversal to the downside.

The Fibonacci retracement tool is used by connecting the high point of $164.69 to the low point of $23.21, revealing a retracement of the stock price between the critical 50% and 61.8% levels. Some traders might argue that if the price falls below the 61.8% retracement level ($77), it could signal a reversal in the trend rather than just a temporary correction.
Technical indicators:
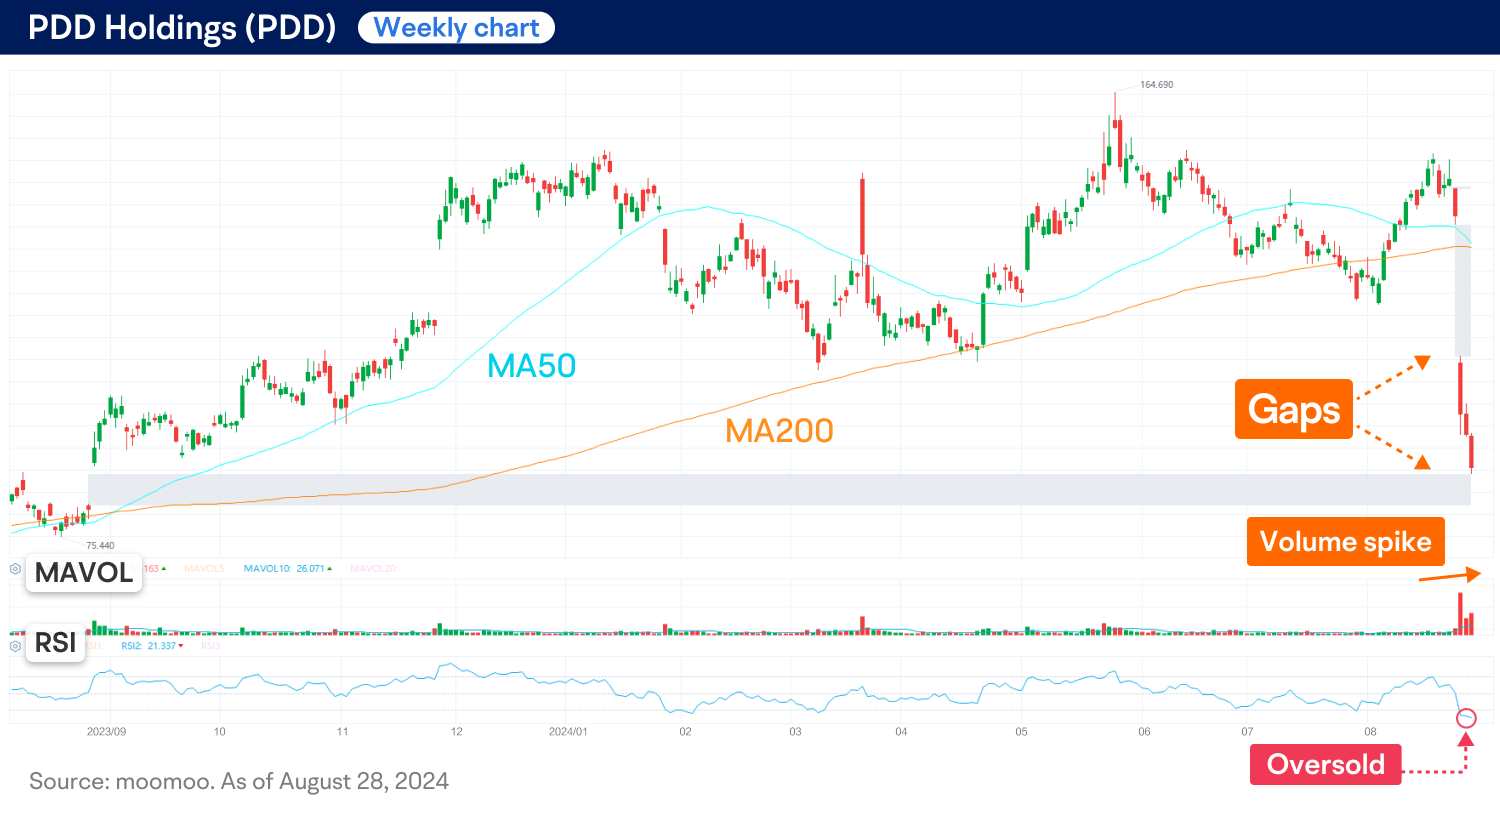
PDD is currently trading significantly below its major moving averages (MAs), such as the 50-day and 200-day MA. This reflects a substantial selloff and a prevailing bearish market sentiment resulting from its recent earnings report.
The trading volume has surged alongside a four-day streak of price declines exceeding 4%, signaling heightened selling pressure and market panic.
The stock appears to have been oversold, as evidenced by the 14-day relative strength index (RSI) dipping below 30.
Next move?
PDD is currently trading at a 52-week low, showing no clear signs of an immediate rebound. Traders may want to monitor the 61.8% Fibonacci retracement level, located around $77 and highlighted on the previous weekly chart. A potential breach below this level is expected to indicate a trend reversal to the downside; otherwise, the price movement could be viewed as a correction of the prior uptrend.
This presentation discusses technical analysis, other approaches, including fundamental analysis, may offer very different views. The examples provided are for illustrative purposes only and are not intended to be reflective of the results you can expect to achieve.
All investing involves risk, including the potential loss of principal, and there can be no guarantee that any investing strategy will be successful.
This presentation is for informational and educational use only and is not a recommendation or endorsement of any particular investment or investment strategy. Investment information provided in this content is general in nature, strictly for illustrative purposes, and may not be appropriate for all investors. Read more