AMD at record highs: Time to take profits? (03/04/2024)

Hello, everyone! Welcome back to “Technical Tracking.” This week, we’re going to explore the latest trends and analyze what’s happening with Advanced Micro Devices, or AMD$Advanced Micro Devices(AMD.US)$.
What’s new?
AMD’s stock soared to a historic $300 billion market cap on Thursday, Feb. 29, 2024, ascending from the 222nd to the 22nd largest company in the S&P 500 within five years—an extraordinary leap.
Earlier Thursday, Citigroup Inc. wrote that it remains “wildly bullish on semis,” especially as “the AI market continues to grow” and the demand for AI chips becomes more widespread. The firm singled out AMD as one of the stocks it favors, along with Nvidia Corp. and Broadcom Inc.
However, despite the stock’s impressive performance, it’s trading at a steep 50 times estimated earnings, significantly higher than Nvidia’s 32 times, hinting at a pricier valuation.
While more than 75% of the institutions recommend buying AMD according to Bloomberg, the stock’s current price aligns closely with analysts’ average price target. This alignment implies that there might be little room for the share price to rise further.
Chart of the day
AMD is currently trading at record highs after the price breaks out of a roughly month-long sideways trading pattern resembling a rectangle. The following day’s gain indicates that bulls are likely to take control of the market. Although there is no obvious potential resistance for the price, selling pressures might occur as some traders lock in profits.
Trend analysis:
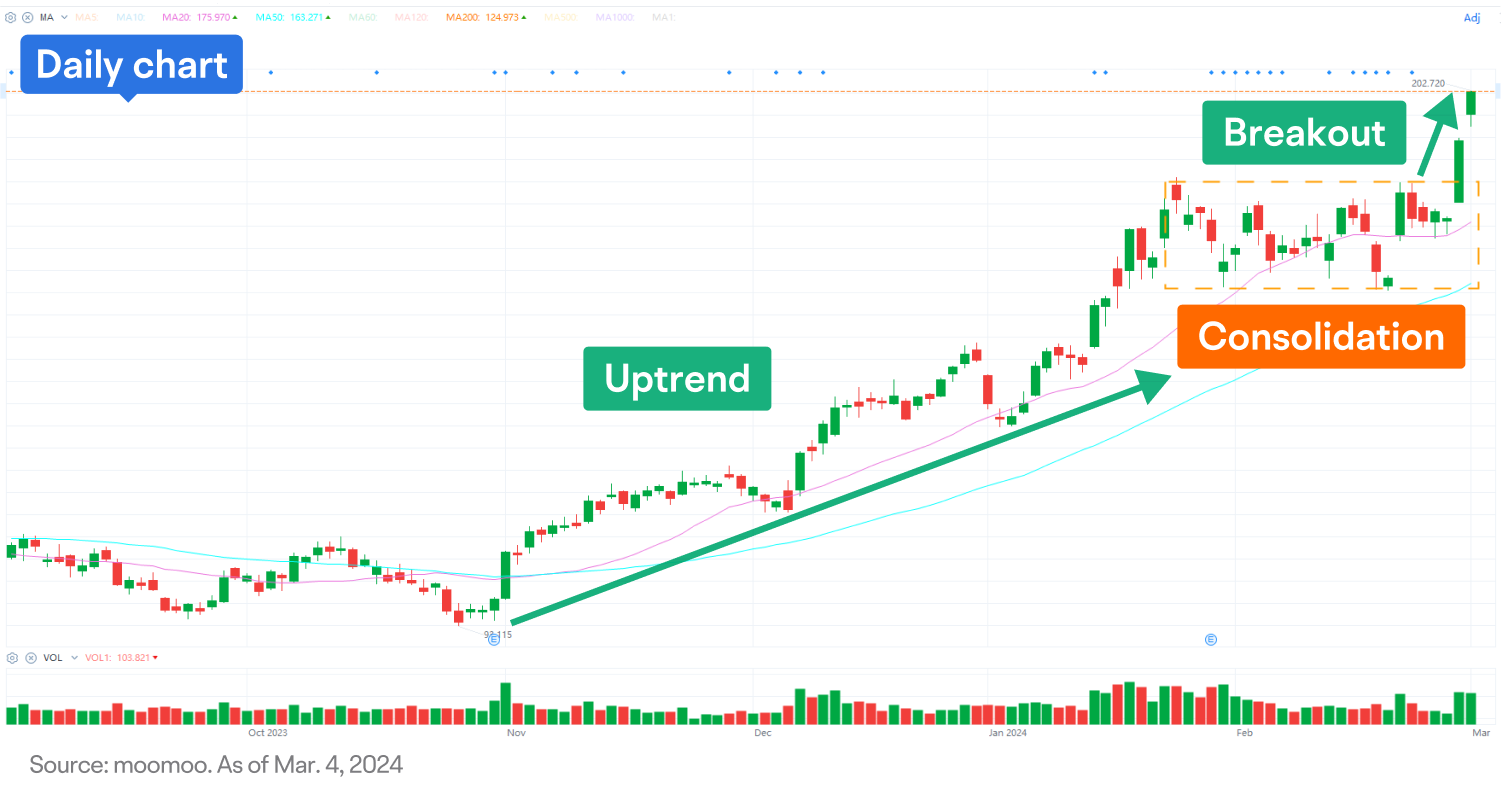
1. AMD began a strong uptrend in late October 2023. The price has almost doubled in 4 months, indicating bulls are steadily in control.
2. The stock then went into consolidation, with the price oscillating in a rectangle-like range that lasted about 1 month.
3. The price jumped significantly, breaking above the rectangle-like formation and showing upside momentum.
Technical indicators:
AMD has been trading above the 50-day and 200-day moving averages for multiple months, which is considered a medium-term bullish signal.
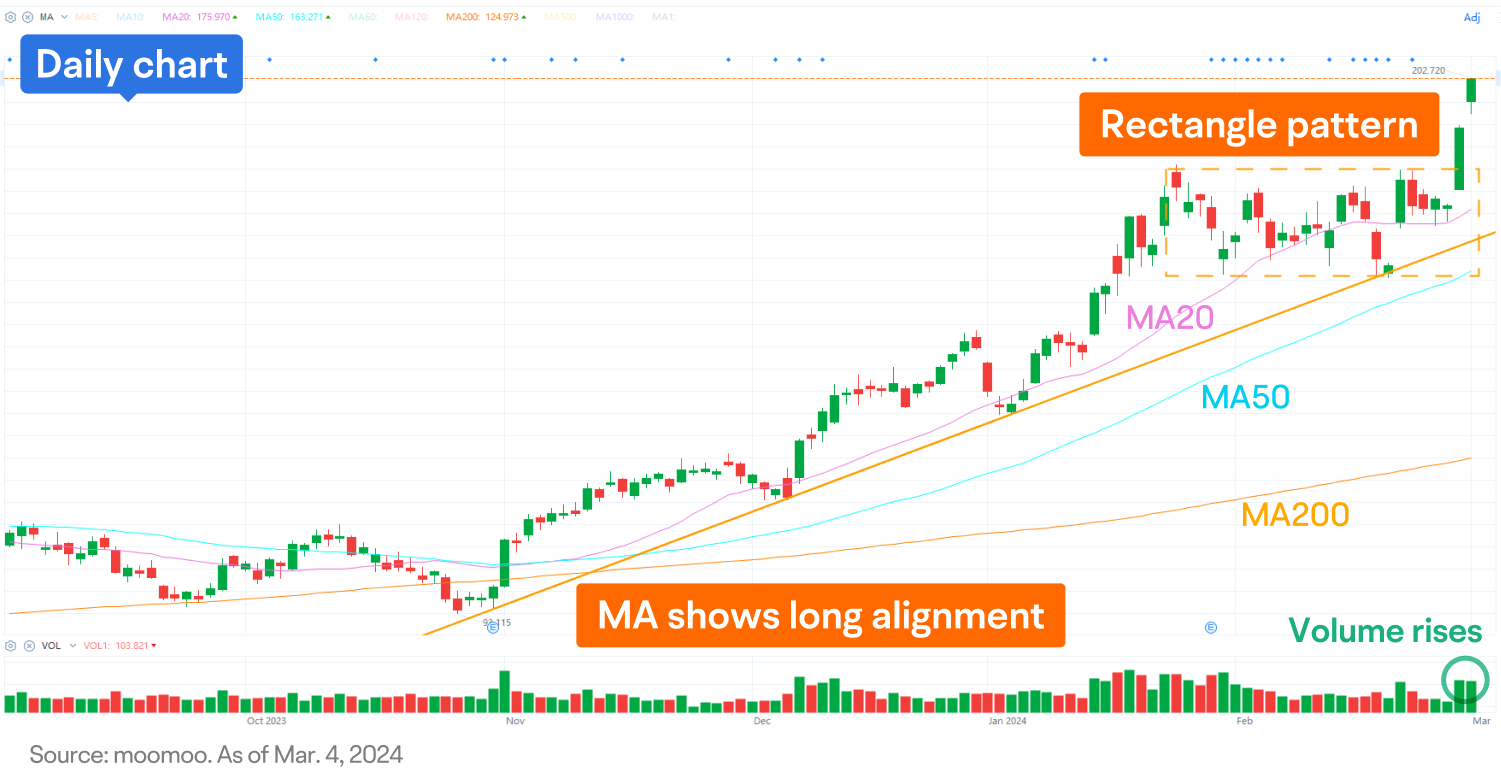
The stock oscillated in a rectangle pattern before breaking out. Traders might argue that after the breakout of the pattern, the price is likely to move approximately the height of the rectangle in the direction of the breakout.
Next move?
Looking ahead, if the stock experiences a pullback, the breakout point near $184 could serve as a key support level for a retest.
Bullish investors may target the rectangle pattern’s projected price of around $207.
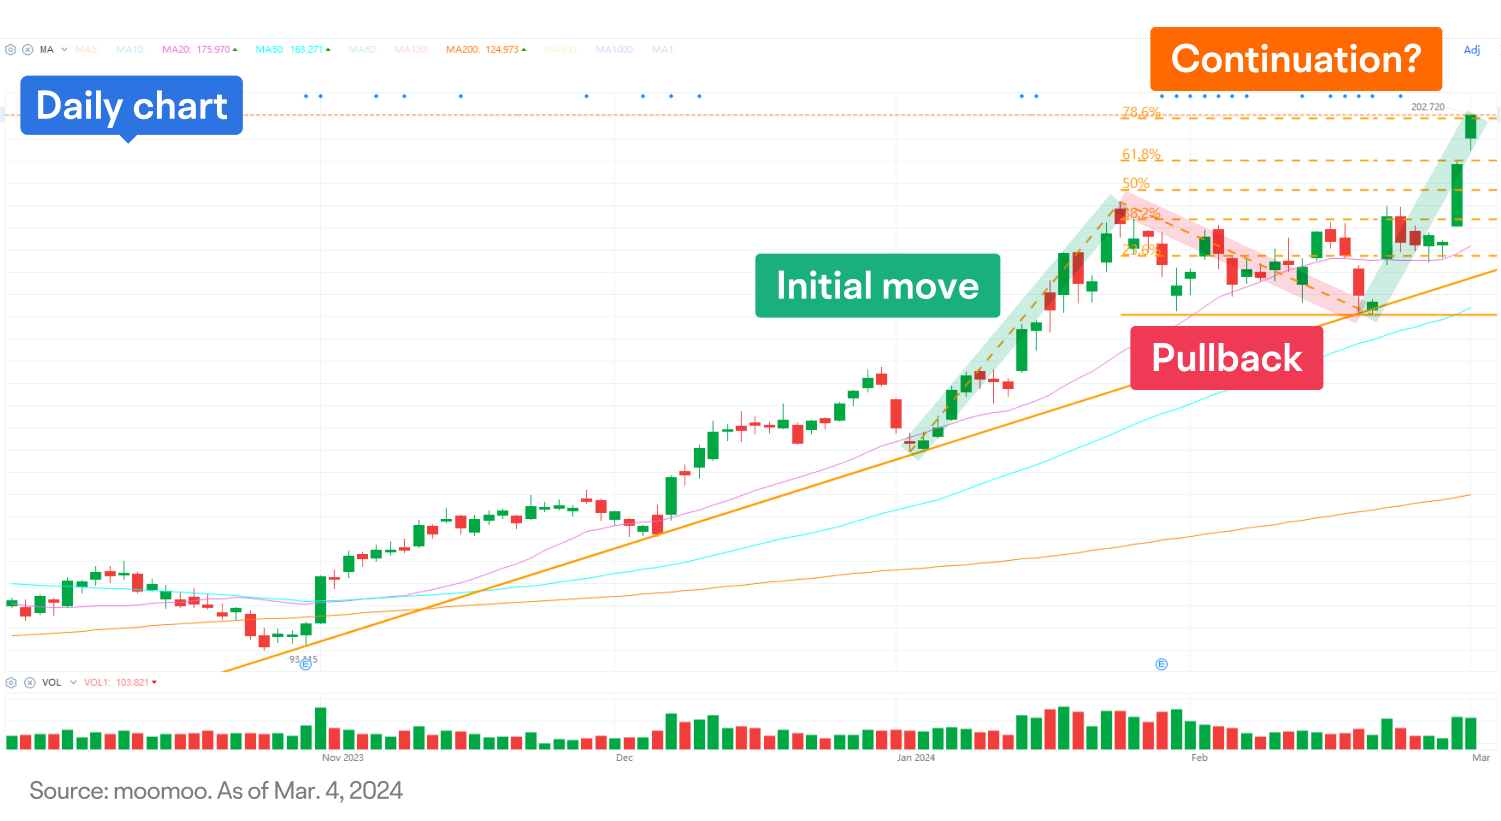
Additionally, traders might also use the Fibonacci extensions tool to pinpoint potential resistance or take-profit levels.
This presentation discusses technical analysis, other approaches, including fundamental analysis, may offer very different views. The examples provided are for illustrative purposes only and are not intended to be reflective of the results you can expect to achieve.
All investing involves risk, including the potential loss of principal, and there can be no guarantee that any investing strategy will be successful.
This presentation is for informational and educational use only and is not a recommendation or endorsement of any particular investment or investment strategy. Investment information provided in this content is general in nature, strictly for illustrative purposes, and may not be appropriate for all investors. Read more