Stock Price Falls After Earnings. What's Next?

In the US stock market, an earnings release may move the company's stock price up or down a lot.
For example, when Tesla released its earnings after the market close on April 19, 2023, the company's stock price fell 9.75% by the end of next day.
If you own Tesla stock, what would you do after the earnings miss?
● Decide to hold onto your Tesla stock despite short-term swings because you think the company will do well in the long run.
● Sell your Tesla stock right away attempting to cut losses?
● Sell your Tesla stock and establish a bearish position thinking the stock price would go down even further.
Your choice may depend on your financial objectives, risk tolerance, and other personal situations.
In this article, we'll introduce an event pattern called Bad Earnings Surprises, which may help you forecast the potential price movements after an earnings miss.
01 What is a Bad Earnings Surprise
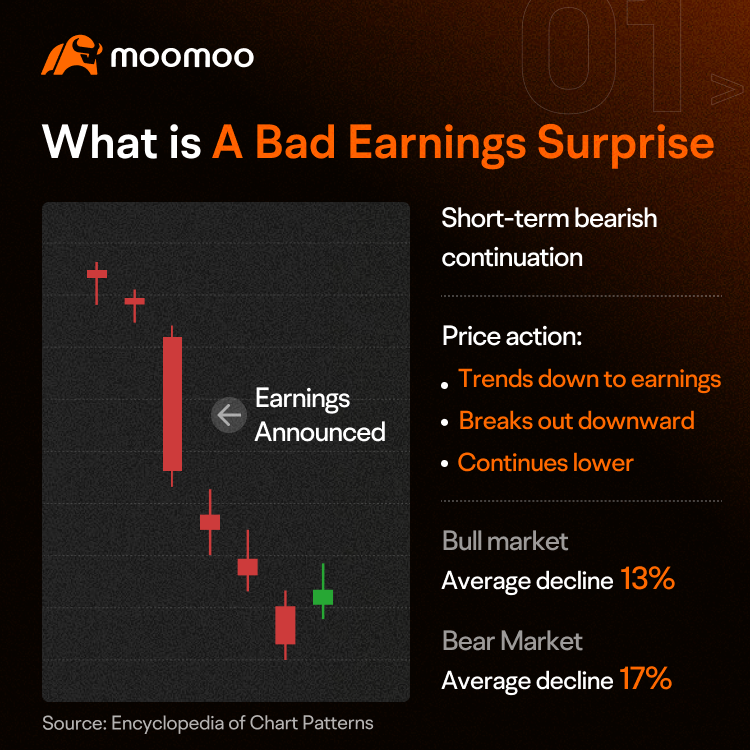
A bad earnings surprise is an event pattern in which a company announces earnings and the stock price drops, as the market interprets it worse than expected.
First identified by Thomas Bulkowski, in the fall of 2003, this pattern is considered a short-term bearish continuation pattern.
Here is how the pattern may potentially happen. The stock price trends down before the earnings announcement then breaks out downward after a bad earning, and then continues to go lower.
Bulkowski's research indicates that in bull and bear markets, the stock price can fall by an average of 13% and 17%, respectively. [1] However, once the price reaches the ultimate low, it can potentially recover by 51% in a bull market and 37% in a bear market. [2]
Therefore, for many long-term investors, the decline after the earnings report may not be a terrible thing in the long run.
[1] Source: Encyclopedia of Chart Patterns. Page 856.
[2] Source: Encyclopedia of Chart Patterns. Page 856.
02 Identification Guidelines
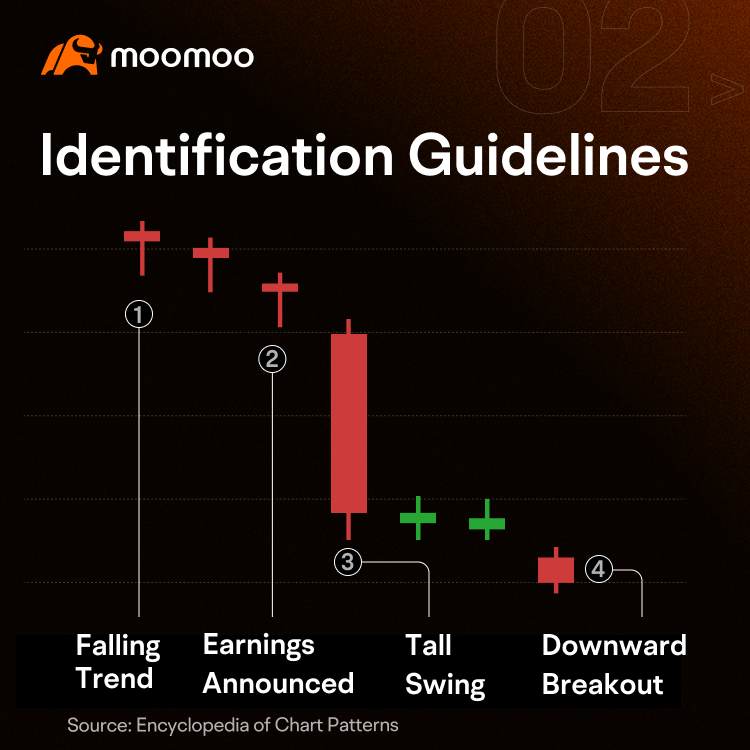
Bulkowski listed the following conditions before identifying these patterns.
Falling trend: Before a company announces its earnings, check if the stock price has been going down.
Announcement: On the day the company announces its earnings, the stock price usually experiences a significant drop, either on the same day (earnings before the market opens) or before the end of the next trading session (earnings are released after the market closes).
Tall swing: When a company announces its earnings, check if the stock price makes a larger-than-usual intraday move as a result. This means that the candlestick for that day is longer than usual, and the intraday move is typically 2 or 3 times larger than the average daily intraday price range of the previous month. The pattern tends to perform better when a tall price swing occurs.
Downward breakout: A downward breakout occurs when the price closes below the intraday low posted on the announcement day. Then you can consider placing a trade. As a precaution, it helps to look for any support zones that may prevent further potential declines in stock prices.
03 Strategy
As an investor, after identifying this pattern, what should you consider doing?
Thomas Bulkowski has summarized some trading strategies based on the features of this pattern.
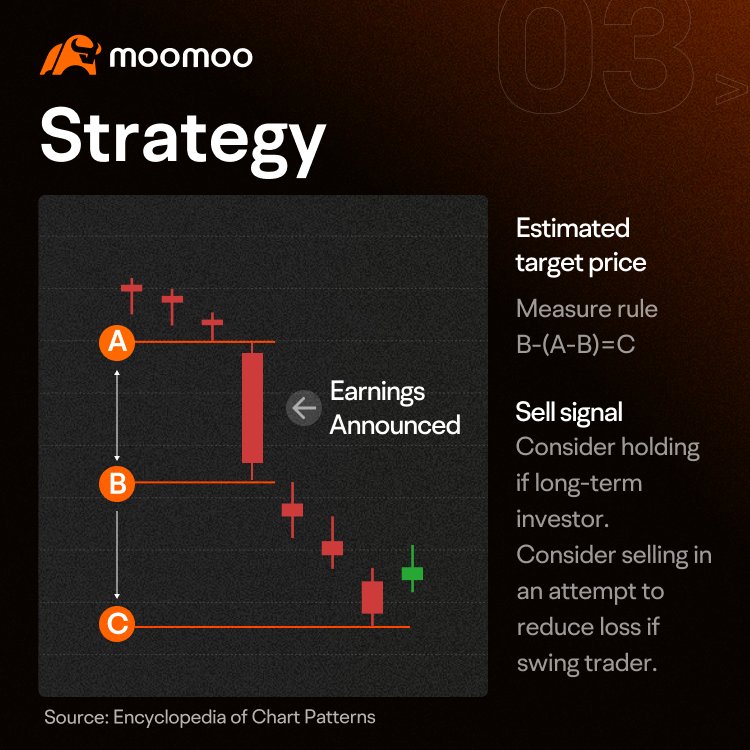
Longer-term investors: If you plan to invest in the long term, you may not choose to take any action when the stock price drops after an earnings announcement because the decline is relatively small. However, it's important to remember that negative surprises may appear again in the following quarters.
Swingers: Swing traders who own the stock may consider selling it to attempt to cut losses because the stock price may drop by an average of 17% in a bear market. [3]
Short sellers: if you're an aggressive investor, you might choose to take a bearish position in an attempt to potentially profit from this pattern. In a bear market, a sell-short signal occurs when the stock price breaks out downward and closes below the low of the pattern. The stock price may hit the bottom in less than a week, so you need to watch it closely. Always remember, when short selling there is no limit on how high a stock price could rise so the potential loss is unlimited. Other risks include dividend risk and margin risk. This strategy is not appropriate for all investors.
Measure rule: To estimate the target price or how far the stock price may drop, we can use the measure rule. On the announcement day, subtract the intraday low (B) from the high (A) and then subtract the difference from the intraday low (B). The result is an estimated price target (C).
Confirmation: To help avoid false signals, traders should consider waiting for a confirmation. Sometimes, traders may push the price up by reacting too soon. A confirmation of the pattern typically occurs with a downward breakout, which is when the price closes below the low posted on the announcement day (point B in the figure to the right).
[3] Source: Encyclopedia of Chart Patterns. Page 856.
04 Example
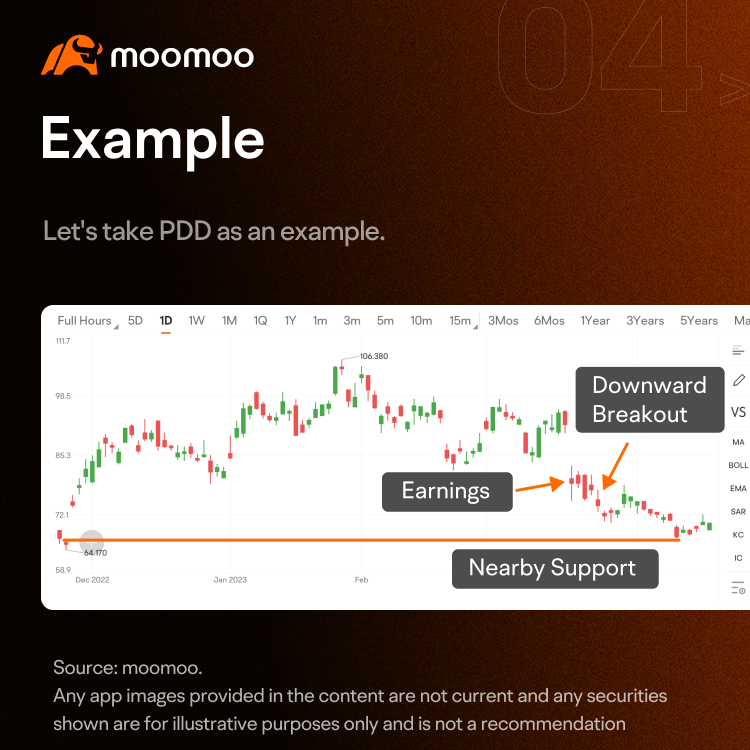
Let's take PDD as an example.
Before the 2022 Q4 earnings announcement, a falling trend could be identified in its stock price, suggesting a continuation of the downward trend.
On the announcement day, the price opened with a gap down and had a significant intraday move. The intraday high was US$82.80, and the low was US$75.
According to the measure rule, the target price was estimated to be at least US$67.20.
After that, the stock price consolidated for a while and finally closed below $75 on the fourth trading day after the earnings, confirming the pattern.
The stock price then continued to drop and finally reached the forecasted target price of $67, which also neared a potential support level formed earlier.
05 Summary
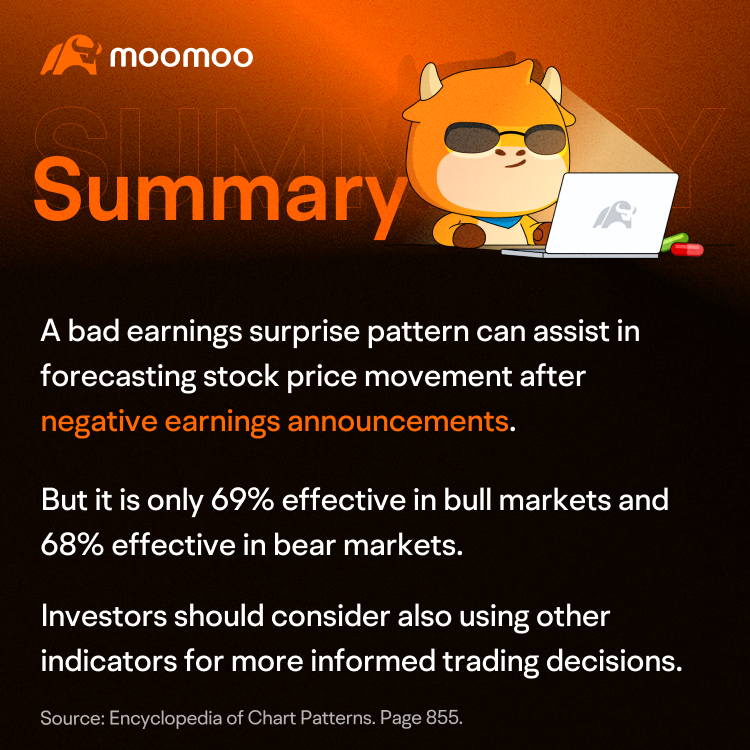
A Bad Earnings Surprise pattern is an event-driven short-term bearish continuation pattern.
It can help investors determine the potential price movement of a stock after an earnings announcement.
However, it's important to note that this pattern is not very reliable, as only 69% and 68% of cases in bull and bear markets, respectively, reach the forecasted target price, according to Bulkowski's statistics. [4]
Hence, it's important to consider other fundamental and technical analysis indicators to make informed trading decisions.
[4] Source: Encyclopedia of Chart Patterns. Page 855.
Additional disclosures: This presentation discusses technical analysis, other approaches, including fundamental analysis, may offer very different views. The examples provided are for illustrative purposes only and are not intended to be reflective of the results you can expect to achieve. Specific security charts used are for illustrative purposes only and are not a recommendation, an offer to sell, or a solicitation of an offer to buy any security.
This presentation is for informational and educational use only and is not a recommendation or endorsement of any particular investment or investment strategy. Investment information provided in this content is general in nature, strictly for illustrative purposes, and may not be appropriate for all investors. Read more