What to Expect from the Upcoming Fed Meeting (0318-0322)
Weekly Overview of Global Markets
Market Review and Outlook
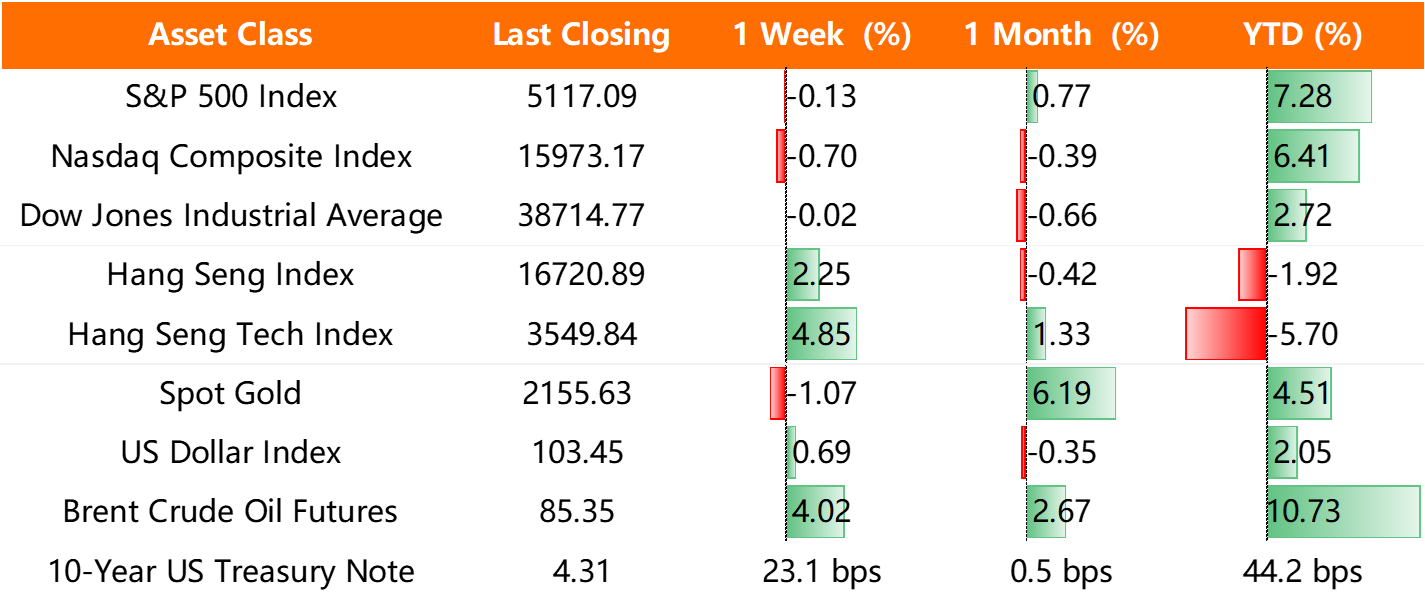
Weekly performance of major asset classes: Hong Kong stocks> Crude Oil > US dollars > US stocks > Gold > US bonds
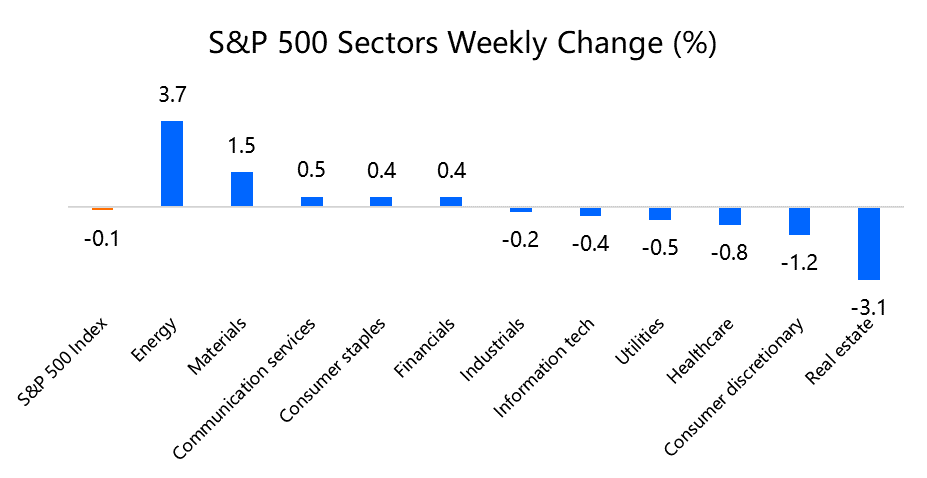
Stocks: Last week, the US stock market experienced volatility largely due to a combination of factors such as inflation data, technology stocks, and Bitcoin. While Bitcoin continued its record-breaking rally, the stock market fell on Thursday after US inflation data exceeded expectations, and US bond yields rose and ending a three-day streak of gains. NVIDIA's stock price also fell for the fifth consecutive trading day, dropping more than 3%. However, the S&P 500 index saw 17 closing record highs in the first 50 trading days of the new year, making it the fourth highest year for record highs since 1953. This year, the concentration of the US stock market is more concentrated in 2024 than in 2023, with Barclays' stock strategist analysis attributing 20% of the S&P 500 index's gains this year to NVIDIA, Apple, Alphabet, and Tesla. Despite this, Barclays Bank remains optimistic about the stock market's prospects due to large technology company stock prices benefiting from better earnings, a not-too-bad macroeconomic outlook, and historical factors that drive stock market gains usually persisting.
Bonds: The bond market saw slight increases in US Treasury yields on Tuesday as investors evaluated key inflation data, which was in line with expectations and increased the possibility that the Fed may wait until later this year to start cutting interest rates. However, February Producer Price Index (PPI) rose more than expected on Thursday, likely causing bond yields to rise in intraday trading, with the benchmark 10-year Treasury yield reaching 4.29%. The trend in the bond market indicates investor caution regarding whether recent economic data is "too strong" and concerns that the Fed may not be able to ease monetary policy.
Gold: As the Fed meeting approached and strong inflation data suppressed gold prices, the market became concerned about long-term high interest rates, causing gold prices to plummet after hitting a historic high last Monday. After PPI was released and was higher than expected on Thursday, gold prices gave back gains from Wednesday. Although gold prices gained some positive momentum on Friday, traders are still looking for a clearer path for the Fed to cut interest rates, suggesting that precious metals may have certain limitations.
Crude Oil: US crude oil inventories unexpectedly fell last week as refineries continued to increase capacity utilization. Furthermore, the International Energy Agency's report predicted an oil supply shortage in 2024. Afterwards, crude oil futures rose on Thursday, extending gains from the previous trading day, with US WTI crude oil prices soaring to $81. The crude oil market will be further discussed in detail in the following "Weekly Hot Topics" section.
Note: The weekly performance of major asset classes is ranked based on the weekly change in the asset class as shown in the table above, with ">" indicating the ranking from highest to lowest. US bonds are ranked based on the change in futures prices. Past returns do not guarantee future returns.
Data source: Bloomberg. Date as of March 15th, 2024
Weekly Hot Topic
After news of an oil supply shortage in 2024, US crude oil prices have surged to $81
The International Energy Agency (IEA)'s latest report forecasts a supply shortage in 2024, with demand growth exceeding expectations from last month, seemingly leading to another rise in oil prices.
On Thursday, the US benchmark West Texas Intermediate crude oil (WTI) increased by 2% to $81.29 per barrel, approaching its highest level in 2024. Similarly, the international benchmark Brent crude oil increased by 1.7% to $85.42 per barrel, reaching its highest level this year.
Multiple factors have contributed to a greater demand for oil than supply
Demand: Several factors have contributed to the greater demand for oil than supply, including improved US prospects and higher fuel consumption exceeding expectations. The IEA's March report indicates that global oil demand is expected to increase by 1.7 million barrels per day in the first quarter of 2024, with expected demand increasing by 1.3 million barrels per day compared to the previous estimate of 110,000 barrels per day.
Supply: The supply is predicted to decrease by 870,000 barrels per day in the first quarter of 2024 compared to the fourth quarter of 2023. This is due to production disruptions caused by severe weather, conflict in the Red Sea region, and the impact of OPEC+ production cuts. Some OPEC+ member countries will extend their production cuts plan starting in the second quarter. This year's supply is expected to increase by 0.8 million barrels per day, but actual supply in the first quarter has decreased due to severe weather conditions.
Inventory: Last week, the US Energy Information Administration (EIA) released data showing that US crude oil inventories unexpectedly fell for the first time in seven weeks, due to refineries' continued increase in capacity utilization, which is another sign of demand exceeding supply. Commercial crude oil inventories, excluding strategic petroleum reserves, fell by 1.5 million barrels to 447 million barrels. EIA stated that Americans are using more gasoline, and gasoline inventories are also decreasing, despite a few months left until the summer diving season. The head of energy futures at Mizuho Securities states that strong demand for petroleum products such as gasoline and diesel is one of the reasons for the rise in oil prices, and the best rebound in crude oil is driven by product-led rebounds.
Oil stocks have benefited from the recovery in commodity prices
After months of decline, oil stocks have benefited from the recovery in commodity prices. Exxon Mobil's stock price rose 1.6% on Thursday, approaching its highest level since October last year. Diamondback Energy rose 1% for the eighth consecutive time, also likely to refresh its closing record. The Energy Select Sector SPDR Fund rose 0.8%.
Important Events Outlook for This Week
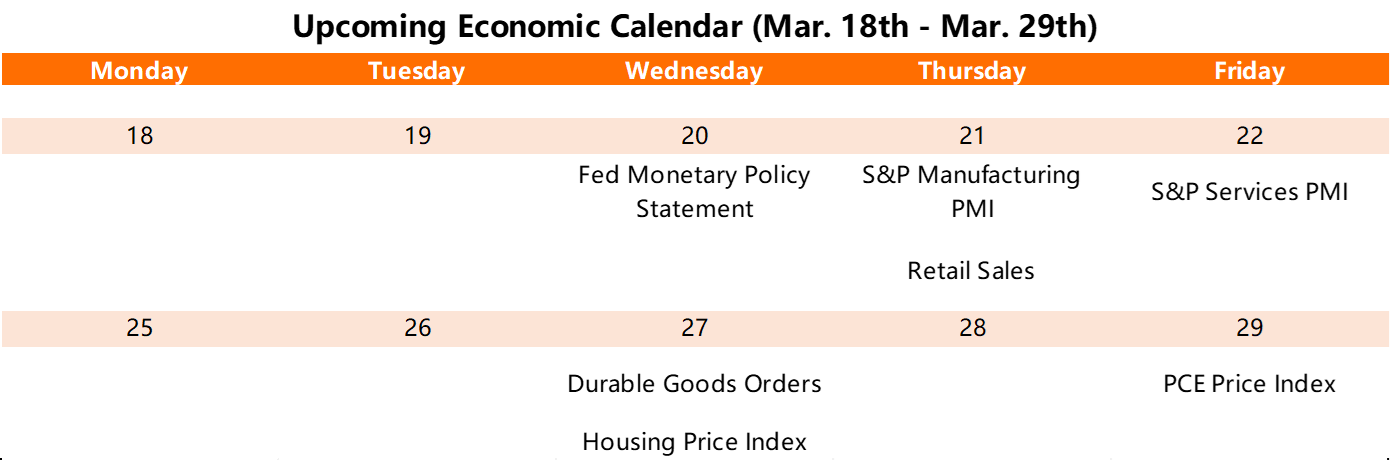
Note: The Upcoming Economic Calendar is selected from moomoo Financial Calendar.
What to expect from the March Federal Reserve meeting?
Interest rates: The upcoming Federal Open Market Committee (FOMC) meeting on March 19-20 is eagerly anticipated by the market as it will announce the federal funds target rate, which is the decision on whether or not to lower interest rates. The current target range is 5.25% to 5.5%, and it is widely expected that the interest rate will remain unchanged at the March meeting. Fed officials have recently indicated that it is unlikely that the interest rate will be raised from its current level and that a rate cut may be coming, but it is not imminent. According to the data from the CME Group's FedWatch tool, the earliest expected rate cut will start in June, with three to four rate cuts by 2024. This decision will have a significant impact on the market and the economy, and investors are closely monitoring the Fed's actions and statements to make informed decisions.
Fed Chair's speech: Federal Reserve Chair Jerome Powell will hold a press conference after the FOMC meeting, where he will provide more insights into the Fed's thinking and answer questions from the press. Currently, inflation has declined from its peak levels but has not yet reached the Fed's 2% annual target. Meanwhile, the overall performance of the labor market remains strong, with job creation and unemployment rates both better than expected. Powell is expected to emphasize the impact of these two aspects on implementing monetary policy, and strong data will encourage the Fed to remain patient when considering a rate cut. The Fed's decisions and statements will have a significant impact on the market and the economy, and investors will closely monitor Powell's comments for any indication of future policy changes.
Dot plot: At every quarterly meeting, the Fed releases a summary of economic projections, with the "dot plot" being the most closely watched. The dot plot estimates the level of interest rates that officials will give for the end of 2024, the next three years, and a longer period. The market is often more concerned about the Fed's interest rate projections for the next two years, and through the display of the dot plot, investors can infer when the Fed will take action and take corresponding measures in advance. This information is crucial for investors to make informed decisions and adjust their portfolios accordingly.
This presentation is for informational and educational use only and is not a recommendation or endorsement of any particular investment or investment strategy. Investment information provided in this content is general in nature, strictly for illustrative purposes, and may not be appropriate for all investors. Read more