Tesla surges 15% on Trump's win: Decoding the market's reaction (11/07/2024)

Hello, everyone! This week, our spotlight falls on $Tesla (TSLA.US)$, the innovative electric vehicle (EV) giant. In a stunning turn of events, former President Donald Trump has reclaimed the Oval Office. What might this mean to Tesla? In this article, we'll explore the latest trends and examine the company's recent market activity.
What's new?
On Wednesday, November 6, 2024, Tesla shares soared nearly 15%, hitting a new 52-week high. This remarkable rally came in the wake of Donald Trump's return to the presidency, as investors appear to believe that Musk-Trump alliance will boost Tesla's fortunes.
In a political move last month, Musk injected nearly $75 million into America PAC, a political action committee he founded earlier in the year to bolster the Republican nominee. Trump, in turn, has pledged to appoint Musk as the head of a government efficiency commission upon his election.
Several analysts believe Trump's win could fast-track Tesla's yet-to-be-realized true self-driving vehicles. Garrett Nelson, analyst with CFRA Research, anticipates Musk and Tesla to be significant winners in the post-election landscape, expecting quicker regulatory approvals for autonomous vehicles under the new administration. The analyst upgraded Tesla's stock from "Hold" to "Buy" and substantially increased his 12-month price target by $110 to $375 a share.
However, Trump's win presents a double-edged sword for Tesla. The President-elect has historically expressed skepticism towards electric vehicles, criticizing their cost, range limitations, and potential impact on jobs and the American auto industry.
Industry experts anticipate that Trump may dismantle the significant government support for EV development and adoption established under the Biden administration. This could include the termination of billions in loans incentivizing automakers to invest in EV and battery production facilities within the United States, as well as the elimination of charging station support and the $7,500 tax credit for electric car buyers.
Chart of the day
Trend analysis:
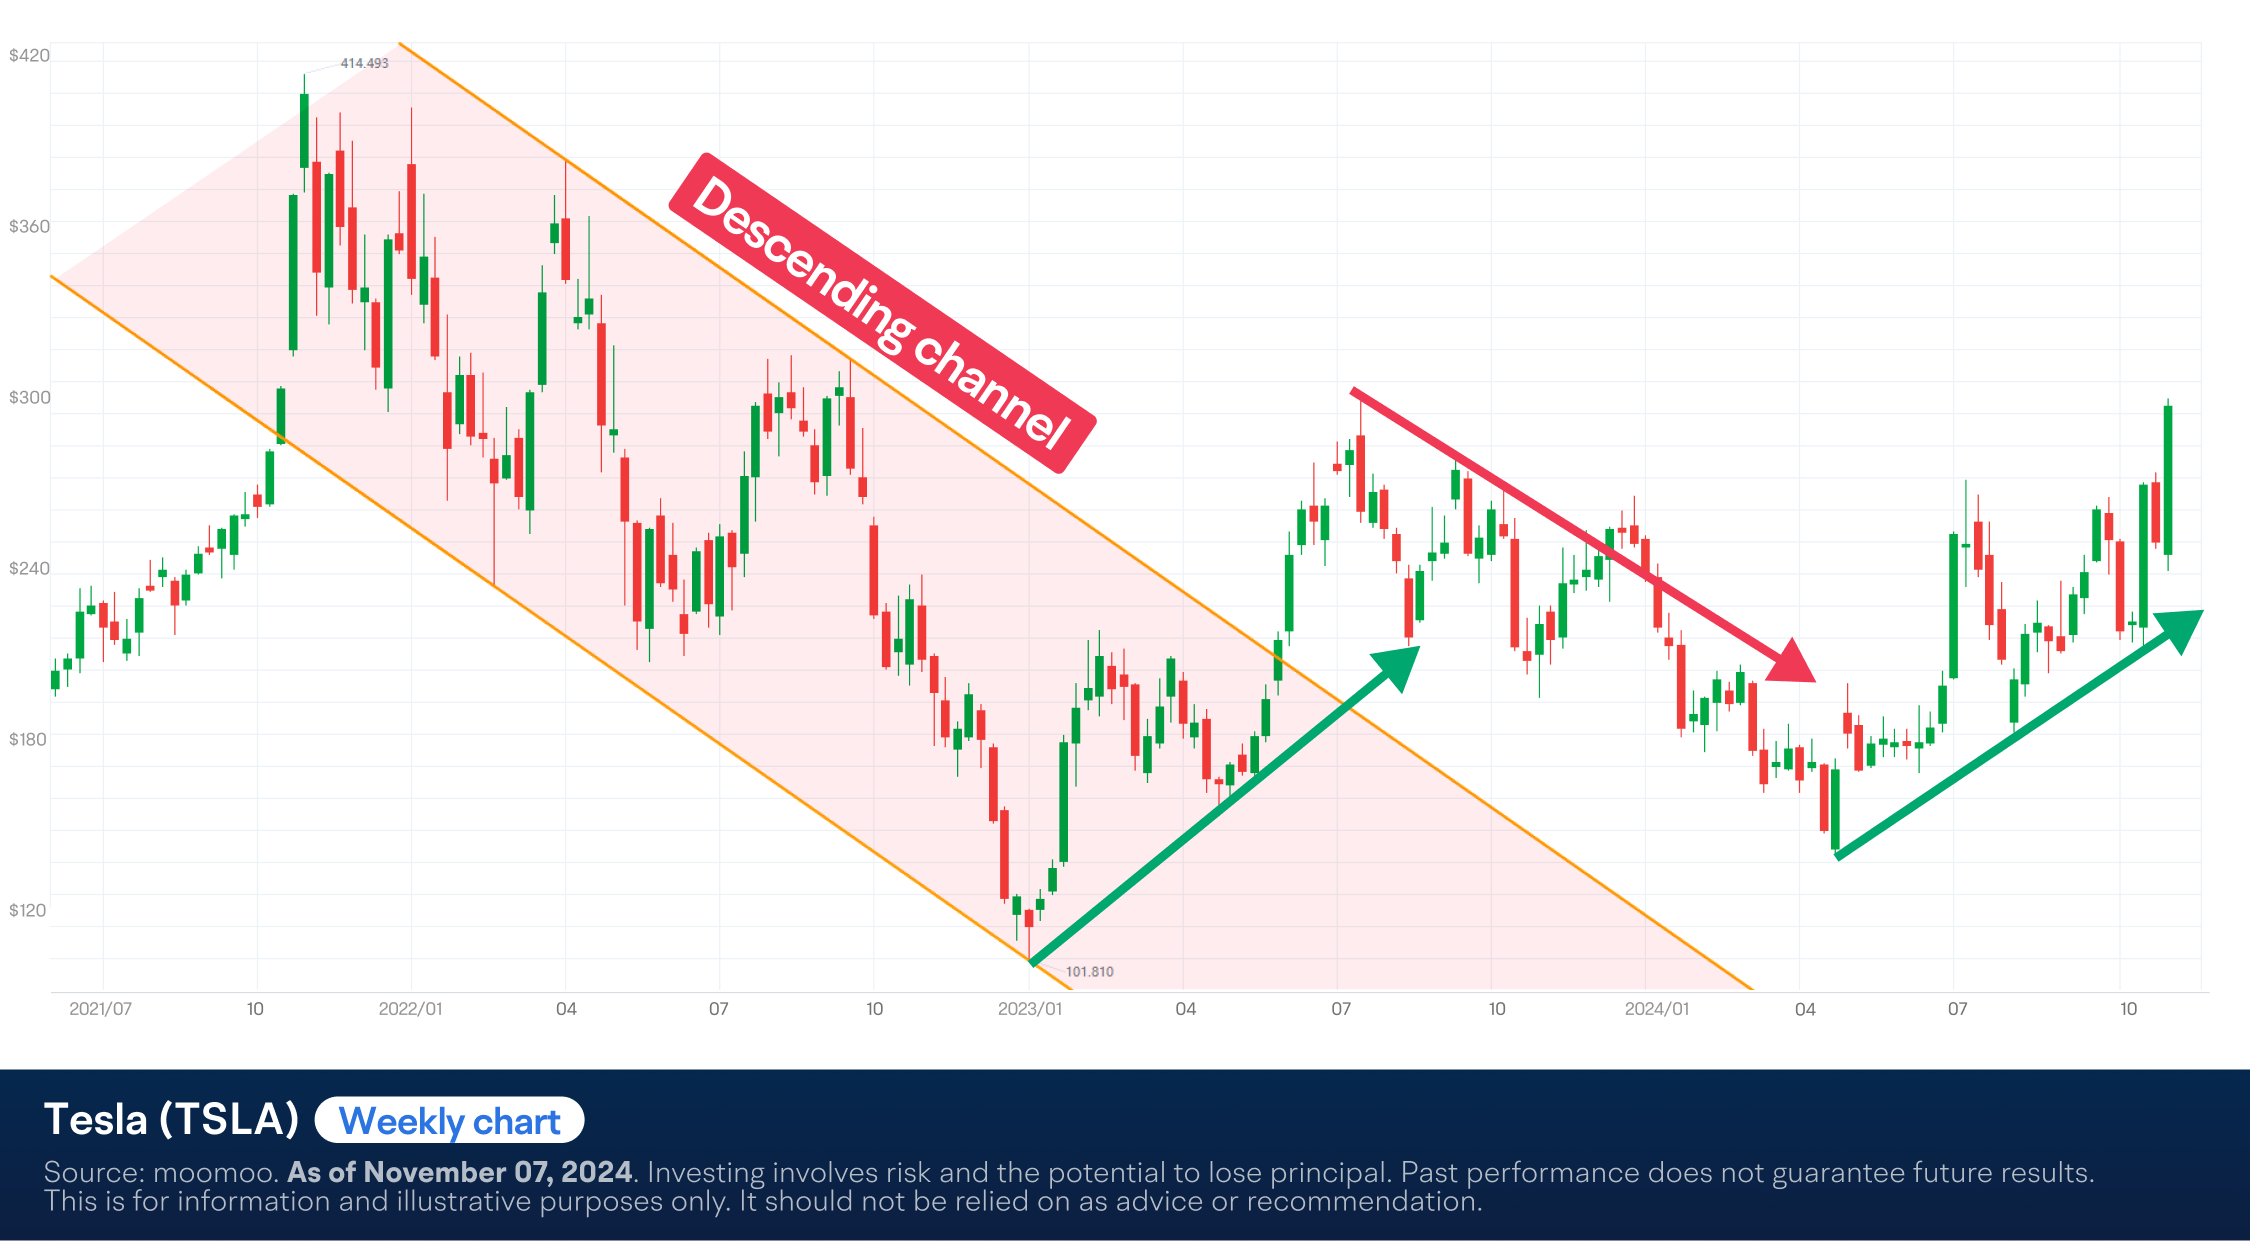
Tesla's shares ( $Tesla (TSLA.US)$ ) reached an all-time high at $414 in late 2021, then fell to a low of $101 in early 2023. During this period, the stock established a descending channel. Since then, the stock has bounced up and down, but is now climbing again and reaching a two-year high, as illustrated on the weekly chart.
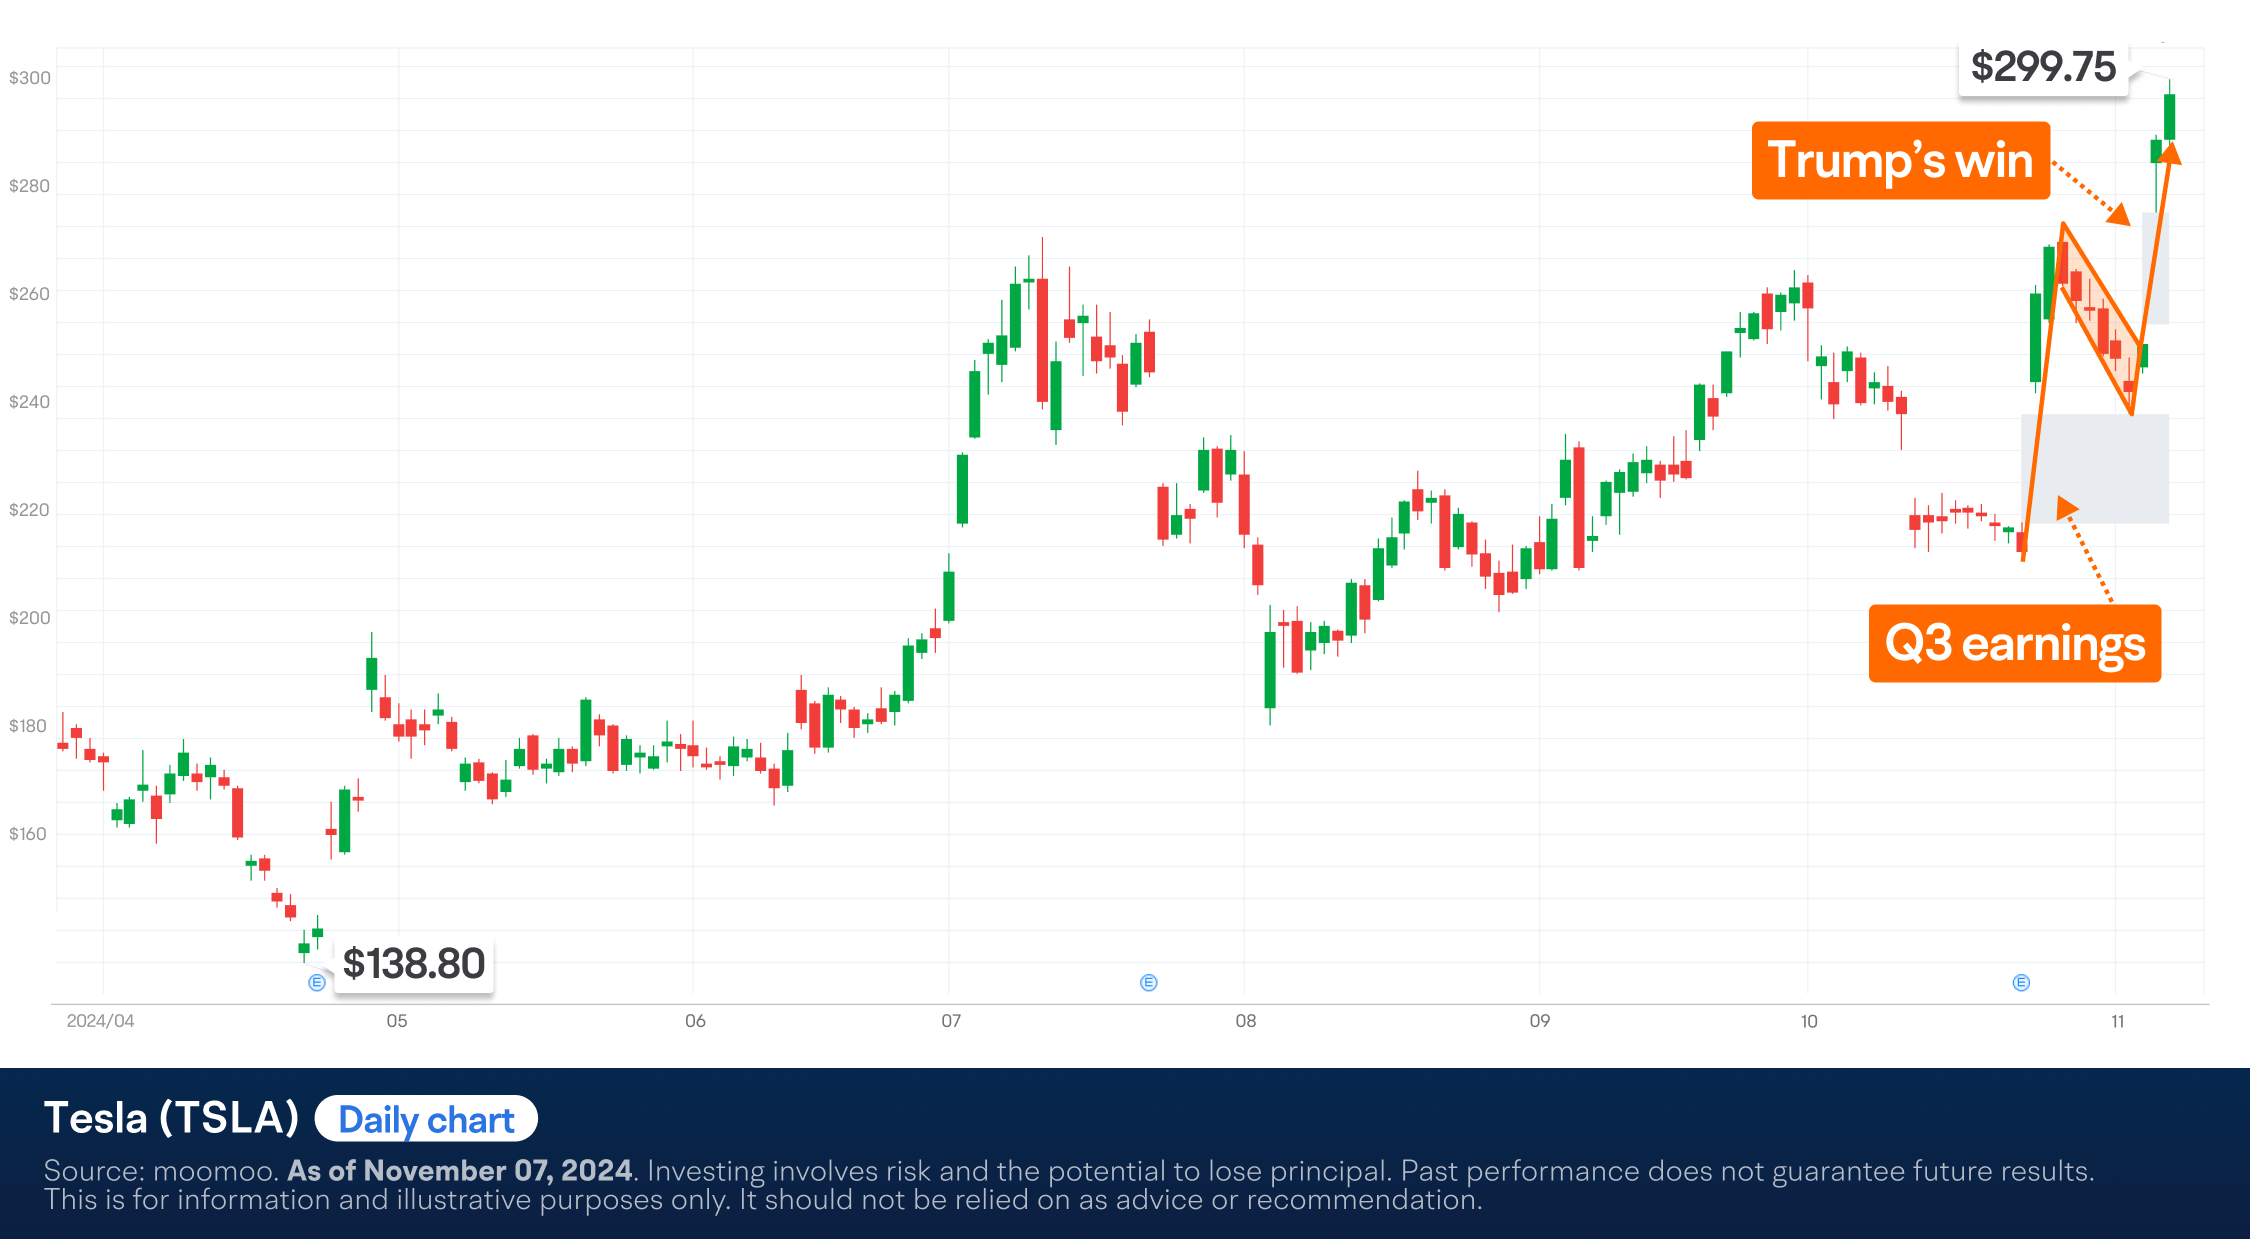
The daily chart reveals two significant price gaps upward, coinciding with major catalysts: Tesla's third-quarter earnings and Trump's election victory. In the wake of these events, the stock price has formed a bull flag pattern, suggesting potential for further upward momentum.
Technical indicators:
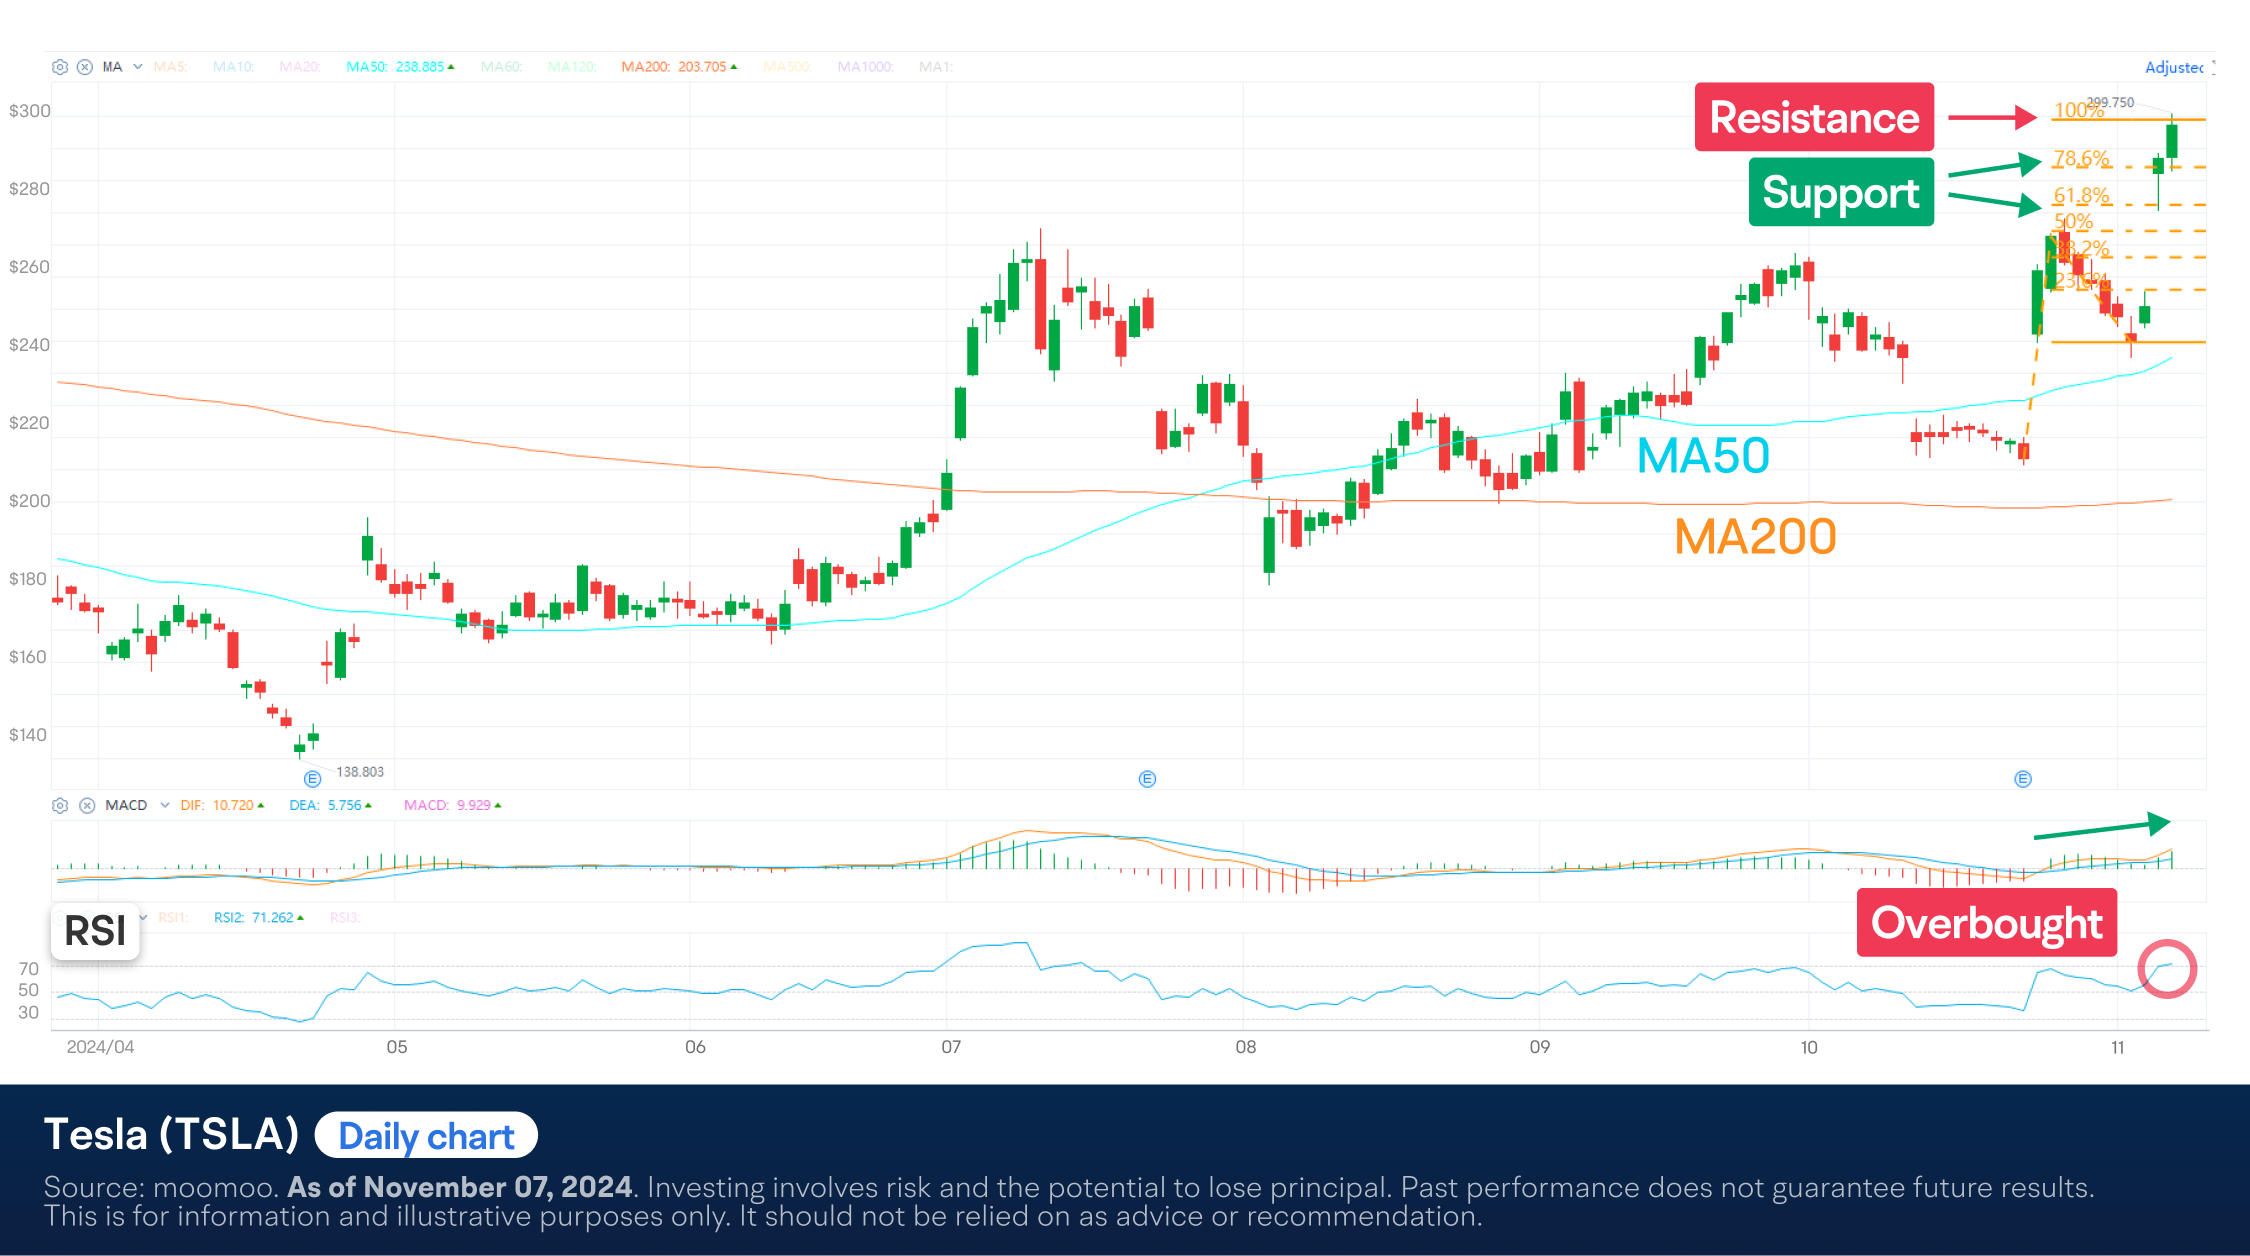
● TSLA is trading well above its major moving averages (MAs), including the 50-day MA and 200-day MA. This reflects a bullish market sentiment in the short term.
● The MACD indicator is currently positioned above the zero line, accompanied by an expanding histogram. This configuration signals bullish momentum and suggests increasing strength in the upward price trend.
● The RSI indicator has recently breached the 70 threshold, entering overbought territory. This development serves as a cautionary signal, suggesting the possibility of an impending short-term price correction or consolidation phase.
● The trend-based Fibonacci Extension tool has identified a potential resistance level at approximately $299. Concurrently, the tool indicates two key support levels: a primary support zone around $286, followed by a secondary, more robust support level near $277.
In summary, TSLA exhibits a bullish bias in the short term, maintaining a neutral stance in its longer-term trajectory. The presence of a bull flag pattern on the daily chart, corroborated by some technical indicators, suggests that TSLA might have attained its immediate price objective. Consequently, market participants would be prepared for a potential short-term price correction or a period of consolidation.
This presentation discusses technical analysis, other approaches, including fundamental analysis, may offer very different views. The examples provided are for illustrative purposes only and are not intended to be reflective of the results you can expect to achieve.
All investment involves risk, including the potential loss of principal, and there can be no guarantee that any investment strategy will be successful.
This presentation is for informational and educational use only and is not a recommendation or endorsement of any particular investment or investment strategy. Investment information provided in this content is general in nature, strictly for illustrative purposes, and may not be appropriate for all investors. Read more