Microsoft's V-Top pattern: What investors need to know? (07/31/2024)

Hello, everyone! This week, we will be focusing on Microsoft Corporation (NASDAQ: $Microsoft(MSFT.US)$), the world’s most valuable company and a pioneer in artificial intelligence (AI). In this article, we’ll explore the latest trends and take a close look at the company’s recent market activity.
What's new?
On July 31, 2024, Microsoft’s shares closed down 1.08% following the release of its fiscal fourth-quarter earnings report. Despite beating expectations on both revenue and earnings per share (EPS), the company missed cloud revenue expectations. As a result, Microsoft significantly underperformed the tech-heavy Nasdaq Composite, which gained 2.64% on the same day.
For the quarter, Microsoft reported EPS of $2.95 on revenue of $64.7 billion, showing an increase of 9.67% and 15.20% compared to the same period last year, respectively. According to Bloomberg, Wall Street was expecting EPS of $2.94 on revenue of $64.5 billion.
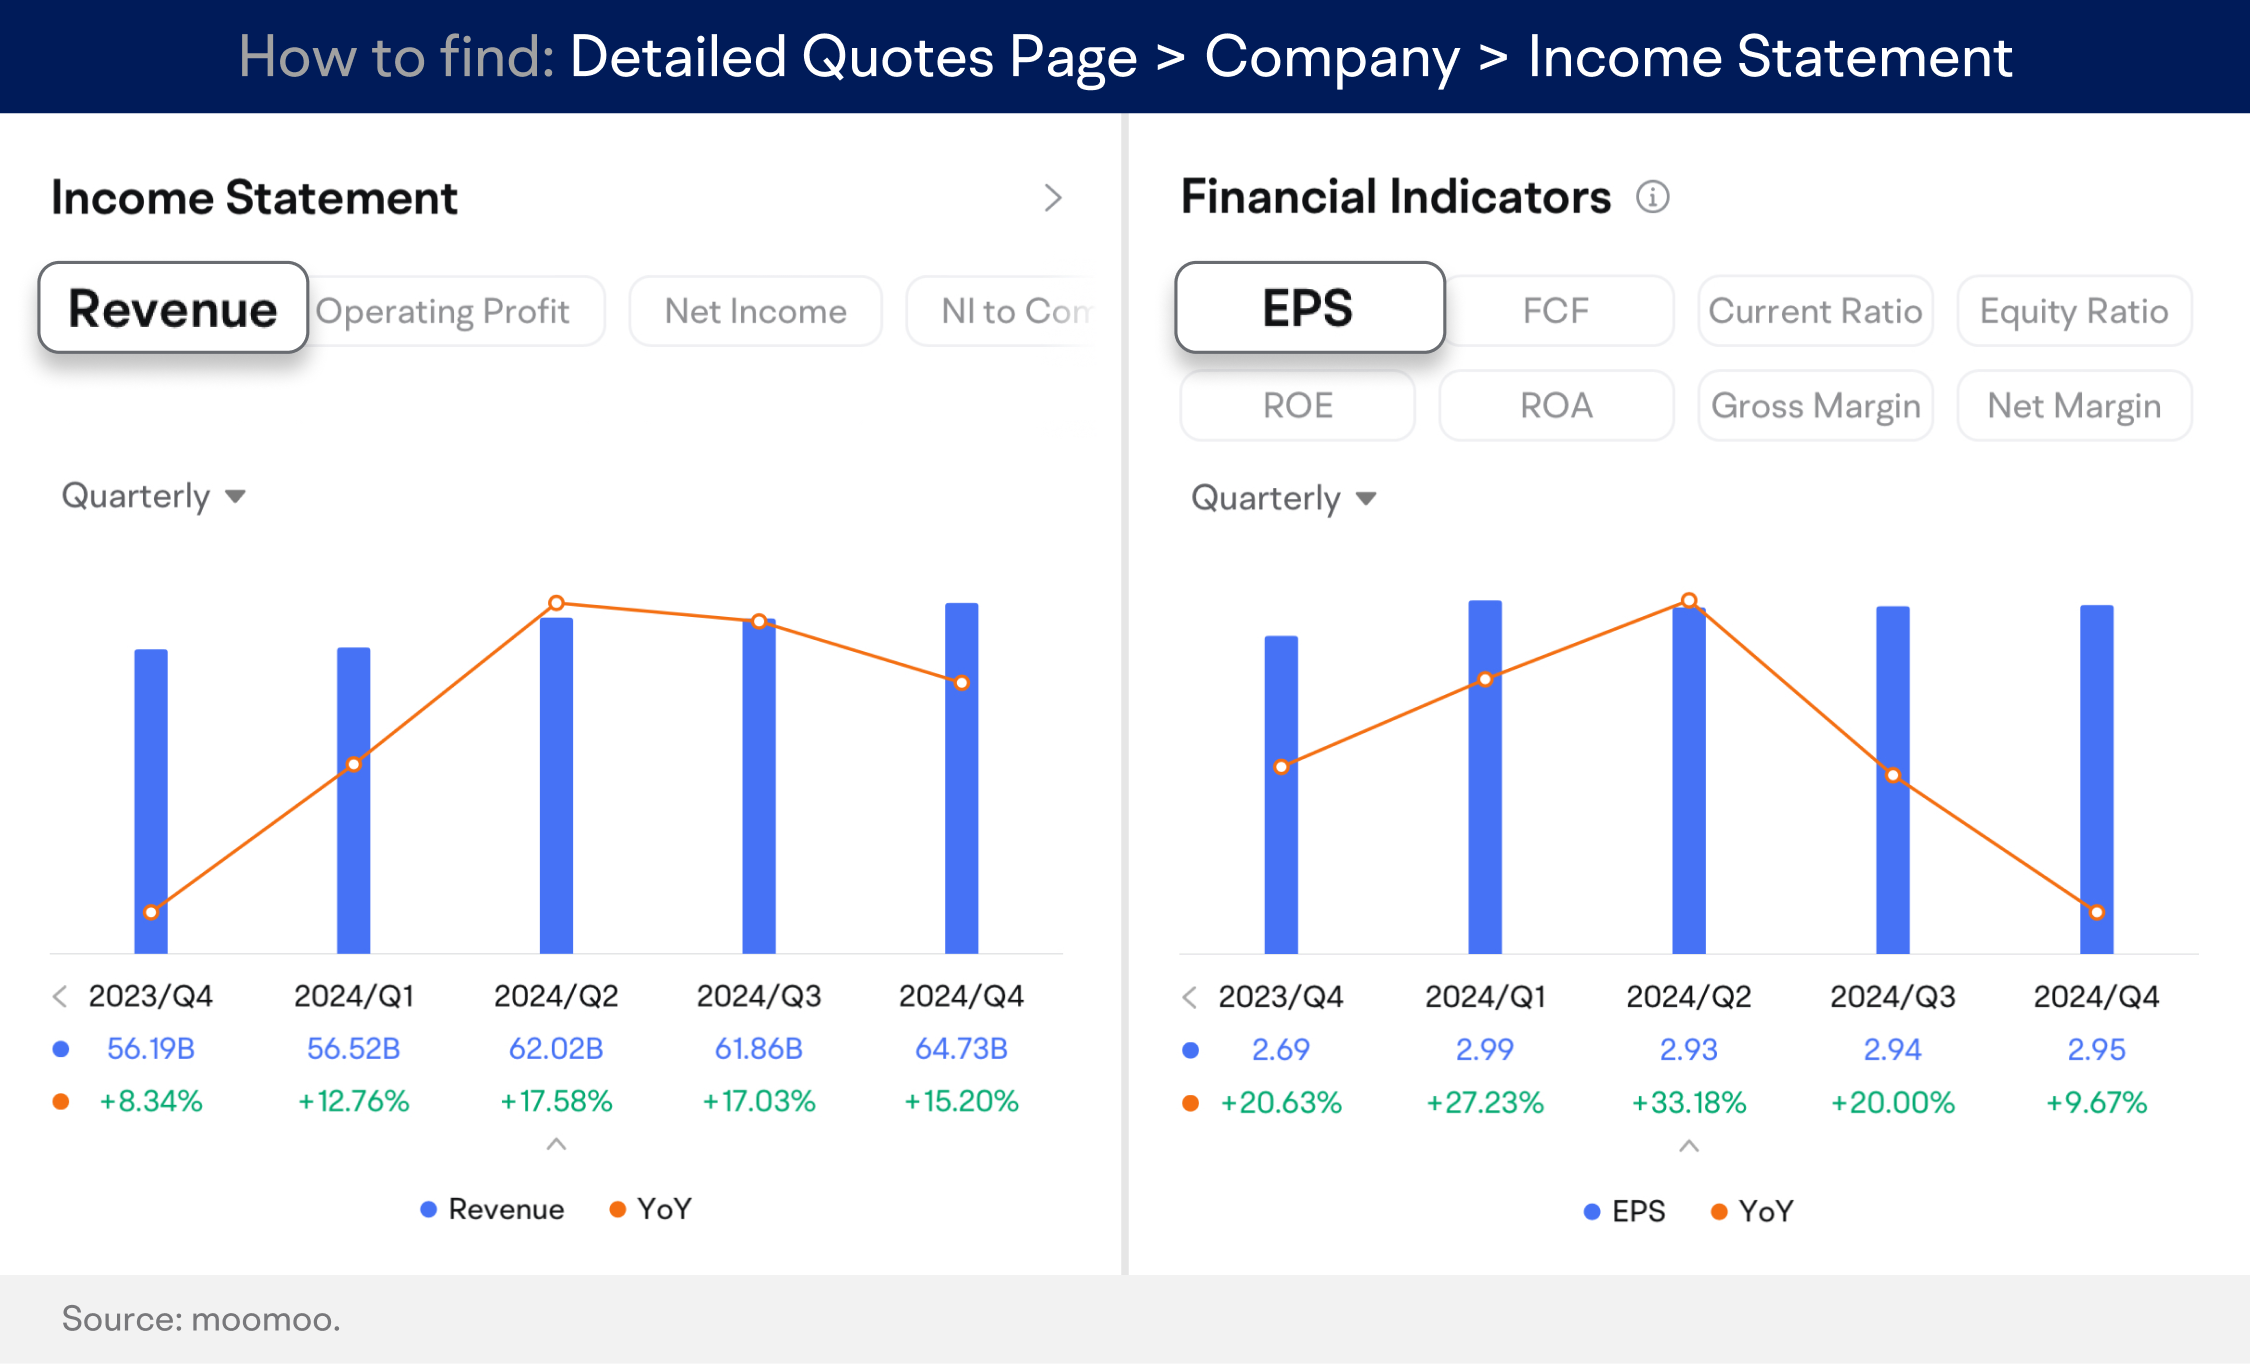
The company’s top segment, which includes its Azure services, generated $28.5 billion in revenue, up approximately 19%, but fell short of expectations of $28.7 billion. Revenue from Azure and other cloud services grew 29%, falling short of the expected 31% growth. This was the first time since 2022 that Microsoft’s Azure number had fallen short of consensus.
During the quarter, the company’s capital expenditures were $19 billion, with almost all of it being spent on cloud and AI-related projects. Wall Street is optimistic that this continued investment in AI will drive growth not just for Microsoft but also for chip makers and other players in the AI industry.
Looking ahead, Microsoft’s guidance called for fiscal first-quarter revenue between $63.8 billion and $64.8 billion, indicating 13.8% growth rate at the midpoint of the range.
Chart of the day
Trend analysis:
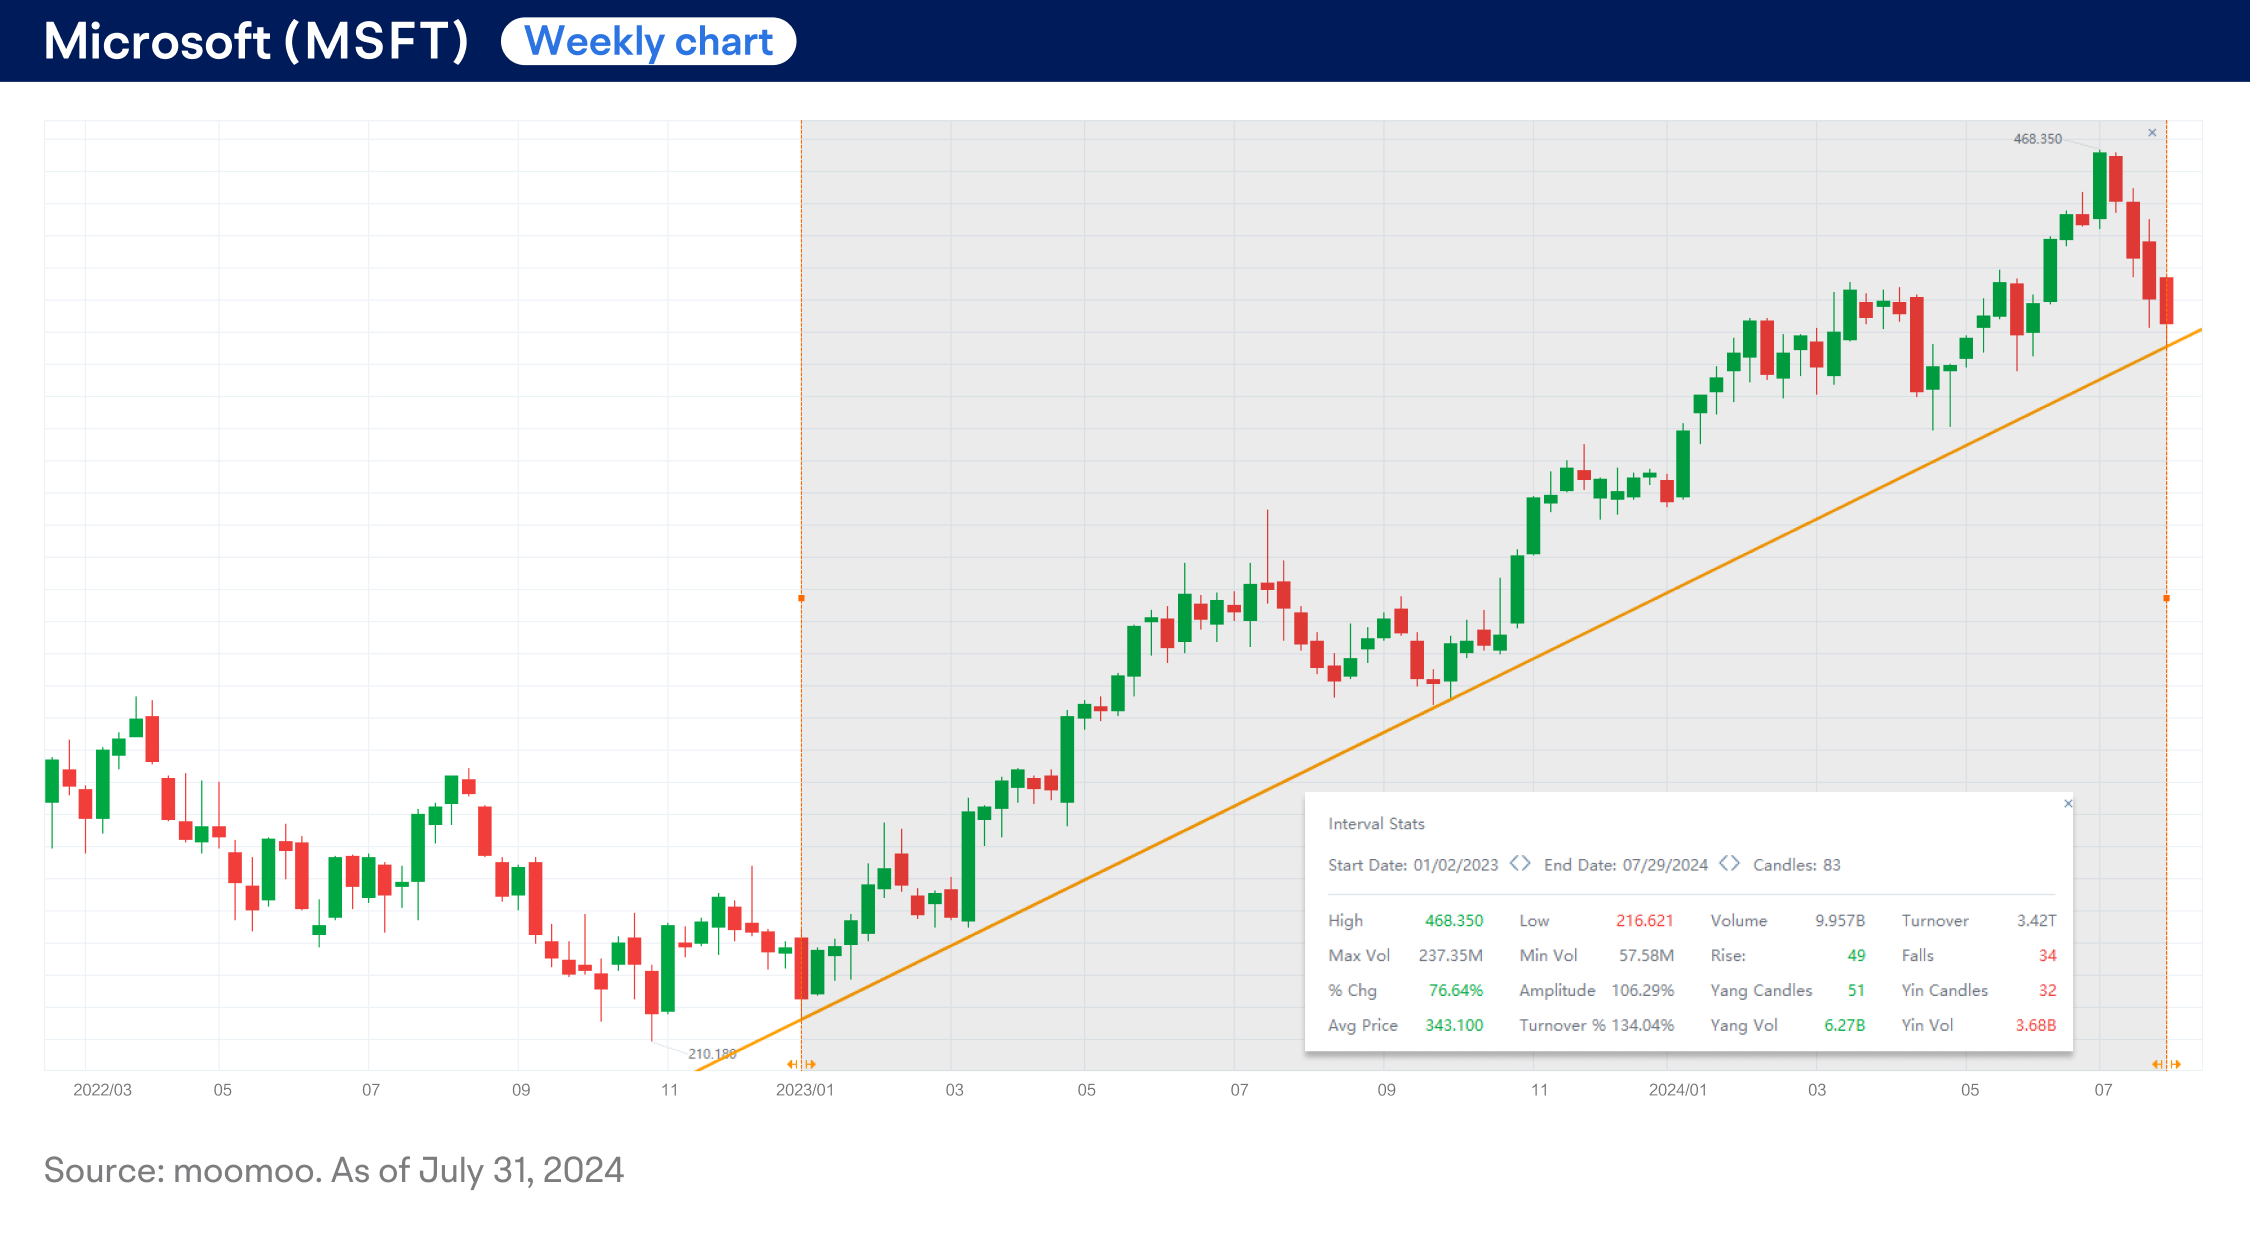
Microsoft's shares ($Microsoft(MSFT.US)$) have been on a steady uptrend since early 2023, with the price gaining 76% as of July 31, 2024, as shown in the weekly chart above.
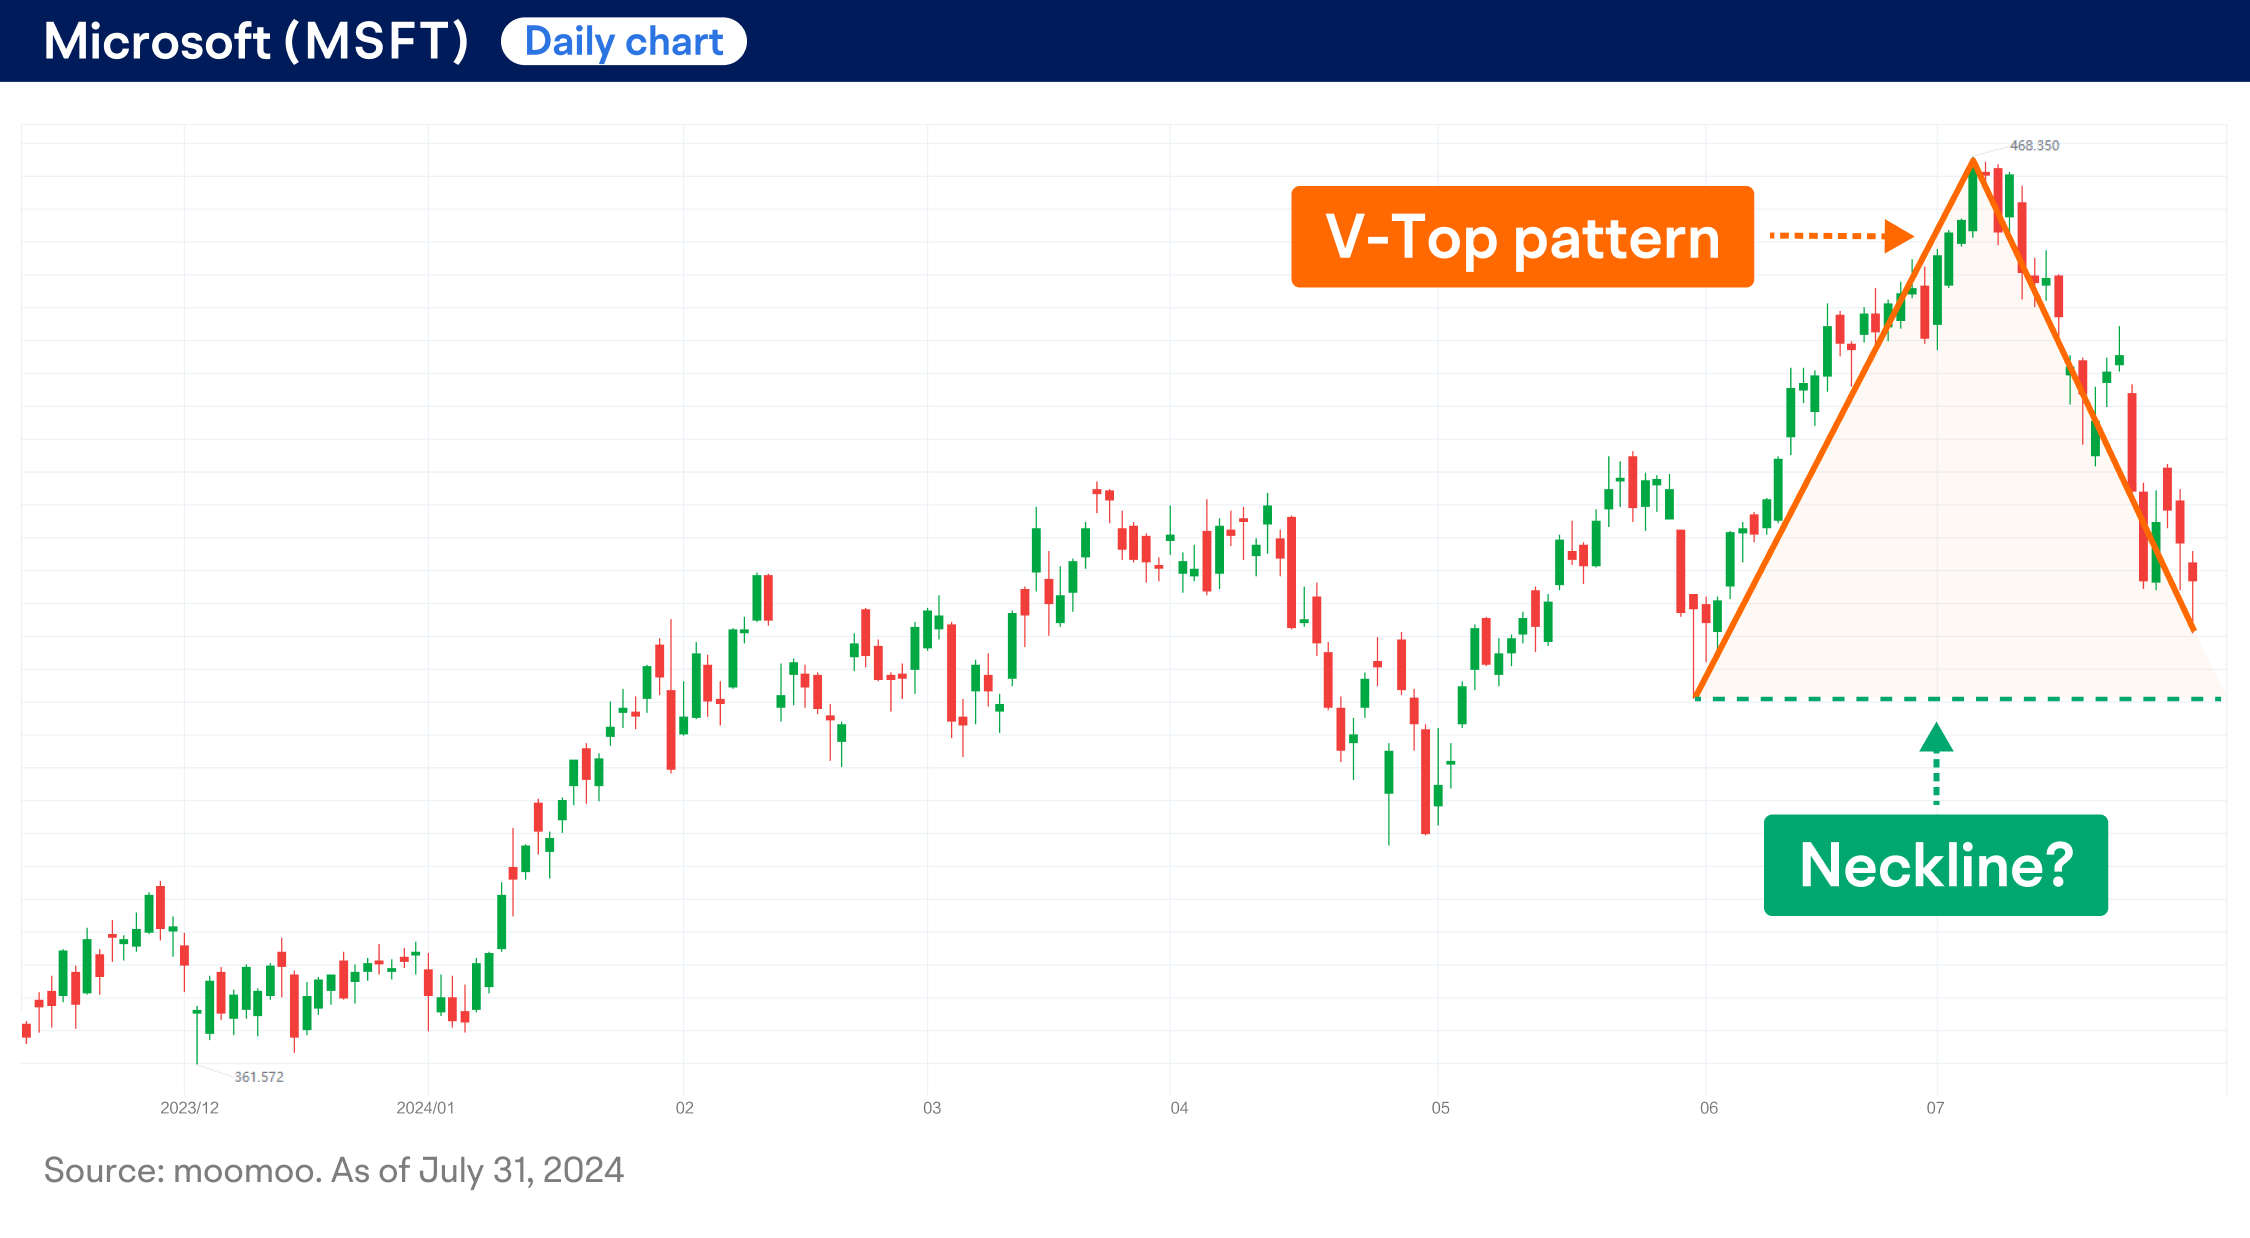
However, the daily chart above shows that the stock is currently forming an inverted V-shaped pattern, or V-Top. This could indicate a potential market shift, but it might also be part of a larger pattern. It can easily be mistaken for other formations like Double Tops, making it challenging to pinpoint a clear breakout point.
Technical indicators:
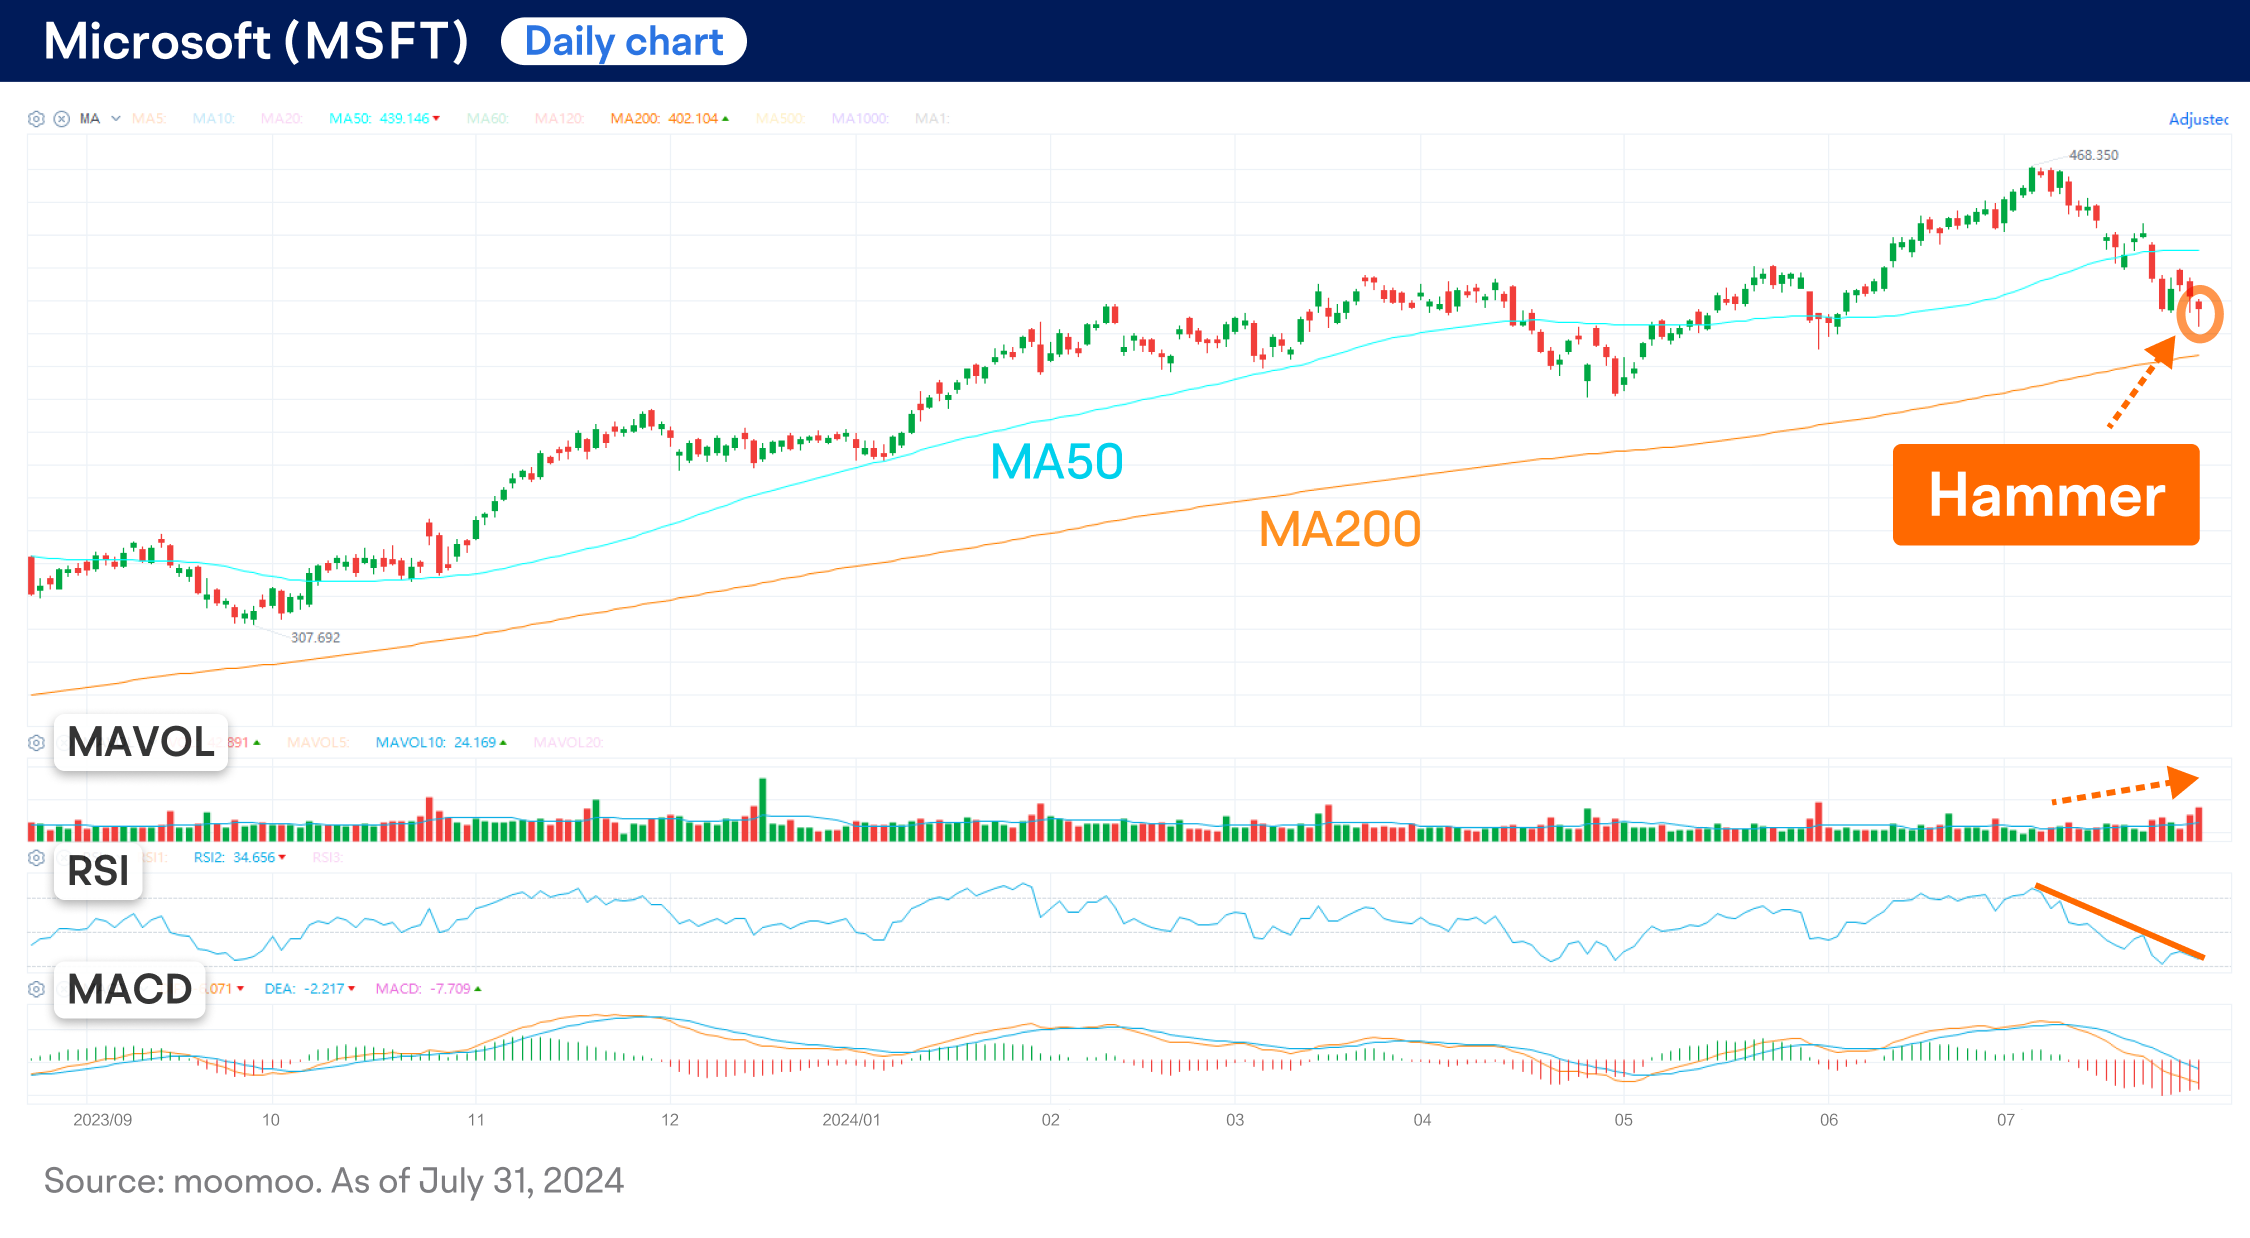
● MSFT is trading below the 50-day moving average (MA50) but above the 200-day moving average (MA200), suggesting recent price corrections.
● The trading volume has increased in recent days, coinciding with the decline in prices.
● The relative strength index (RSI) and the moving average convergence/divergence (MACD) oscillator have both been decreasing since $Microsoft(MSFT.US)$ reached its peak on July 5, which is consistent with the ongoing bearish price trend.
● A hammer candlestick pattern emerged on July 31, suggesting an increase in buying interest and a potential price reversal in the short term.
Next move?
$Microsoft(MSFT.US)$ is currently retracing from its record high since July 5, but its long-term trend remains intact.
While the stock might have short-term upside potential, traders should also watch for potential support around the MA200 and the neckline of the inverted V-shape, which is above $400.
This presentation discusses technical analysis, other approaches, including fundamental analysis, may offer very different views. The examples provided are for illustrative purposes only and are not intended to be reflective of the results you can expect to achieve.
All investing involves risk, including the potential loss of principal, and there can be no guarantee that any investing strategy will be successful.
This presentation is for informational and educational use only and is not a recommendation or endorsement of any particular investment or investment strategy. Investment information provided in this content is general in nature, strictly for illustrative purposes, and may not be appropriate for all investors. Read more