Head and shoulders alert: What's next for AMZN? (10/08/2024)
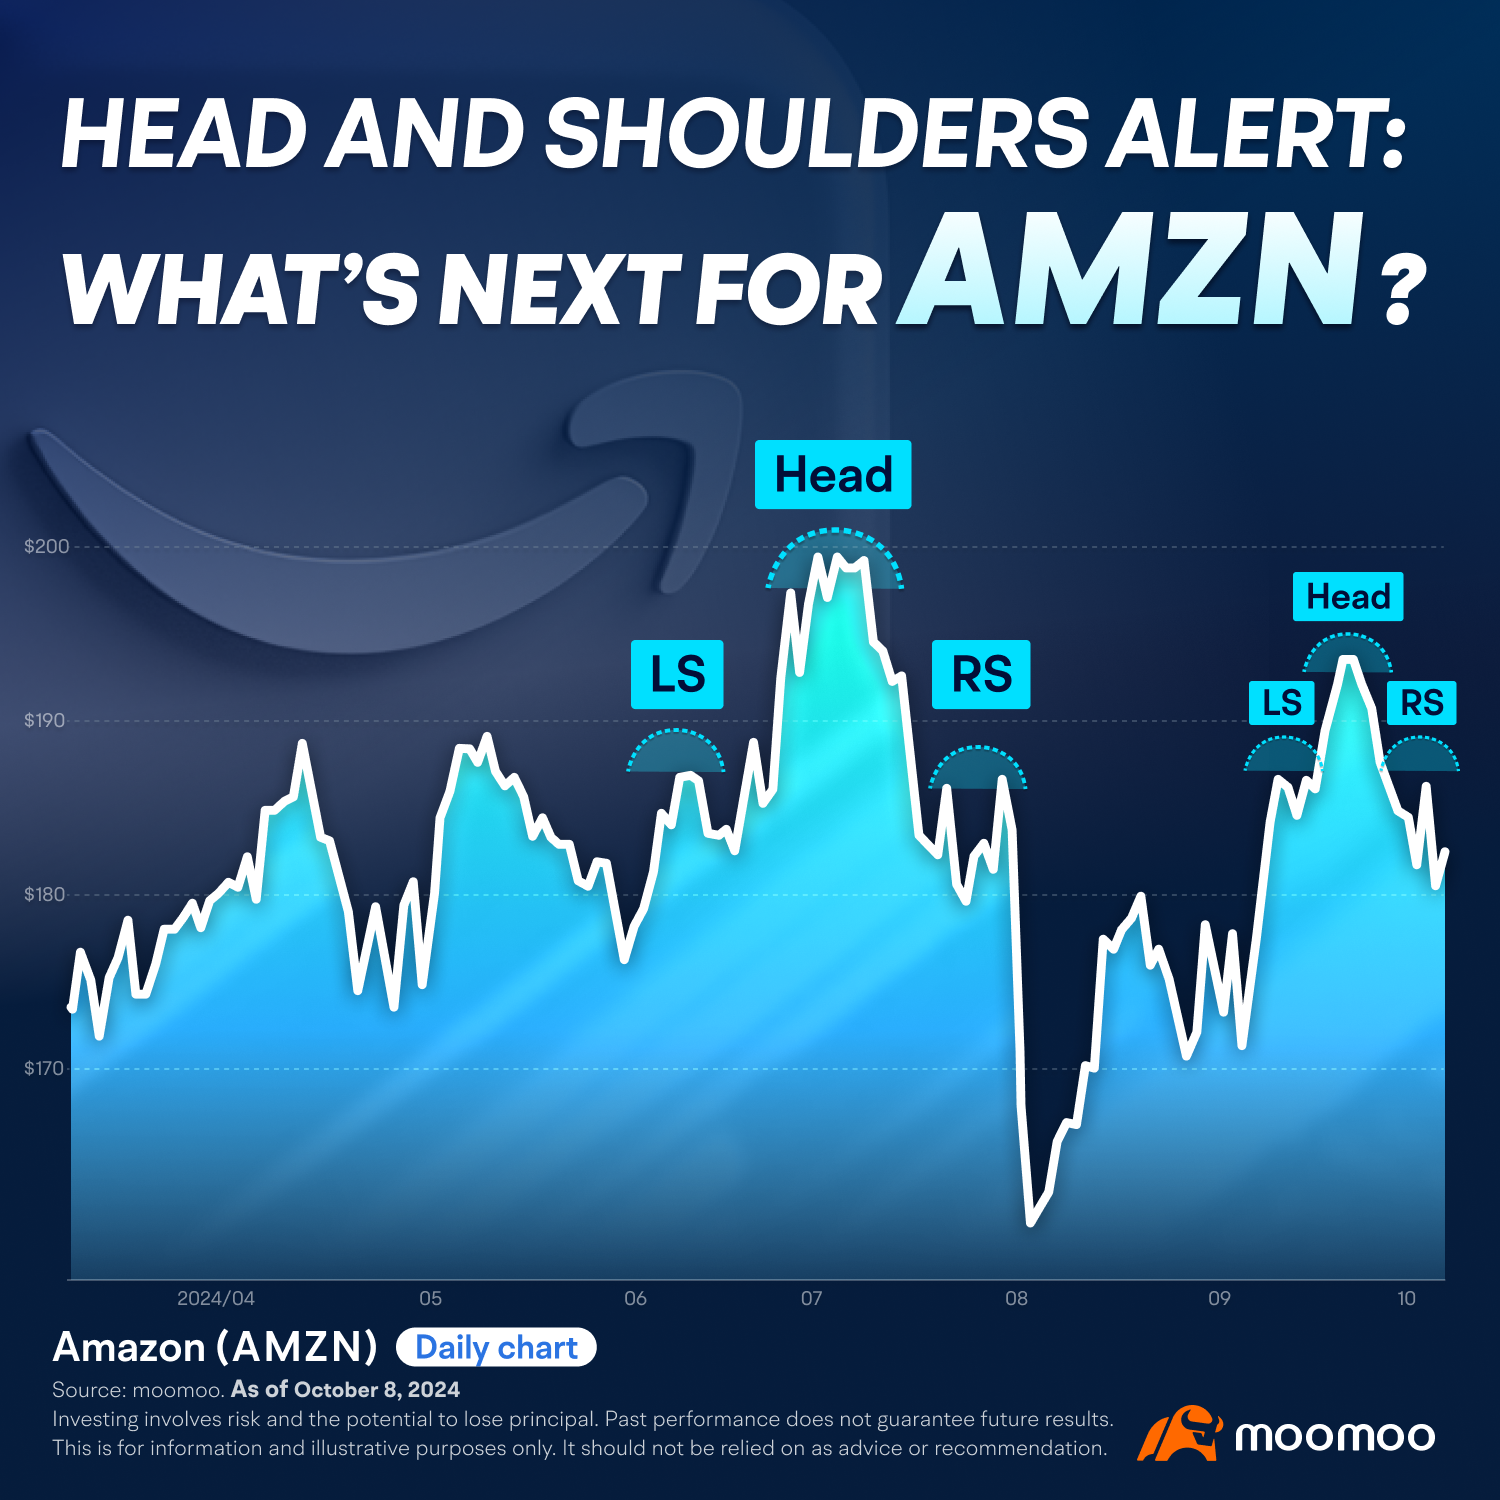
Hello, everyone! This week, we will focus on $Amazon (AMZN.US)$, a key player among the so-called Magnificent Seven tech stocks that have experienced massive gains over the past year. However, the e-commerce giant's stock was recently hit with a rare analyst downgrade. In this article, we'll explore the latest trends and examine the company's recent market activity.
What's new?
On October 7, 2024, Amazon's stock closed down by 3% following a downgrade from Wells Fargo analysts, who shifted their rating from Overweight to Equal Weight and lowered their price target from $225 to $183.
Wells Fargo analyst Ken Gawrelski noted that AMZN has been a consistent positive revision story, but they believe factors pressure revisions in the near term. Key challenges confronting Amazon include intensifying competition from Walmart, a waning contribution from its advertising business to operating income, and elevated costs associated with its satellite broadband project.
Gawrelski stands out as one of just five Wall Street analysts who do not recommend buying Amazon's stock, according to Bloomberg data. In contrast, the broader consensus among analysts suggests that the e-commerce giant's stock is poised to increase by over 20%, reaching approximately $220 over the next year, as per Bloomberg's estimates.
Amazon's most recent earnings report in early August fell short of Wall Street’s expectations. However, the robust performance of its cloud services division, Amazon Web Services (AWS), has helped compensate for weaker-than-expected growth in retail sales. AWS, which encompasses Amazon's AI services, generated $26.3 billion in revenue during the second quarter—surpassing analysts' forecasts and reflecting a 19% increase compared to the year before.
Looking ahead, Amazon anticipates AI to bring in billions of dollars in revenue over the coming years. Nevertheless, Wells Fargo believes that advancements in the AI sector may not be sufficient to offset downsides from Amazon's other businesses, potentially limiting its overall profit growth.
Chart of the day
Trend analysis:
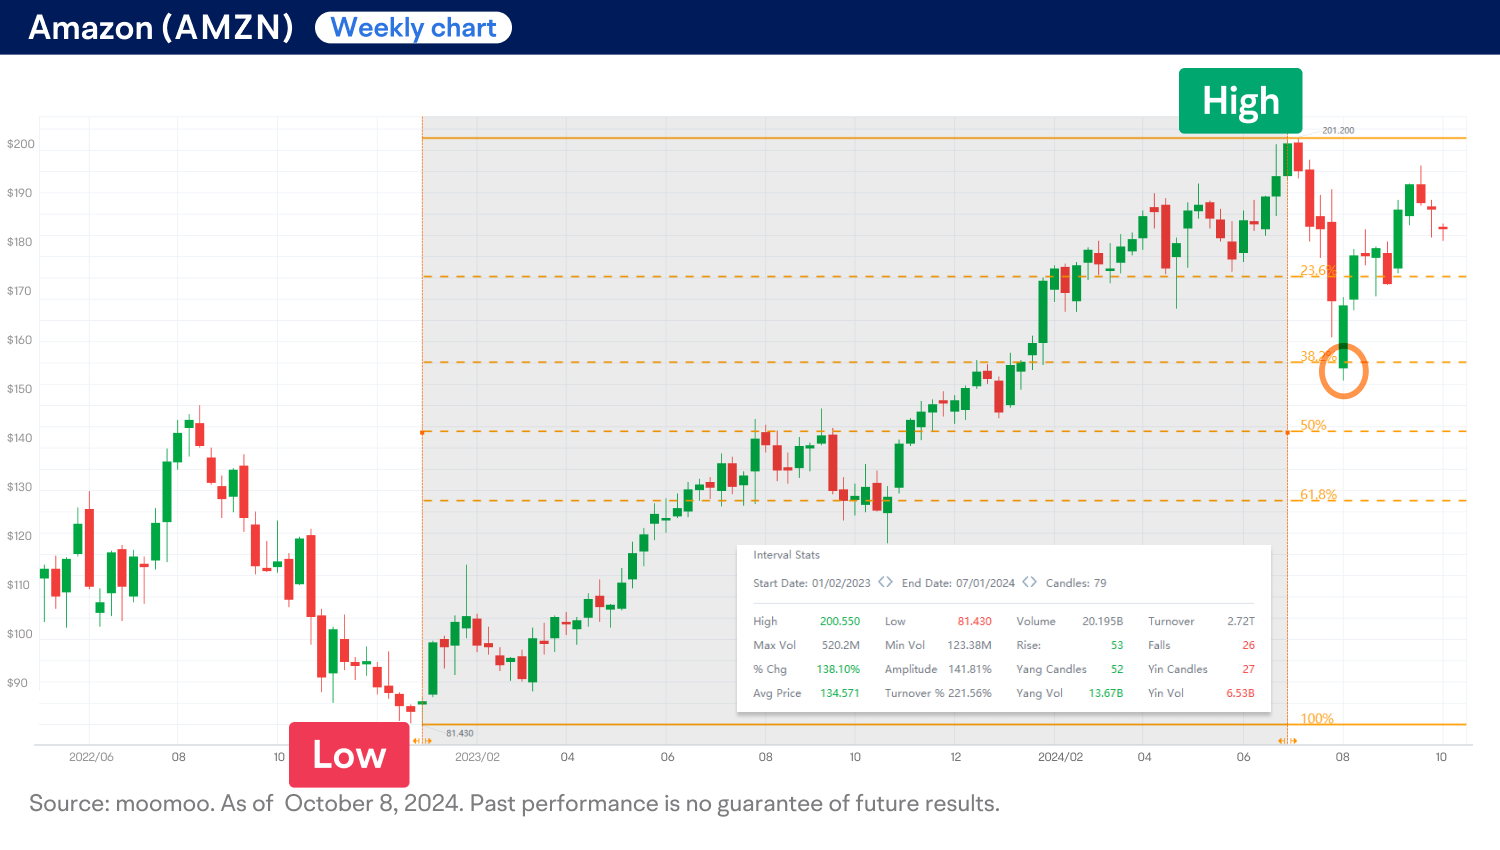
Amazon's shares (AMZN) have exhibited an upward trajectory since early 2023, increasing by as much as 138% over the past year and a half. Following a peak of $201, the stock has retraced approximately 38.2% of its previous gains, as highlighted by the Fibonacci retracement tool on the weekly chart.
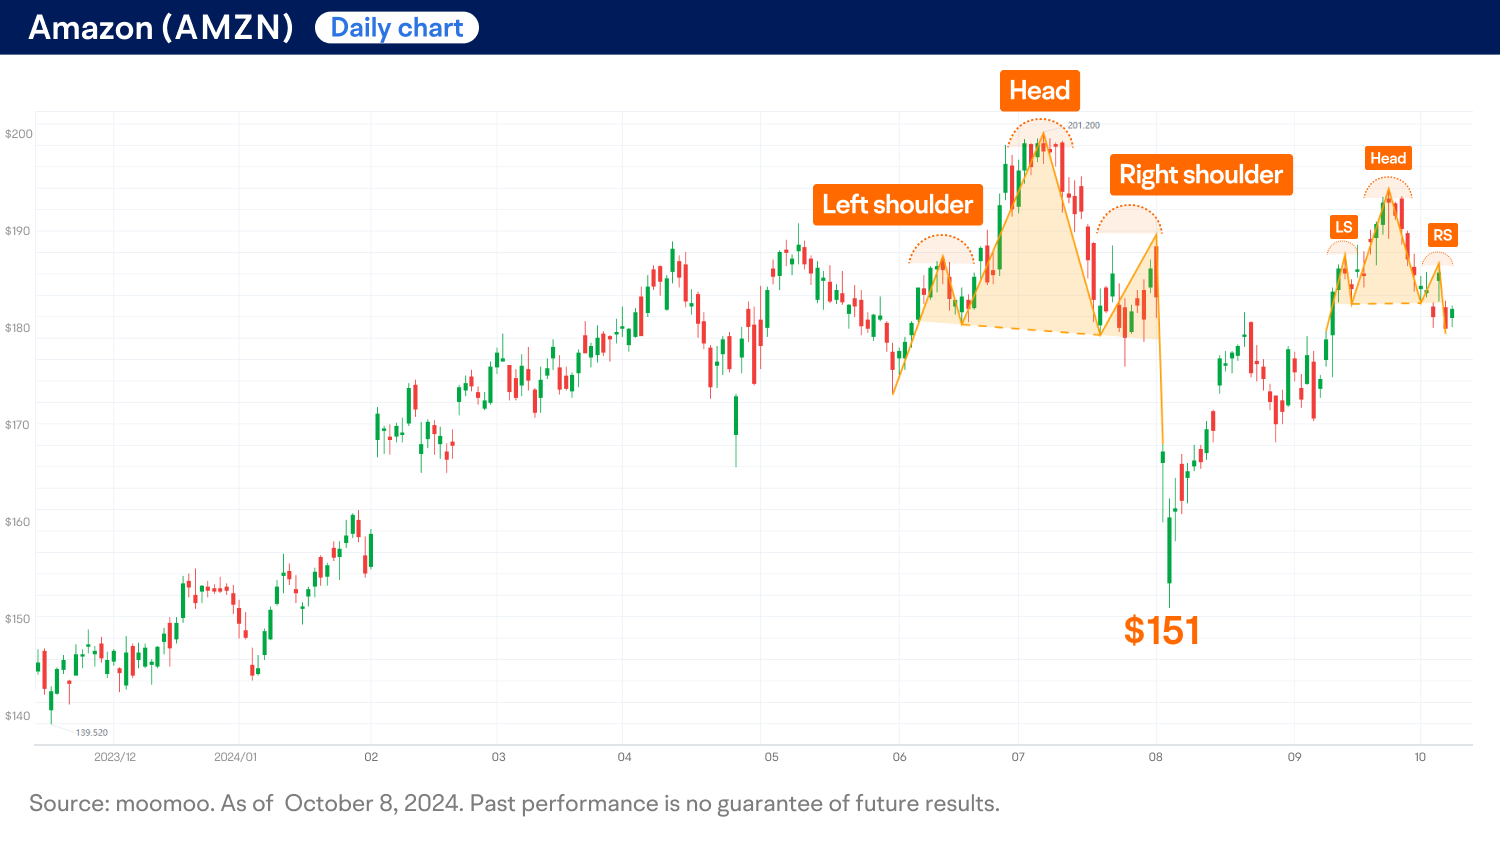
On the daily chart, AMZN appears to be reclaiming its upward momentum, with the price up more than 20% from a low of $151 on August 5, 2024. However, it's important to highlight the formation of two head and shoulders patterns near recent peaks, which may signal a potential downturn in the stock's performance.
Technical indicators:
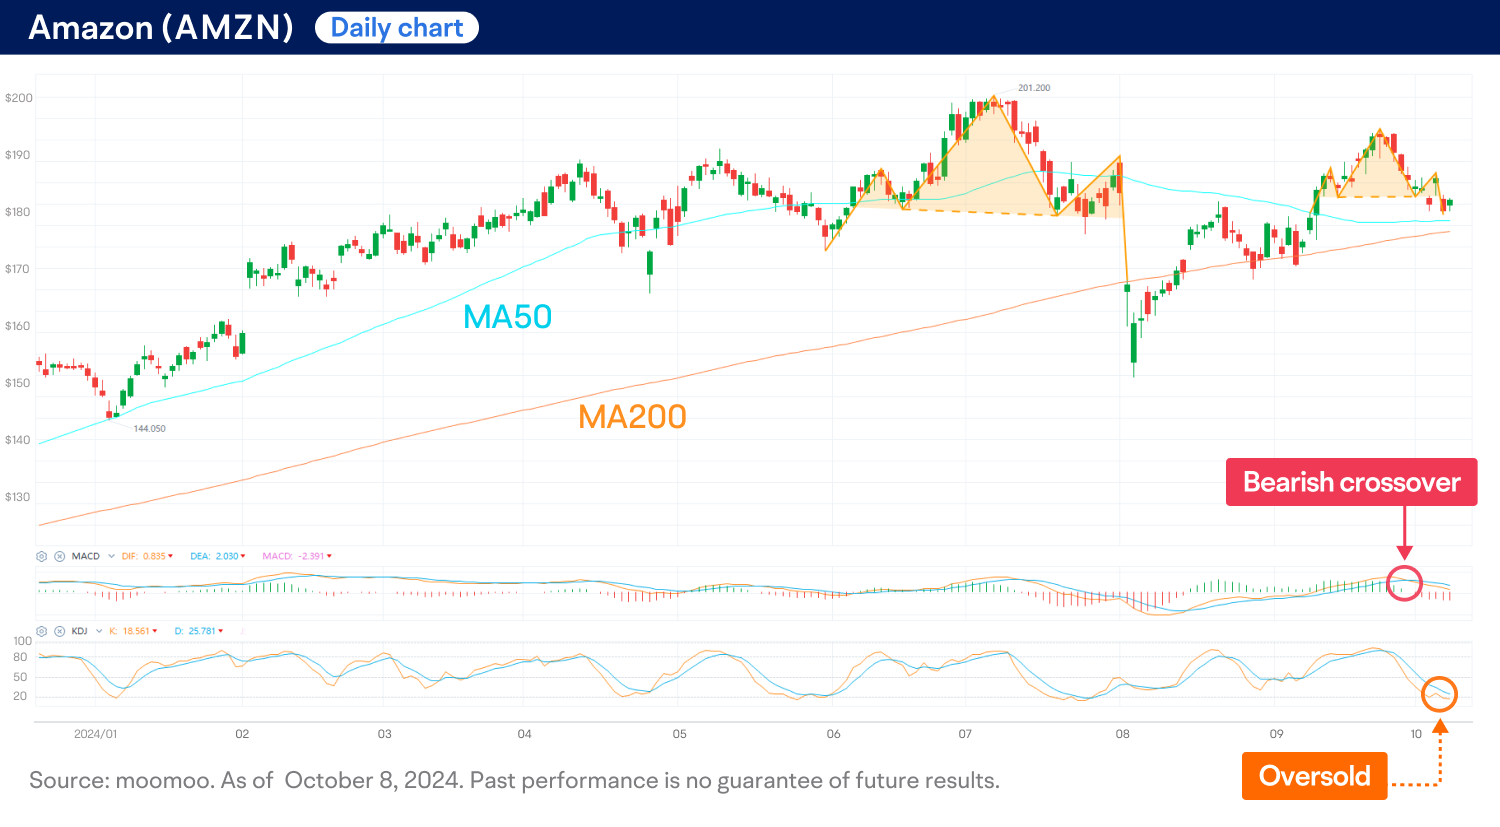
● AMZN is demonstrating a bullish trend, currently trading above the crucial 50-day and 200-day moving averages (MAs), despite recent price volatility.
● The moving average convergence/divergence (MACD) oscillator has been aligned with the price action and has recently indicated a bearish crossover, suggesting a potential downward trend.
● The KDJ indicator has entered oversold territory, with the K line dropping below 20. This may signal a possible short-term price rebound.
In summary, AMZN's long-term bullish trend remains intact. While the stock has experienced a decline in recent days, marked by the emergence of a mini head and shoulders pattern, traders might keep a close eye on potential signals indicating a short-term price rebound.
This presentation discusses technical analysis, other approaches, including fundamental analysis, may offer very different views. The examples provided are for illustrative purposes only and are not intended to be reflective of the results you can expect to achieve.
All investing involves risk, including the potential loss of principal, and there can be no guarantee that any investing strategy will be successful.
This presentation is for informational and educational use only and is not a recommendation or endorsement of any particular investment or investment strategy. Investment information provided in this content is general in nature, strictly for illustrative purposes, and may not be appropriate for all investors. Read more