Apple stock gets pain. What to expect next? (02/27/2024)
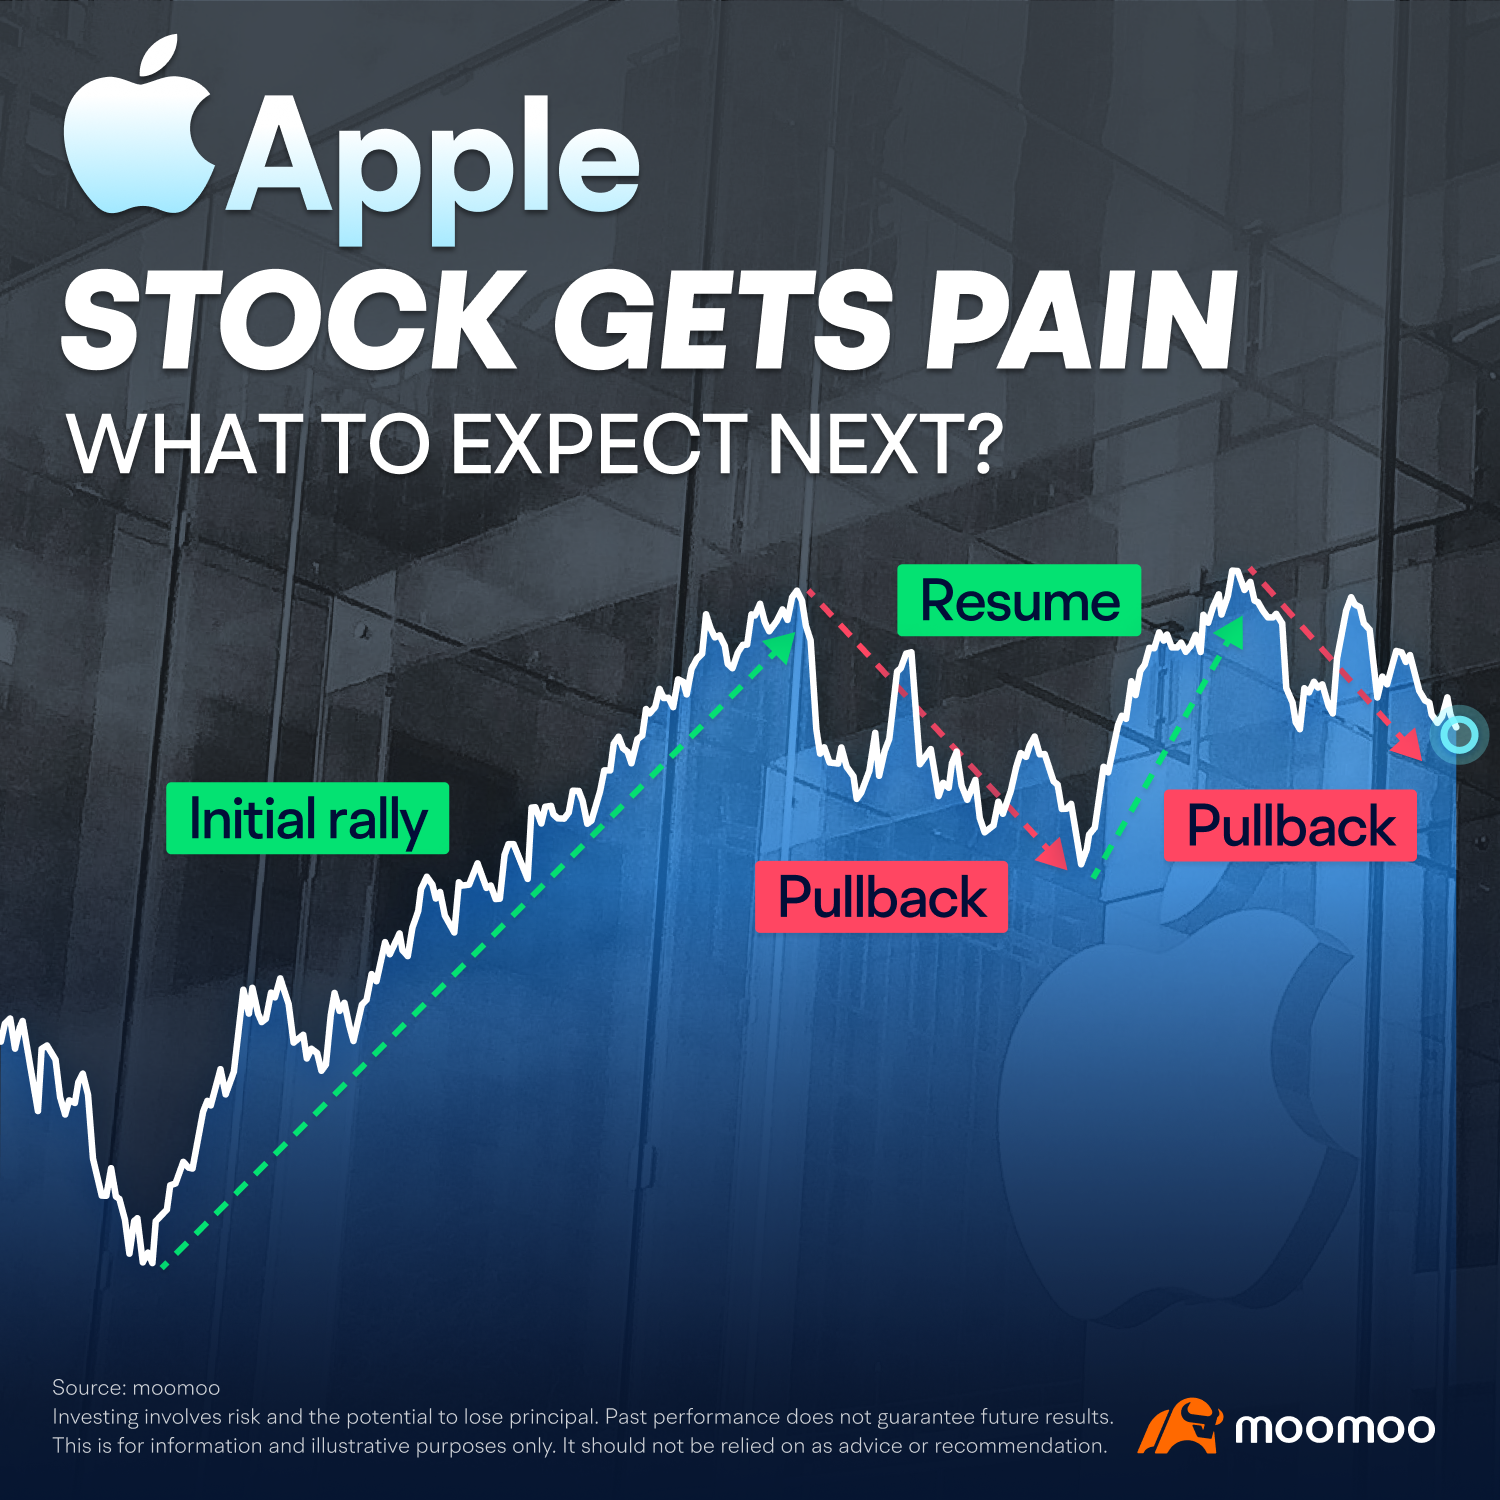
Hey everyone! Welcome to this week’s edition of “Technical Tracking,” where we’ll dive into the latest trends and analysis for Apple, Inc. $Apple(AAPL.US)$
What’s new?
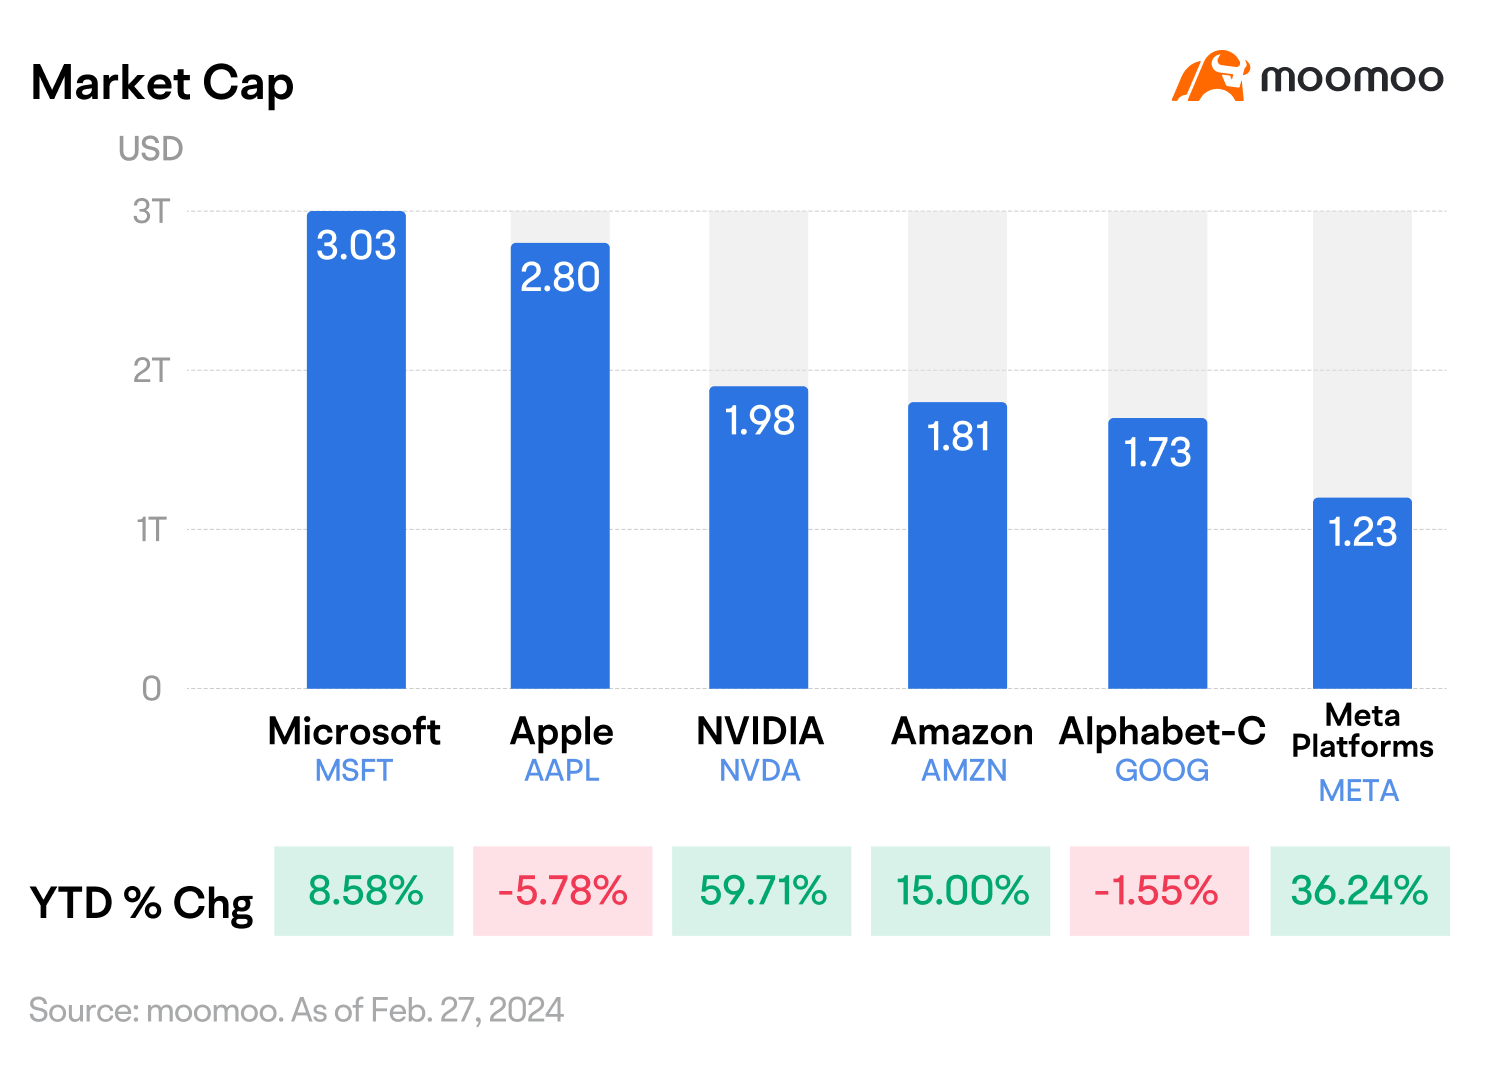
Apple Inc. has had a rough start to 2024, ceding its title as the world’s most valuable company to Microsoft Corp.
Despite a broader market rally that pushed the Dow and S&P 500 to new highs, Apple’s stock has dipped by 6% as of February 27, 2024.
Apple’s performance has lagged behind those valued at more than $1 trillion. Notably, its market cap dropped below $3 trillion.
In the past year, many technology companies such as Microsoft and Nvidia have benefited from the AI craze. However, “Apple hasn't publicly talked about its AI efforts in detail, and concerns have been around the company... lagging other tech giants in the race,” according to Citi analyst Atif Malik.
Compounding Apple’s challenges, sales in China – a critical market for the tech behemoth – are slipping. The declining demand for iPhones suggests that local competitors are making significant inroads, intensifying the headwinds Apple faces in the region.
Chart of the day
Apple is going into a consolidation phase, and technical signals are relatively weak.
Trend analysis:
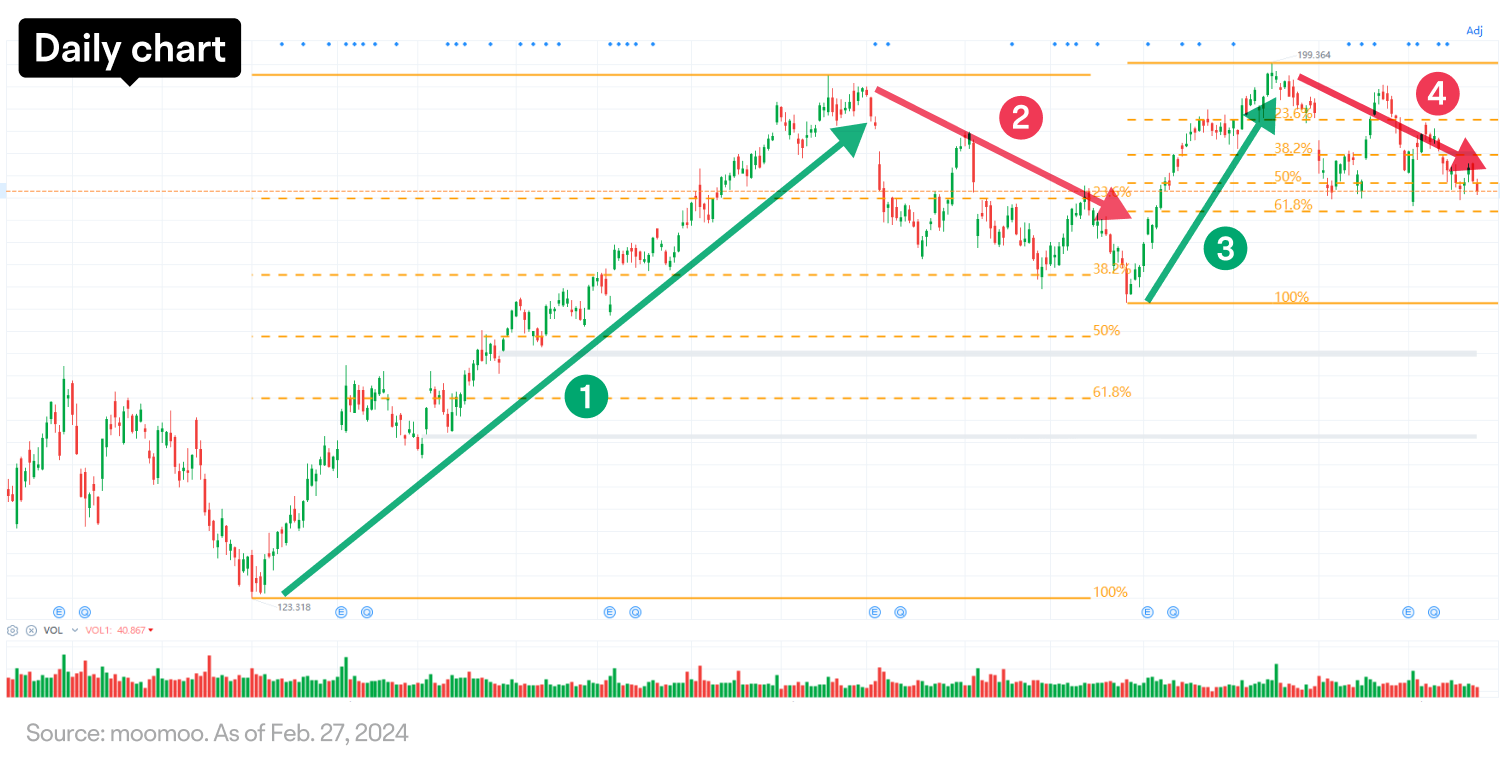
1. Apple began a strong uptrend in early 2023, with the stock price surging by 50% in the first seven months.
2. The price then experienced a pullback, but it did not exceed 50% of the gain, which is considered a normal price correction.
3. The upward trend resumed in late October, with the stock hitting record highs. This upward movement was relatively short-lived compared to the first rally, with the price increasing by only an additional 1% from the previous high.
4. Again, the price pulled back nearly 61.8%, which is considered a much deeper price correction and suggests that the uptrend holds. It is worth noting that many traders believe if the price retraces more than 61.8% of its prior gain, they’re more likely to see a potential price reversal.
Technical indicators:
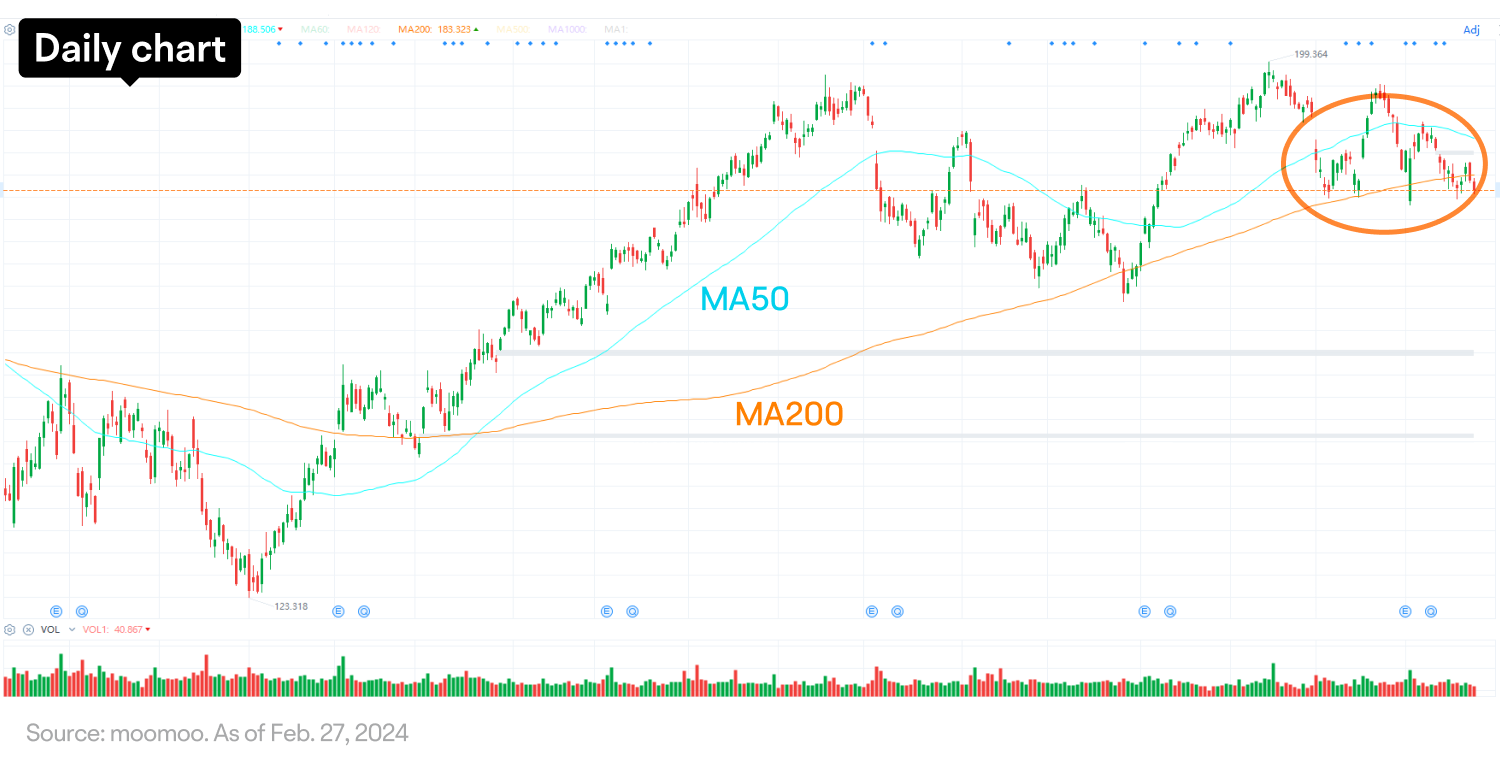
Apple closed below the 50-day moving average (MA50) for nearly 20 consecutive trading days, a weak performance in the short term. The 200-day moving average (MA200), a barometer for bull/bear in the longer term, has also broken before the price went up slightly.
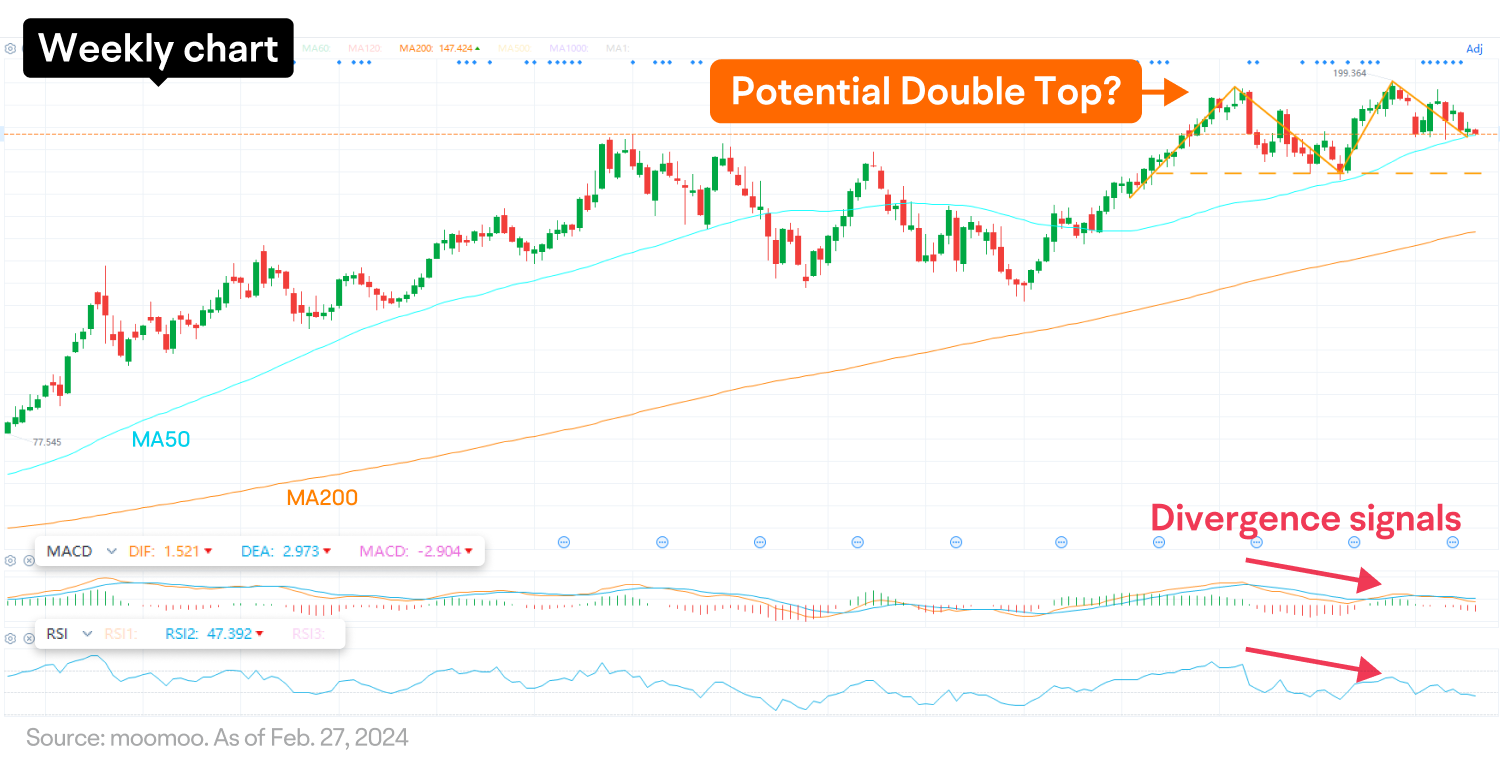
On the weekly chart, there’s a potential Double Top formation with a critical support level at the neckline around $167. Bearish divergence on both the MACD and RSI indicators further signals fading momentum.
Next move?
The stock is currently oscillating between two channel lines, and an uptrend line that connects the low in early 2023 can still be valid.
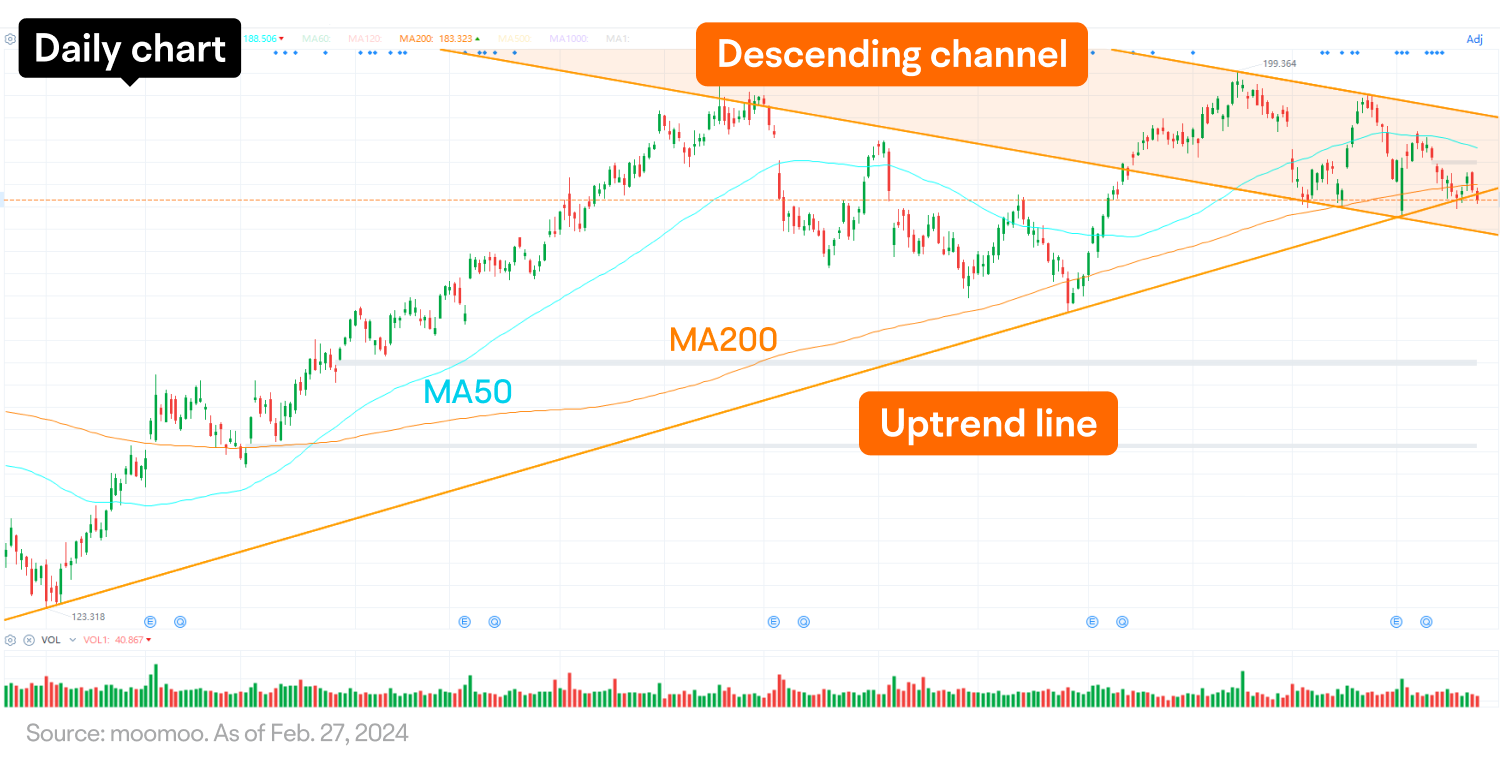
Bulls may anticipate the stock finding support at the lower channel line and the uptrend line. Conversely, bears could be anticipating a possible breach of these technical levels.
This presentation discusses technical analysis, other approaches, including fundamental analysis, may offer very different views. The examples provided are for illustrative purposes only and are not intended to be reflective of the results you can expect to achieve.
All investing involves risk, including the potential loss of principal, and there can be no guarantee that any investing strategy will be successful.
This presentation is for informational and educational use only and is not a recommendation or endorsement of any particular investment or investment strategy. Investment information provided in this content is general in nature, strictly for illustrative purposes, and may not be appropriate for all investors. Read more