Berkshire's cash pile is nearing $200bn. What will Buffett do? (05/29/2024)
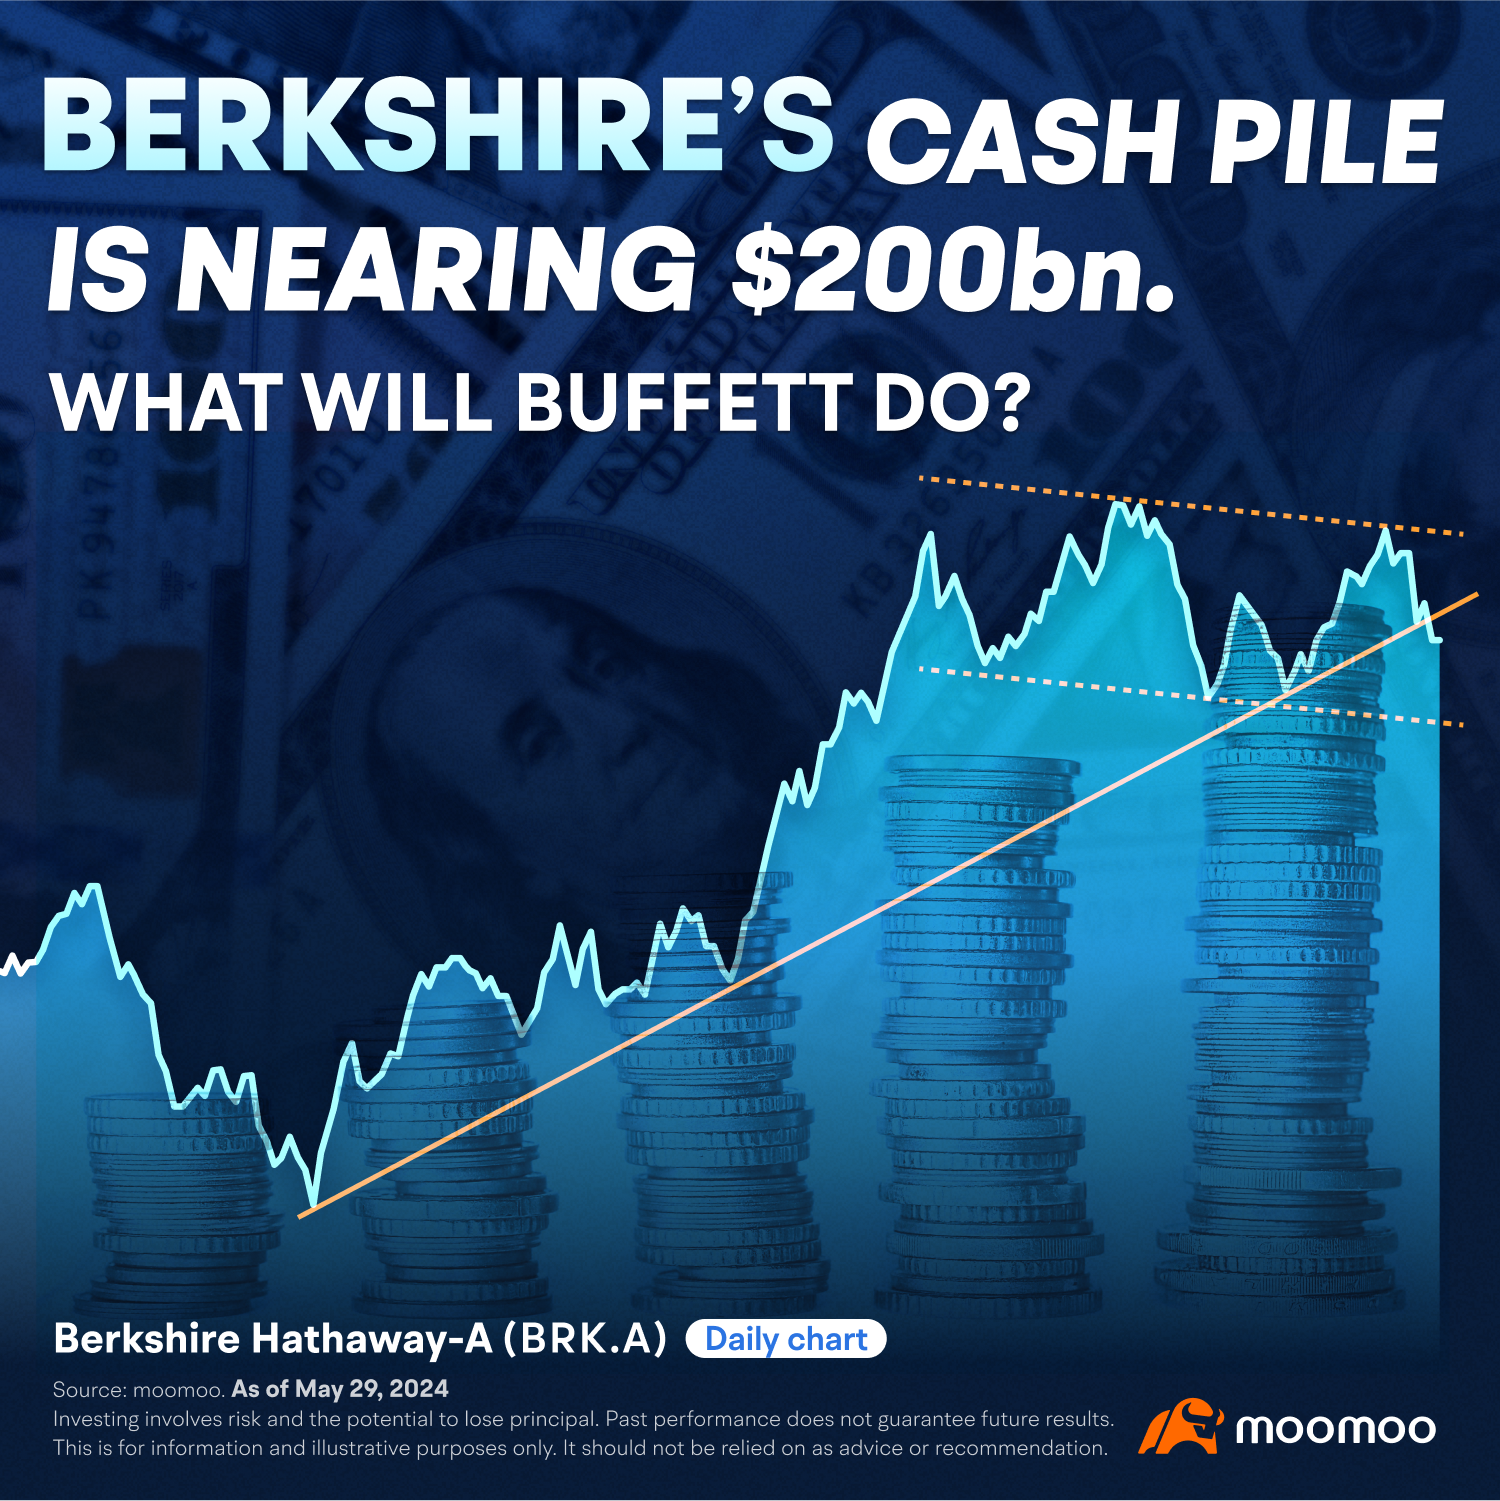
Hello, everyone! In this week’s spotlight, we will be discussing Berkshire Hathaway Inc. $Berkshire Hathaway-A(BRK.A.US)$, the conglomerate holding company led by the renowned billionaire investor, Warren Buffett. We’ll explore the latest trends and take a close look at the company’s recent market activity.
What’s new?
Berkshire Hathaway’s cash reserves are at an all-time high and growing, indicating the difficulty of finding valuable investments that have traditionally defined the billionaire Warren Buffett’s conglomerate, as per the company’s latest quarterly report.
As of March, cash, cash equivalents, and short-term Treasury holdings at Buffett’s group totaled $189 billion, up 13% from the end of 2023.
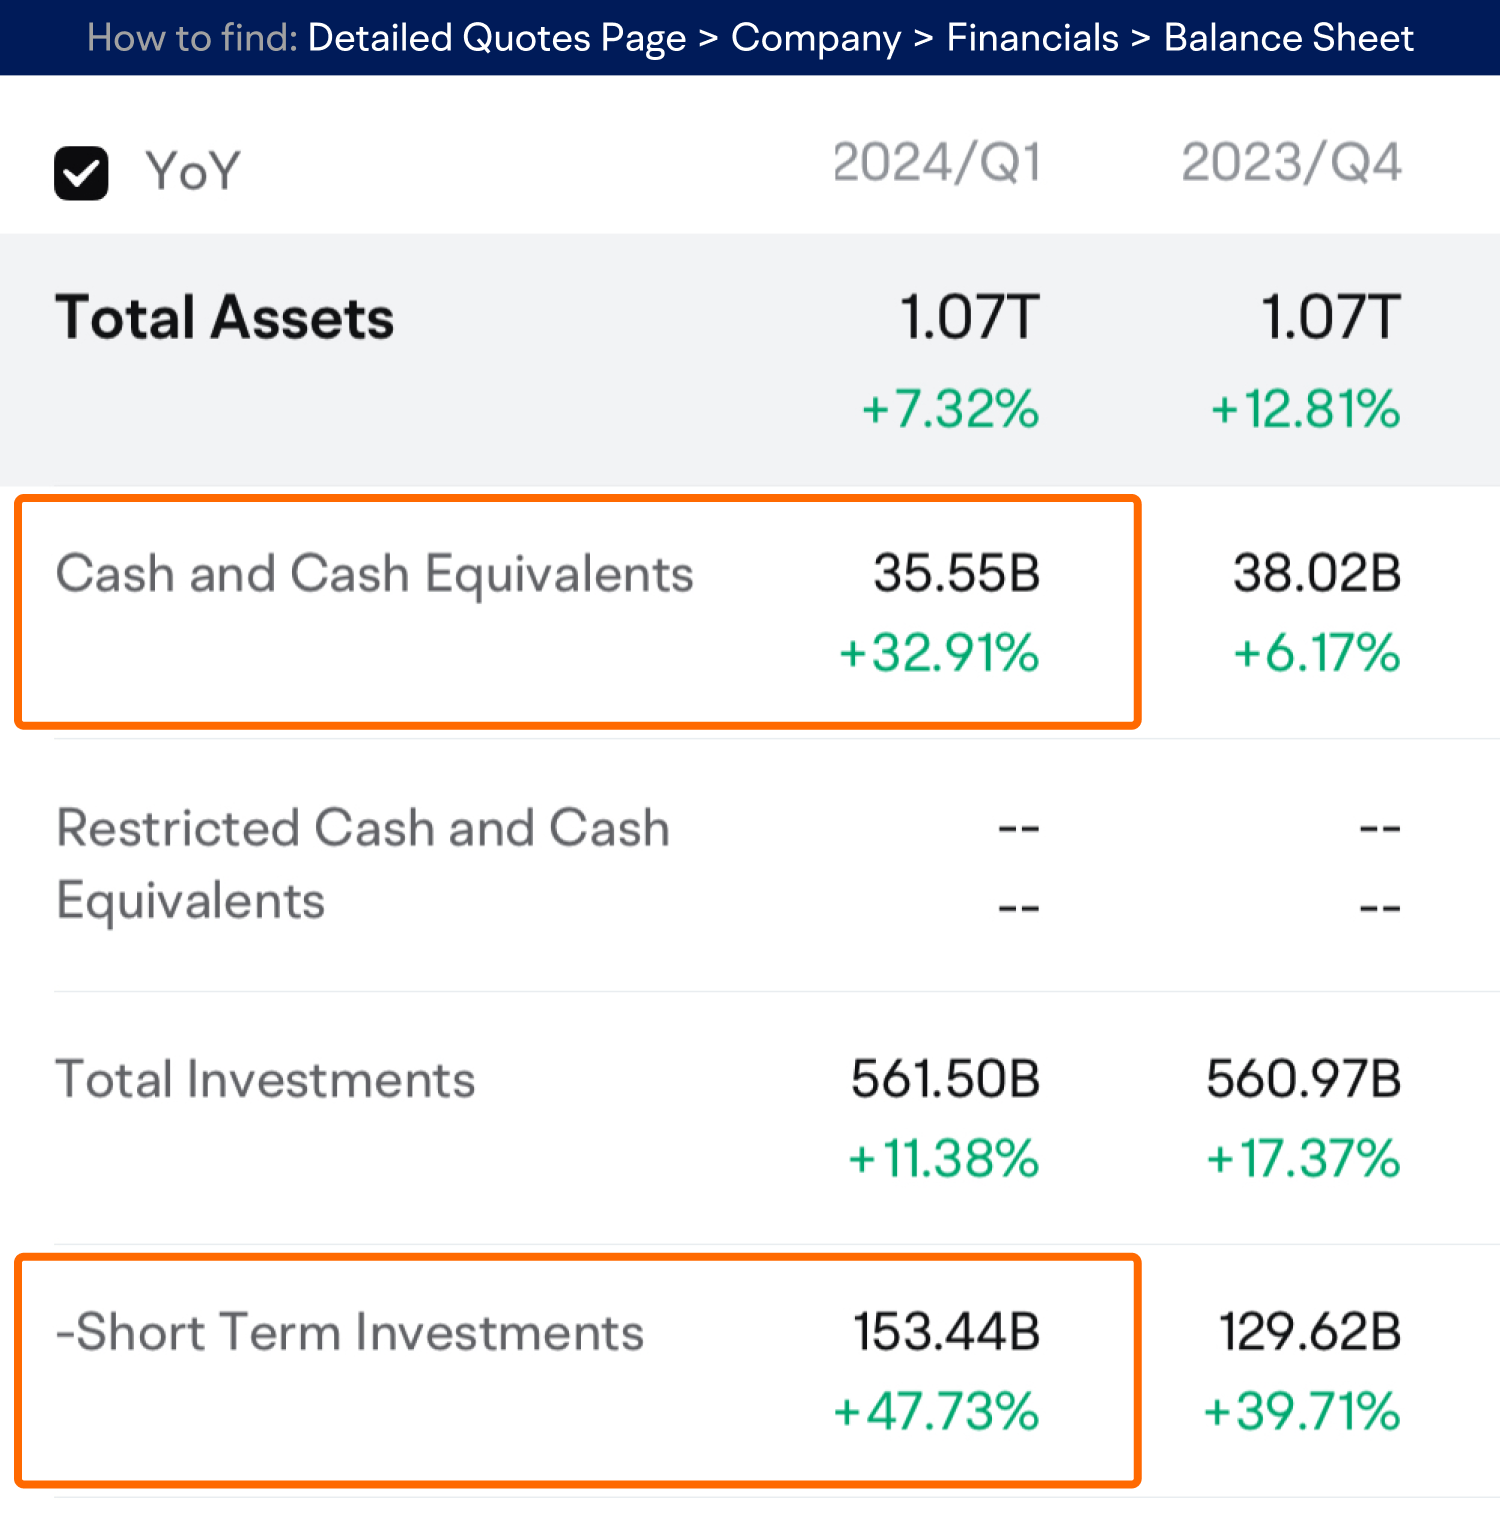
This amount is equivalent to the market capitalization of The Walt Disney Co., which is about $184 billion, or McDonald’s, which is around $180 billion.
When asked why the company isn’t using its cash reserves, Buffett said they would only do so if the risk is low and the returns are significant.
Berkshire’s shareholder equity exceeded $571 billion, the highest of any U.S. company and nearly double that of the second-largest, JPMorgan Chase. This is remarkable, considering the company had less than $50 million in shareholder equity when Warren Buffett became CEO in 1965.
Barron's, a leading financial publication, noted that Berkshire has become more attractive recently due to a lower stock price and rising book value. They estimate that Berkshire’s valuation has dropped to below 1.5 times the estimated June 30 book value, down from over 1.6 times at its peak in late February.
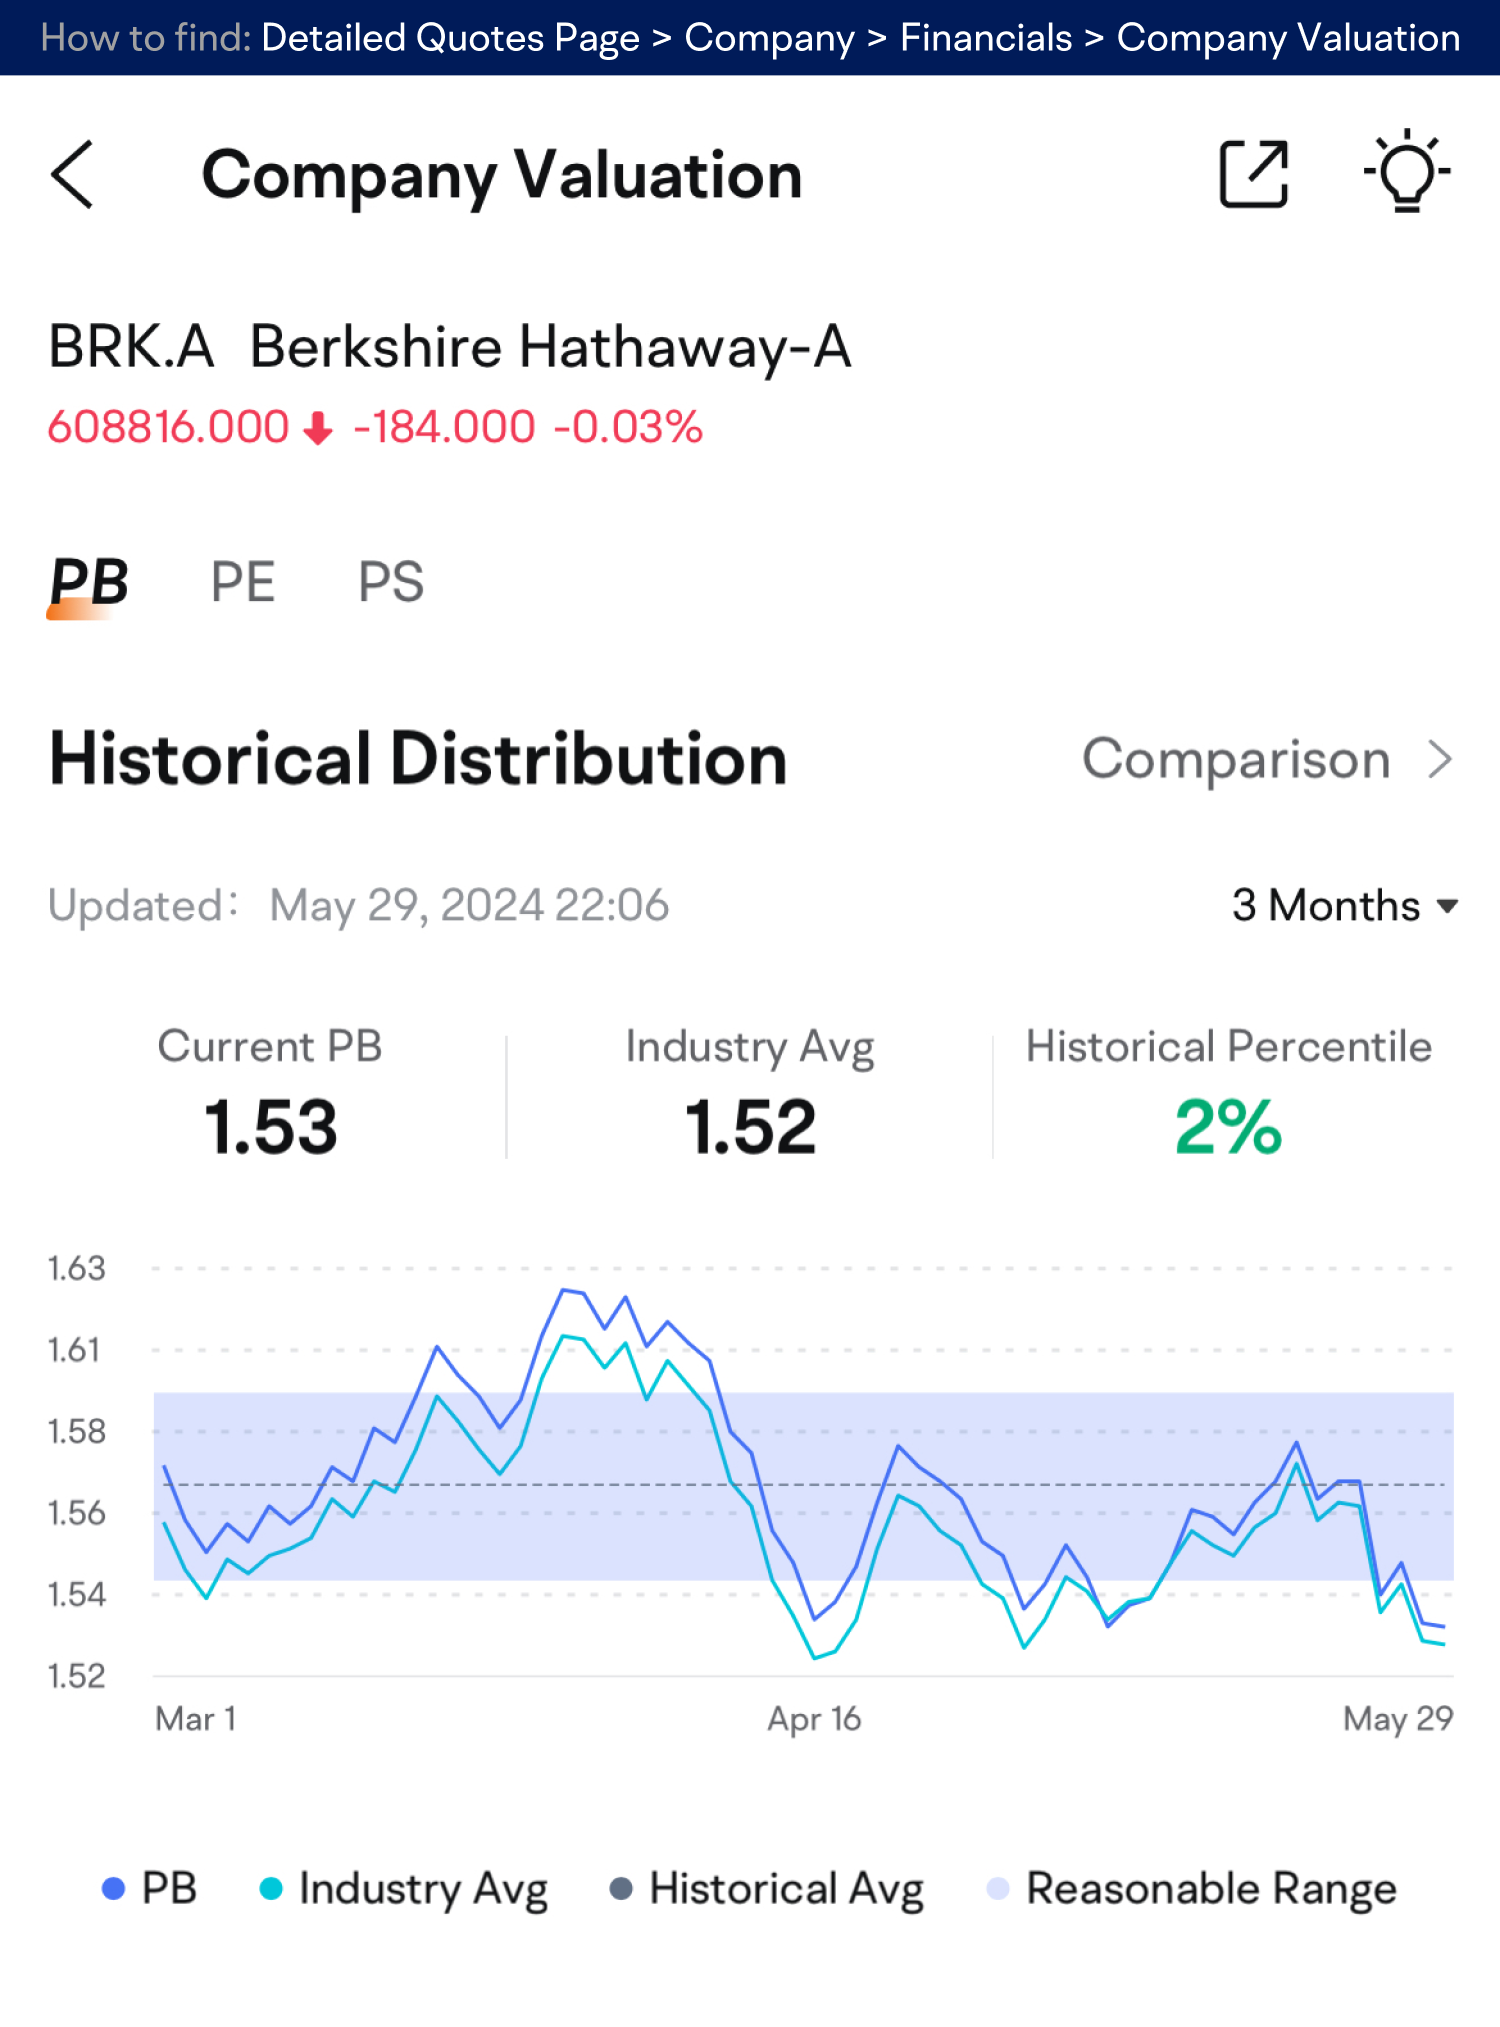
Currently, Berkshire trades close to the average of 1.4 times its book value over the past five years. Book value has traditionally been a key measure for valuing Berkshire.
Chart of the day
Trend analysis:
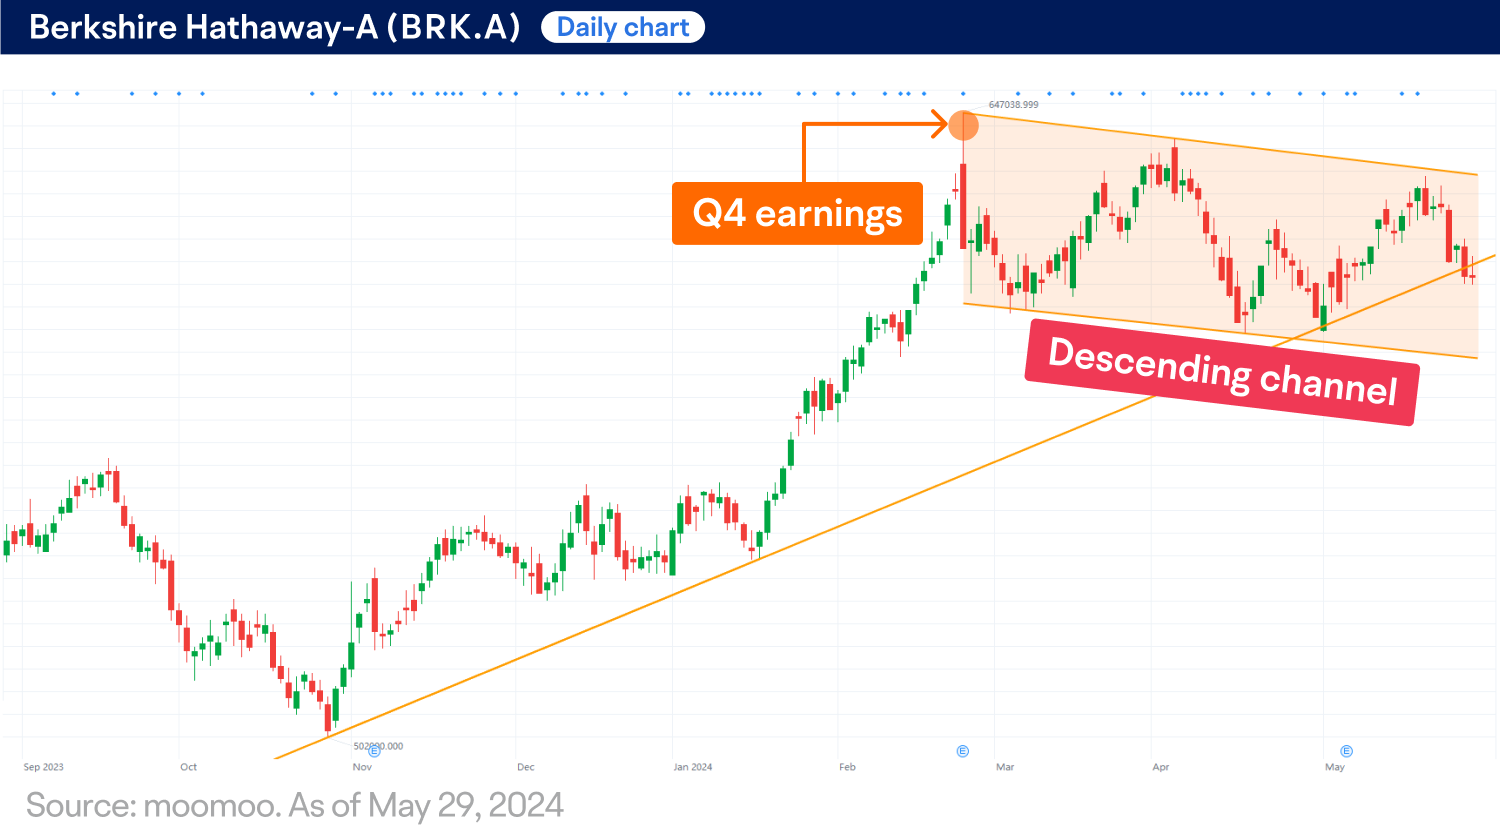
From late October 2023, Berkshire’s A shares (BRK.A) were in an uptrend, rising 28% to a record high of $647,000 in late February 2024, just after the company reported Q4 2023 earnings. Since then, the stock has been in a consolidation phase, trending slightly downwards within a descending channel.
Technical indicators:
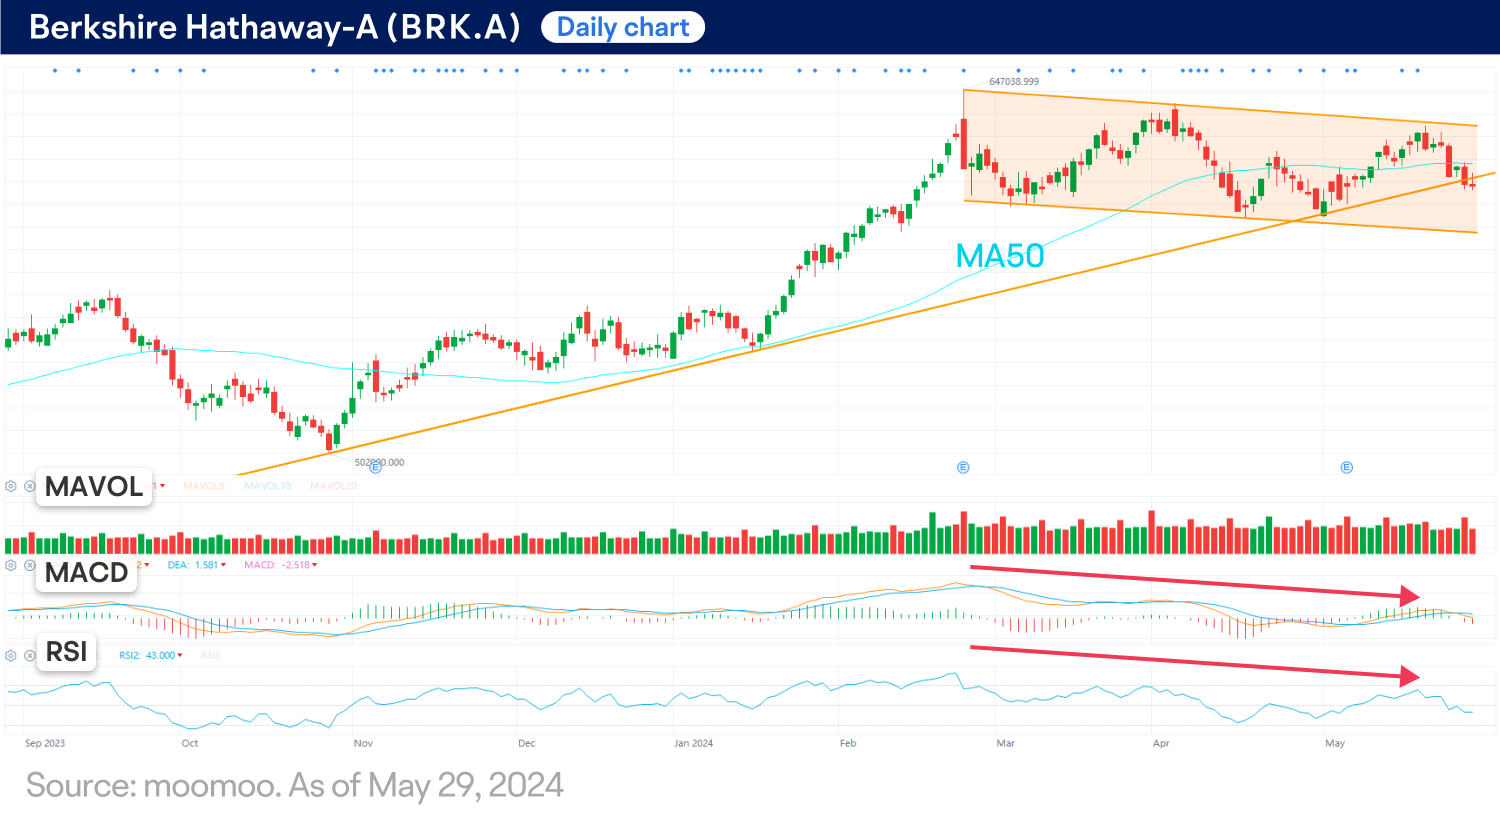
Over the last two months, BRK.A has been fluctuating above and below the 50-day moving average (MA50), indicating market hesitation. The commonly used technical oscillators such as the moving average convergence/divergence (MACD) and the relative strength index (RSI) are trending downwards, consistent with the price trend.
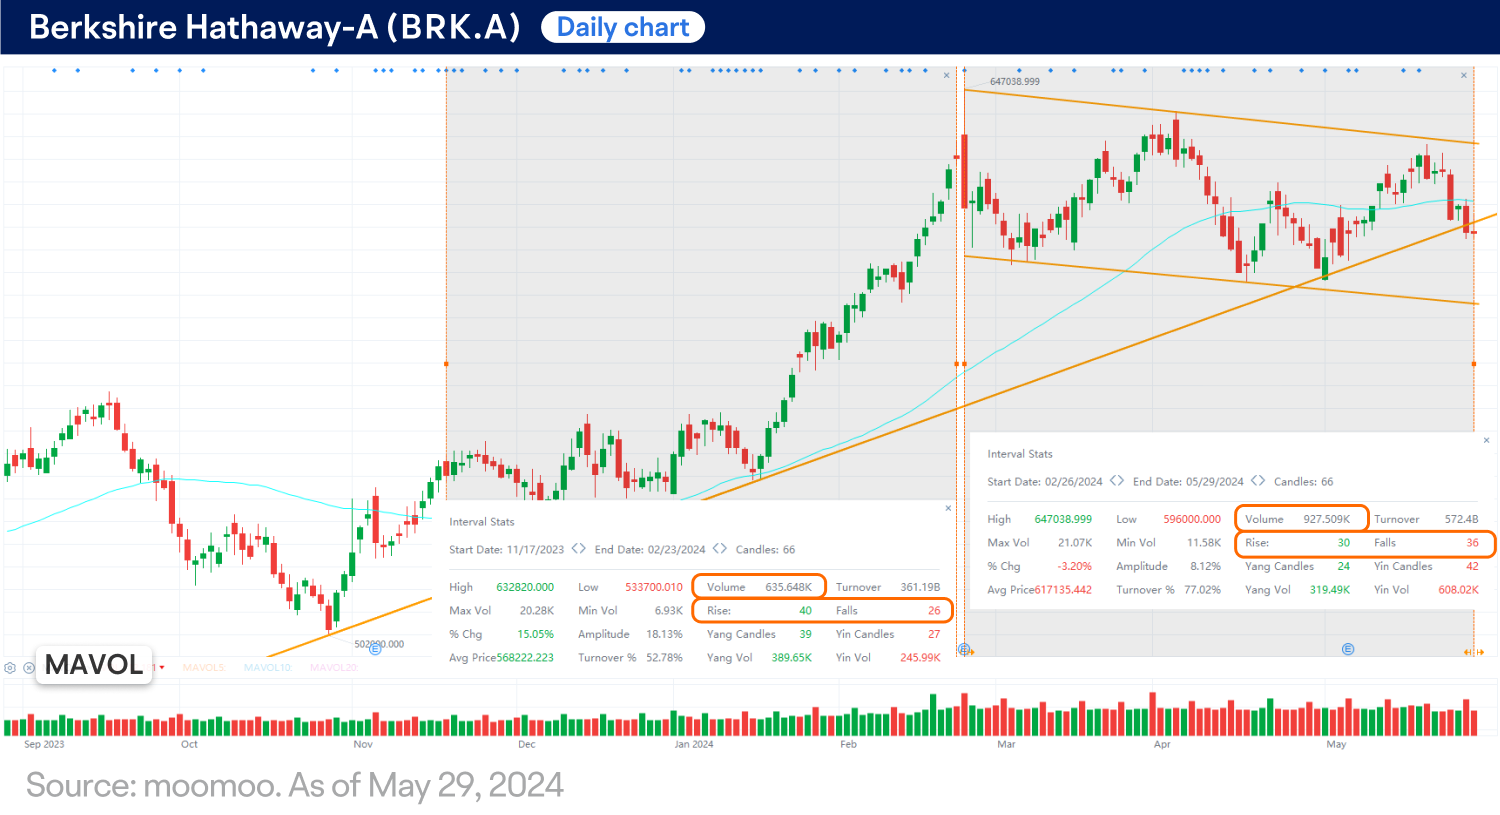
It is unusual to see a noticeable increase in trading volume during the consolidation phase since the stock’s peak in late February.
Next move?
BRK.A has been in a consolidation phase within the descending channel for three months, presenting potential swing trading opportunities for short-term traders.
Traders might also keep an eye on the $600,000 psychological level as well as the 50-day moving average (MA50), which are anticipated to serve as potential support or resistance.
This presentation discusses technical analysis, other approaches, including fundamental analysis, may offer very different views. The examples provided are for illustrative purposes only and are not intended to be reflective of the results you can expect to achieve.
All investing involves risk, including the potential loss of principal, and there can be no guarantee that any investing strategy will be successful.
This presentation is for informational and educational use only and is not a recommendation or endorsement of any particular investment or investment strategy. Investment information provided in this content is general in nature, strictly for illustrative purposes, and may not be appropriate for all investors. Read more