Pfizer's earnings beat: What keeps investors wary? (10/30/2024)

Hello, everyone! This week, we will focus on $Pfizer (PFE.US)$. The pharmaceutical giant's third-quarter results topped expectations and offered an upbeat guidance update. Yet, the stock still dipped over 1%. What's behind this price move? In this article, we'll explore the latest trends and examine the company's recent market activity.
What's new?
On Tuesday, October 29, 2024, Pfizer reported third-quarter adjusted earnings of $1.06 per share on sales of $17.7 billion, surpassing estimates of 61 cents per share on revenues of $14.9 billion, according to FactSet.
However, this strong performance may not silence critics, as much of the success is linked to the company's Covid-19 products, which investors doubt will hold long-term value.
Sales of the Covid-19 antiviral Paxlovid were $2.7 billion for the quarter, significantly exceeding the FactSet consensus estimate of $560 million.
While Paxlovid exceeded expectations, several notable misses affected the quarter's results. Sales of Padcev, a leading cancer treatment acquired in Pfizer's $41 billion purchase of Seagen last year, reached $409 million, falling short of the $420 million consensus estimate from FactSet.
Overall, the earnings beat and guidance raise fell short of alleviating investor concerns. The activist fund Starboard Value, which holds approximately $1 billion in Pfizer shares, urged the board to "hold management accountable" in a recent presentation, citing issues with internal R&D productivity and alleging overpayment during recent acquisitions.
Pfizer shares surged in 2021, driven by the success of the company's Covid-19 products, but have since plummeted alongside dwindling demand. This year, Pfizer’s stock has remained mostly stagnant, while the S&P 500 has risen over 20%.
Chart of the day
Trend analysis:
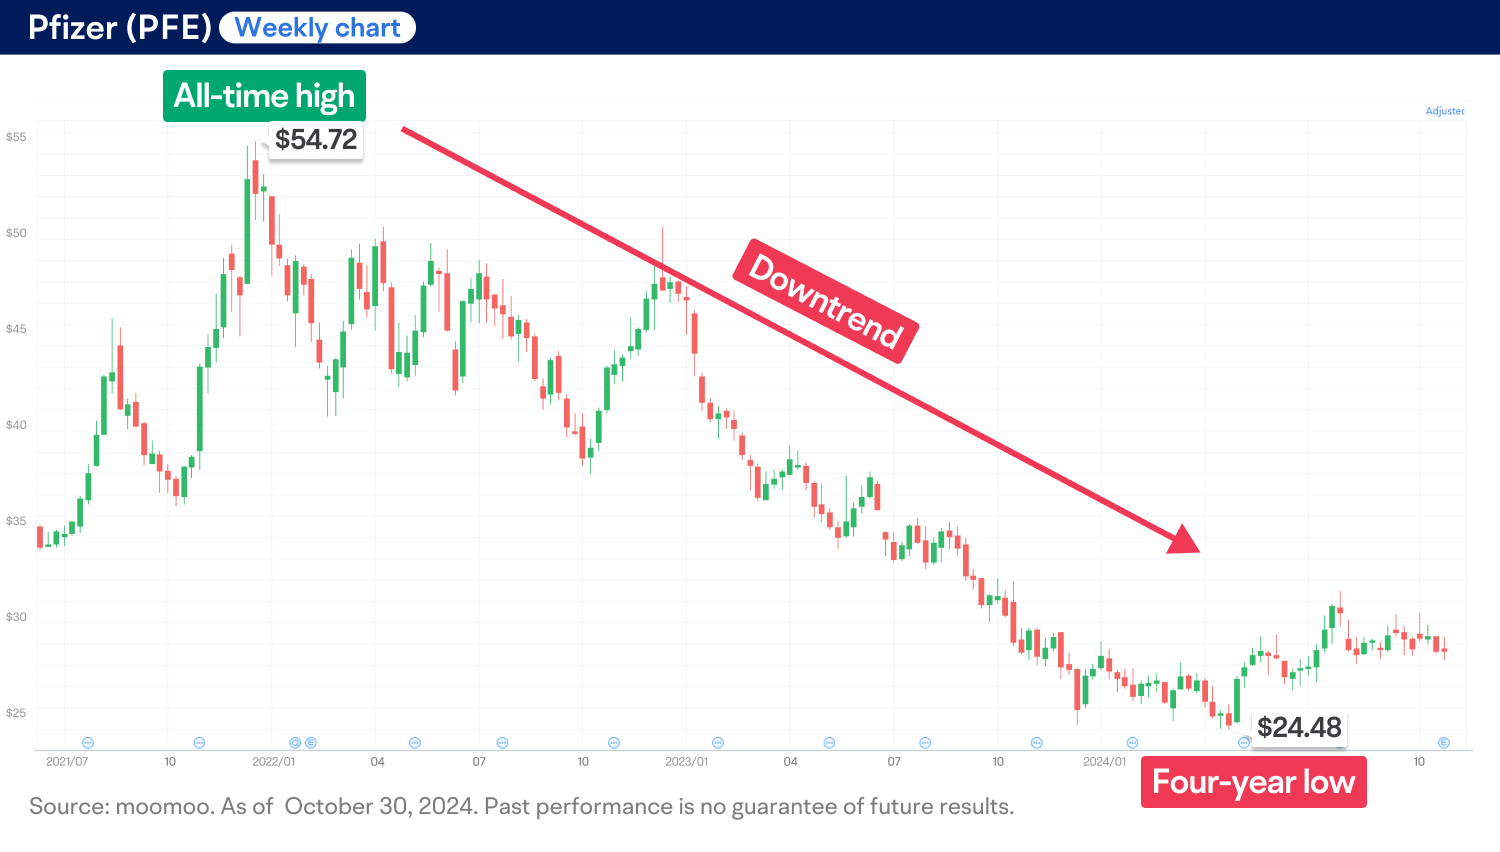
Pfizer's shares (PFE) have experienced a downtrend since its peak in late 2021, falling over 50% and reaching a four-year low of $24.48 in April 2024, as illustrated on the weekly chart.
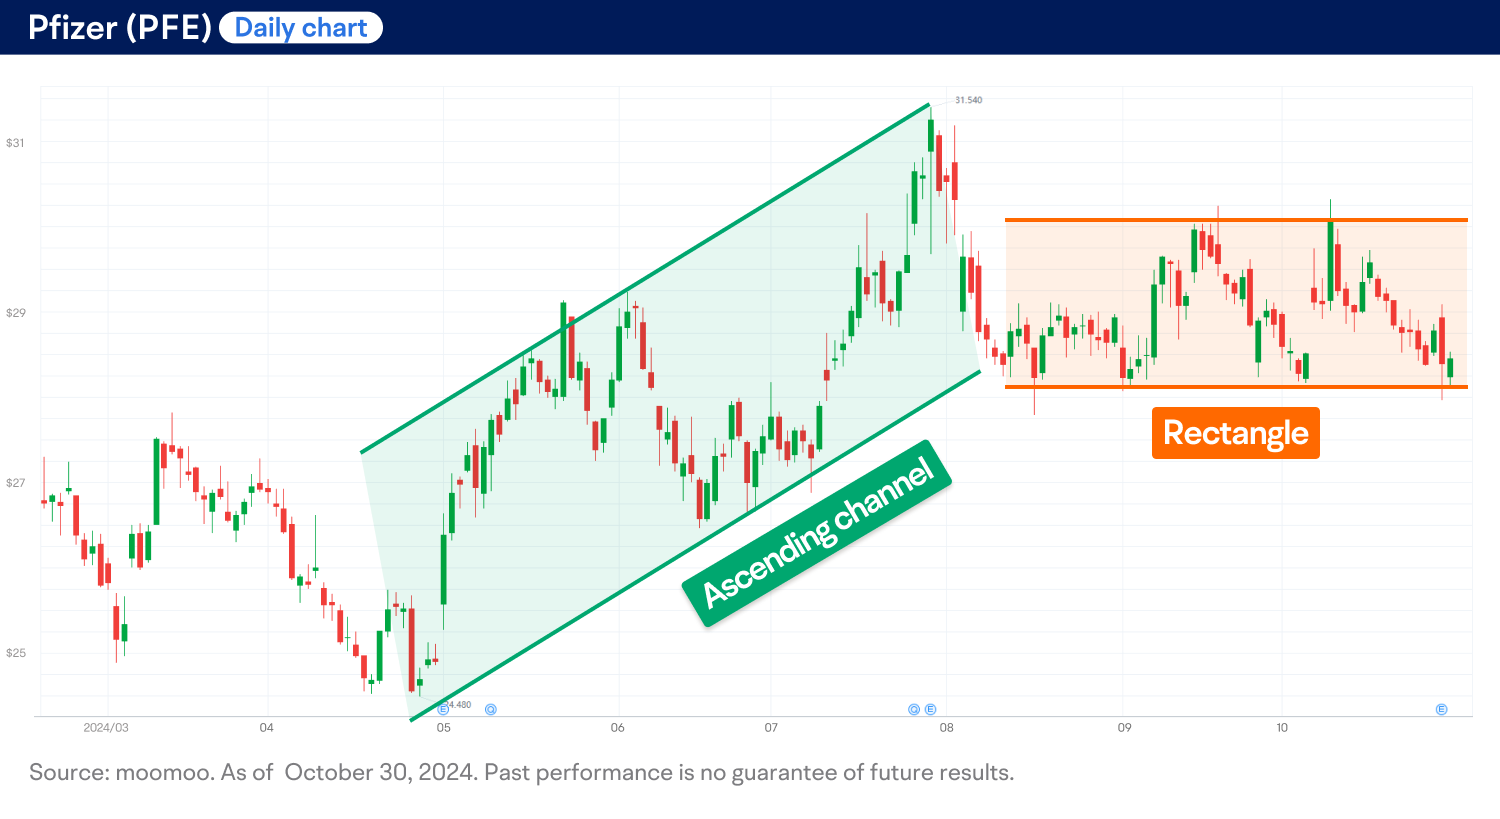
On the daily chart, the stock's recent price movements suggest a potential stabilization, marked by the formation of an ascending channel, followed by a period of consolidation within a rectangular pattern over the past few months.
Technical indicators:
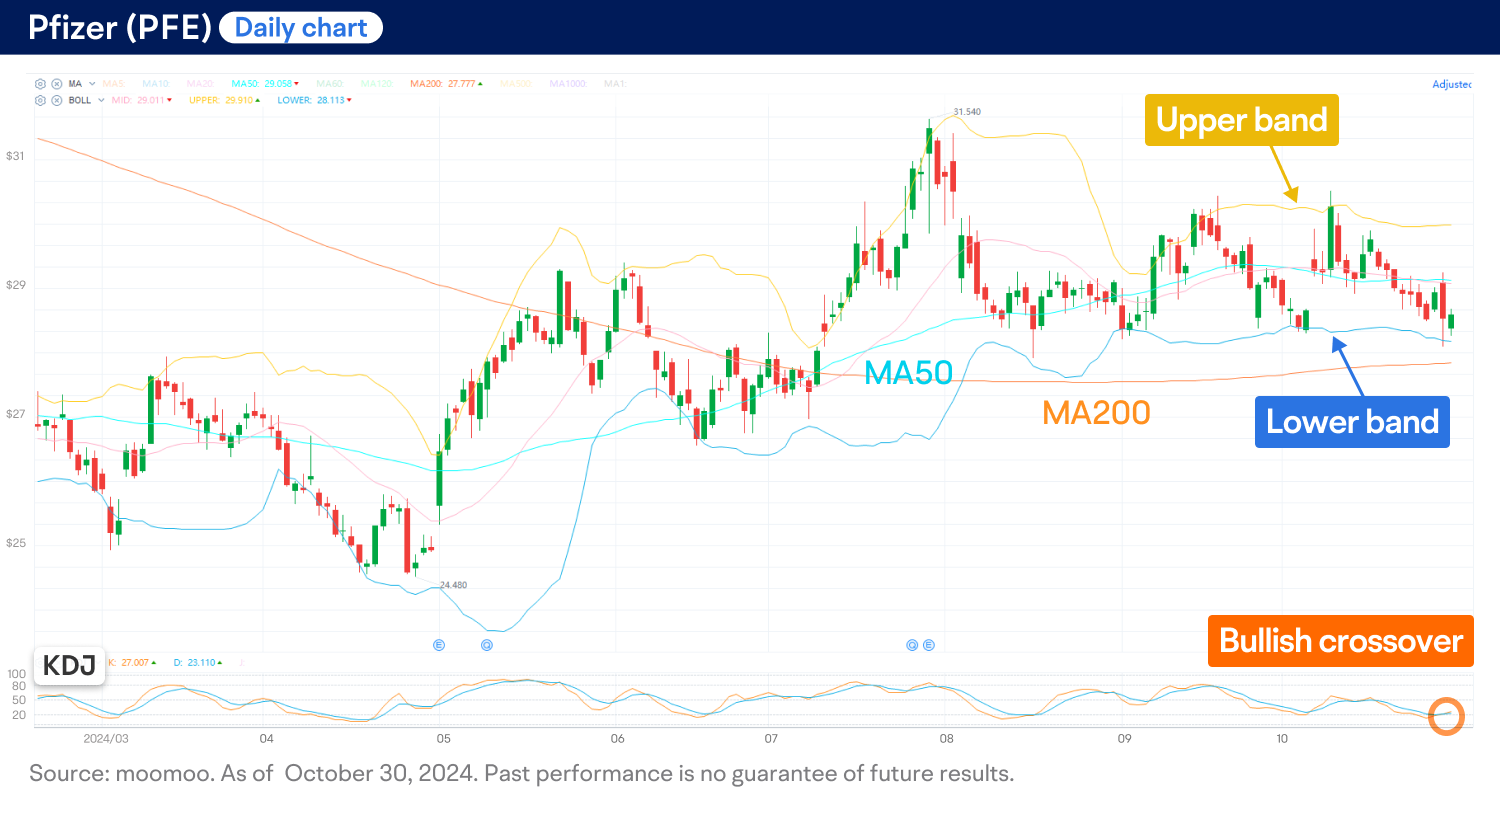
● PFE is trading between the horizontally aligned 50-day and 200-day moving averages (MAs), signaling a period of market consolidation. The 50-day MA functions as a short-term trend indicator and is presently acting as a potential resistance level.
● The Bollinger Bands (BOLL) indicator has suggested a potential trading range over the past two months, with the upper band acting as a resistance level and the lower band providing support.
● The KDJ indicator, a highly sensitive momentum oscillator, has shown a bullish crossover after the K line dipped below the 20-level oversold threshold. This signals a potential short-term price rebound.
In summary, although PFE's overall trend remains bearish, it has shown improvement, with the price rebounding from a four-year low. Given its current consolidation phase, the Bollinger Bands indicator could be a useful tool for a "buy low and sell high" strategy in the short term. This approach might work until a clear breakout occurs from the rectangular pattern on the daily chart.
This presentation discusses technical analysis, other approaches, including fundamental analysis, may offer very different views. The examples provided are for illustrative purposes only and are not intended to be reflective of the results you can expect to achieve.
All investing involves risk, including the potential loss of principal, and there can be no guarantee that any investing strategy will be successful.
This presentation is for informational and educational use only and is not a recommendation or endorsement of any particular investment or investment strategy. Investment information provided in this content is general in nature, strictly for illustrative purposes, and may not be appropriate for all investors. Read more