Stock Price Jumps After Earnings. What's Next?

As the earnings season approaches, companies are releasing their earnings reports one after another.
When a company releases its earnings report, the stock price can go up or down a lot.
Suppose stock price jumps after a better-than-expected earning announcement, what would you do?
● If the company reported an earnings beat, you might follow the price up.
●If the good earnings result has already been priced in the stock price, you might go bearish on the stock.
● If you believe the stock is overvalued, you might wait for a potential pullback in the price before making any decisions.
Your choice may depend on your financial objectives, risk tolerance, and other personal situations.
In this article, we'll introduce an event pattern called the earnings flag, which can potentially help you manage your investment decision after an earnings beat.
01 What is an Earnings Flag
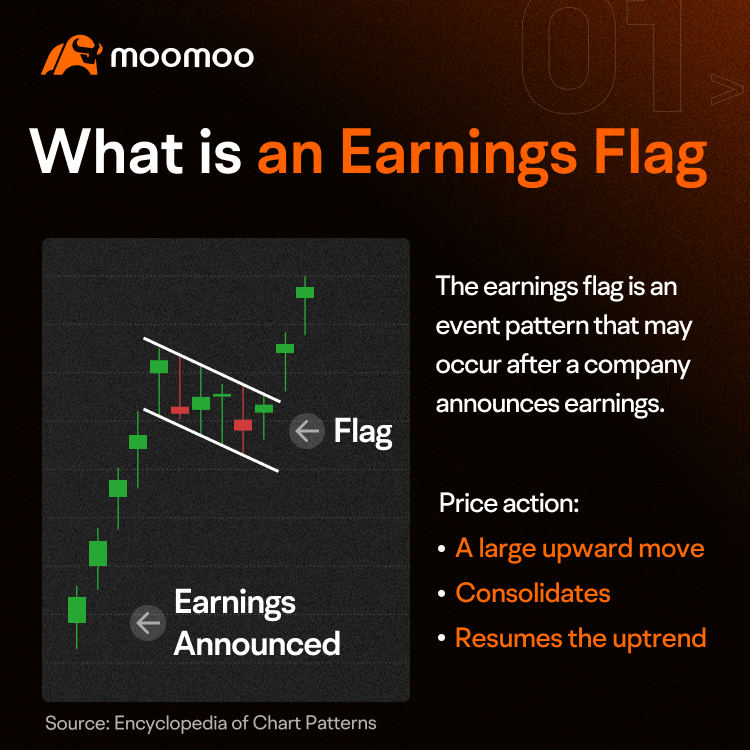
The earnings flag is an event pattern that may occur after a company announces earnings.
Price makes a large upward move, consolidates, then resumes the uptrend.
An earnings flag was first identified by Thomas Bulkowski in the late 1990s.
Investors who are interested in identifying investment opportunities based on earnings announcements may find the earnings flag event pattern to be particularly useful, as it is driven by the company's earnings.
02 Identification Guidelines
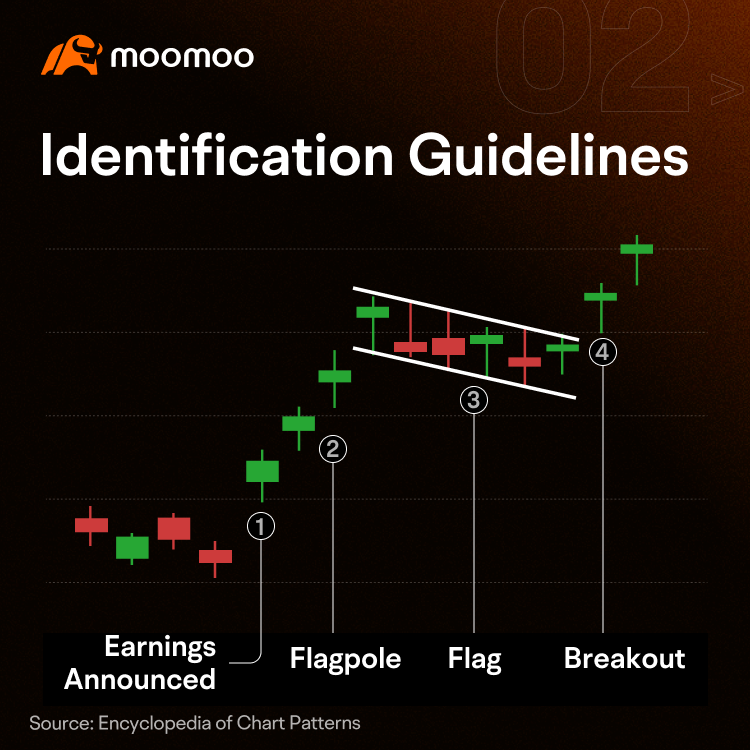
Bulkowski listed the following conditions before identifying this pattern in real trading.
Earnings announced: The pattern is dependent on the earnings announcement. When the company announces better-than-expected earnings, the stock either goes up by a large amount, or there is a price gap upward on the next day if the announcement is made after the stock market has closed.
Flagpole: Then you can search for a price run that appears almost straight upwards on the stock price chart and lasts for several days. This run should resemble a vertical flagpole. Generally, its top is a high of the pattern.
Flag: As the flagpole approaches its highest point, the stock price often consolidates and starts to trend downwards. This creates a rectangular-shaped flag or pennant that looks like a flag hanging from a flagpole. That's why this pattern is called an earnings flag.
Breakout: When the price breaks through the trendline of a flag or pennant pattern or closes above the highest point in the pattern (including the flagpole), it is referred to as a breakout. When relying on this pattern, it is important to wait for an upward breakout before considering taking action.
03 Strategy
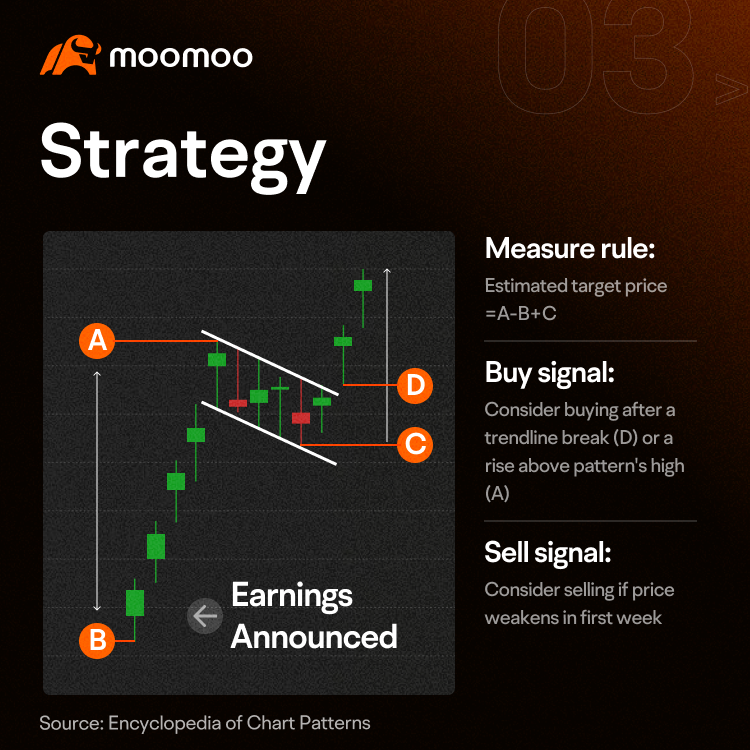
How can investors use this pattern to identify potential buying and selling opportunities? Thomas Bulkowski has summarized some trading strategies based on the features of this pattern.
Measure rule: To estimate the target price or how much the price might be expected to rise, you can use the measure rule. First, compute the formation height from the highest high in the pattern (A) to the lowest low on the day the earnings result is announced (B). Then, add this difference to the lowest low in the flag part of the pattern (C). This will give you a forecasted target price. According to Bulkowski's statistics, the price may reach the price target 86% and 84% of the time in bull and bear markets, respectively. [1]
Buy signal: The pattern is confirmed when the price breaks out above the highest high or pierces through a trend line. There are two potential buy signals associated with this pattern. The first potential buy signal occurs when the price closes above the trend line of the flag (D). The second potential buy signal occurs when the price closes above the highest high of the pattern (A).
Sell signal: Trading this pattern can be difficult because the price can rise quickly and then drop significantly. If the price shows weakness in the first week, you may consider exiting your position. It can be important to consider taking potential profits relatively quickly when trading this pattern. If the price continues to rise after a brief pullback, you may consider buying again and riding the uptrend.
It's important to remember that the earnings flag pattern is just one tool to help investors spot potential buying and selling points. When deciding whether to buy, you should also consider analyzing the company's fundamentals and using other technical indicators to make informed decisions.
[1] Source: Encyclopedia of Chart Patterns. Page 893.
04 Example
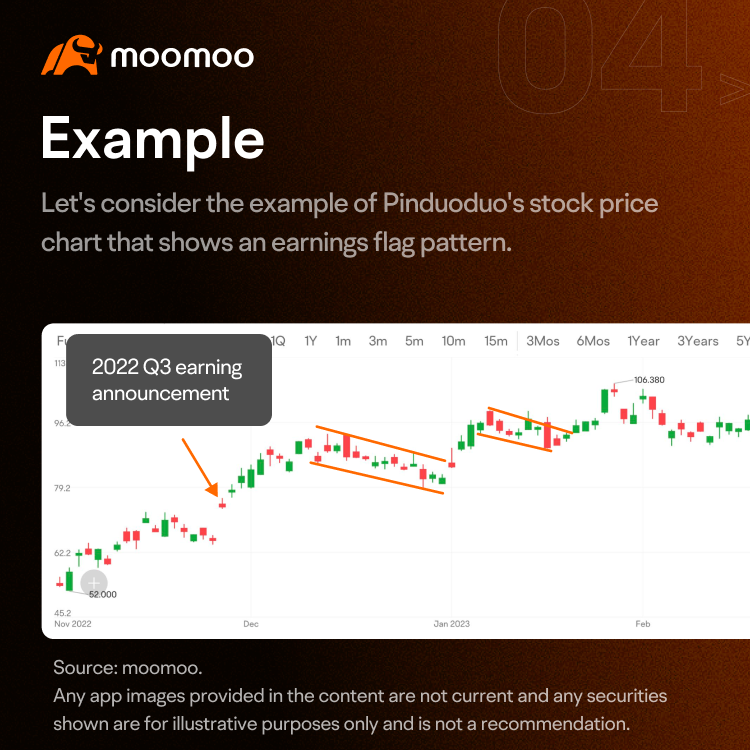
Let's look at Pinduoduo's stock price chart which showed an earnings flag pattern.
When Pinduoduo released Q3 earnings, the stock price rose sharply on that day and continued its upward momentum for the next few days, forming a part of the flagpole. The stock price then entered a consolidation phase, forming a flag pattern. After breaking out from consolidation, the stock price continued its upward trend.
As the stock price pulled back, it formed a second flag. After breaking out from this flag, there was another wave of rising prices.
05 Track Earnings Release
The earnings flag pattern can be a useful tool for traders to help identify potential trading opportunities.
By monitoring when companies release their earnings, traders can use the earnings flag pattern to assist them in forecasting the stock's price movement following the release.
In the US, listed companies are required to announce their financial reports four times a year. These periods are known as earnings seasons.
However, the specific timing of each company's earnings release is not fixed. To help identify which companies are releasing earnings each week, you can refer to the earnings calendar on moomoo.
Open the app, and tap on Markets > Explore > Earnings Reports. On the left side of the box, you can see how many companies will release financial reports each day. Click on it to find which companies are releasing their reports.

06 Summary
An earnings flag pattern is an event-driven short-term bullish continuation pattern.
It helps investors forecast a stock's price movement after an earnings announcement.
However, it's important to remember that the pattern is not always guaranteed to be successful and can produce false signals.
Hence, it's beneficial to consider other fundamental and technical analysis indicators to help make informed trading decisions.
Additional disclosures: This presentation discusses technical analysis, other approaches, including fundamental analysis, may offer very different views. The examples provided are for illustrative purposes only and are not intended to be reflective of the results you can expect to achieve. Specific security charts used are for illustrative purposes only and are not a recommendation, an offer to sell, or a solicitation of an offer to buy any security.
This presentation is for informational and educational use only and is not a recommendation or endorsement of any particular investment or investment strategy. Investment information provided in this content is general in nature, strictly for illustrative purposes, and may not be appropriate for all investors. Read more