JPMorgan stock tumbles. Is it too expensive? (05/22/2024)
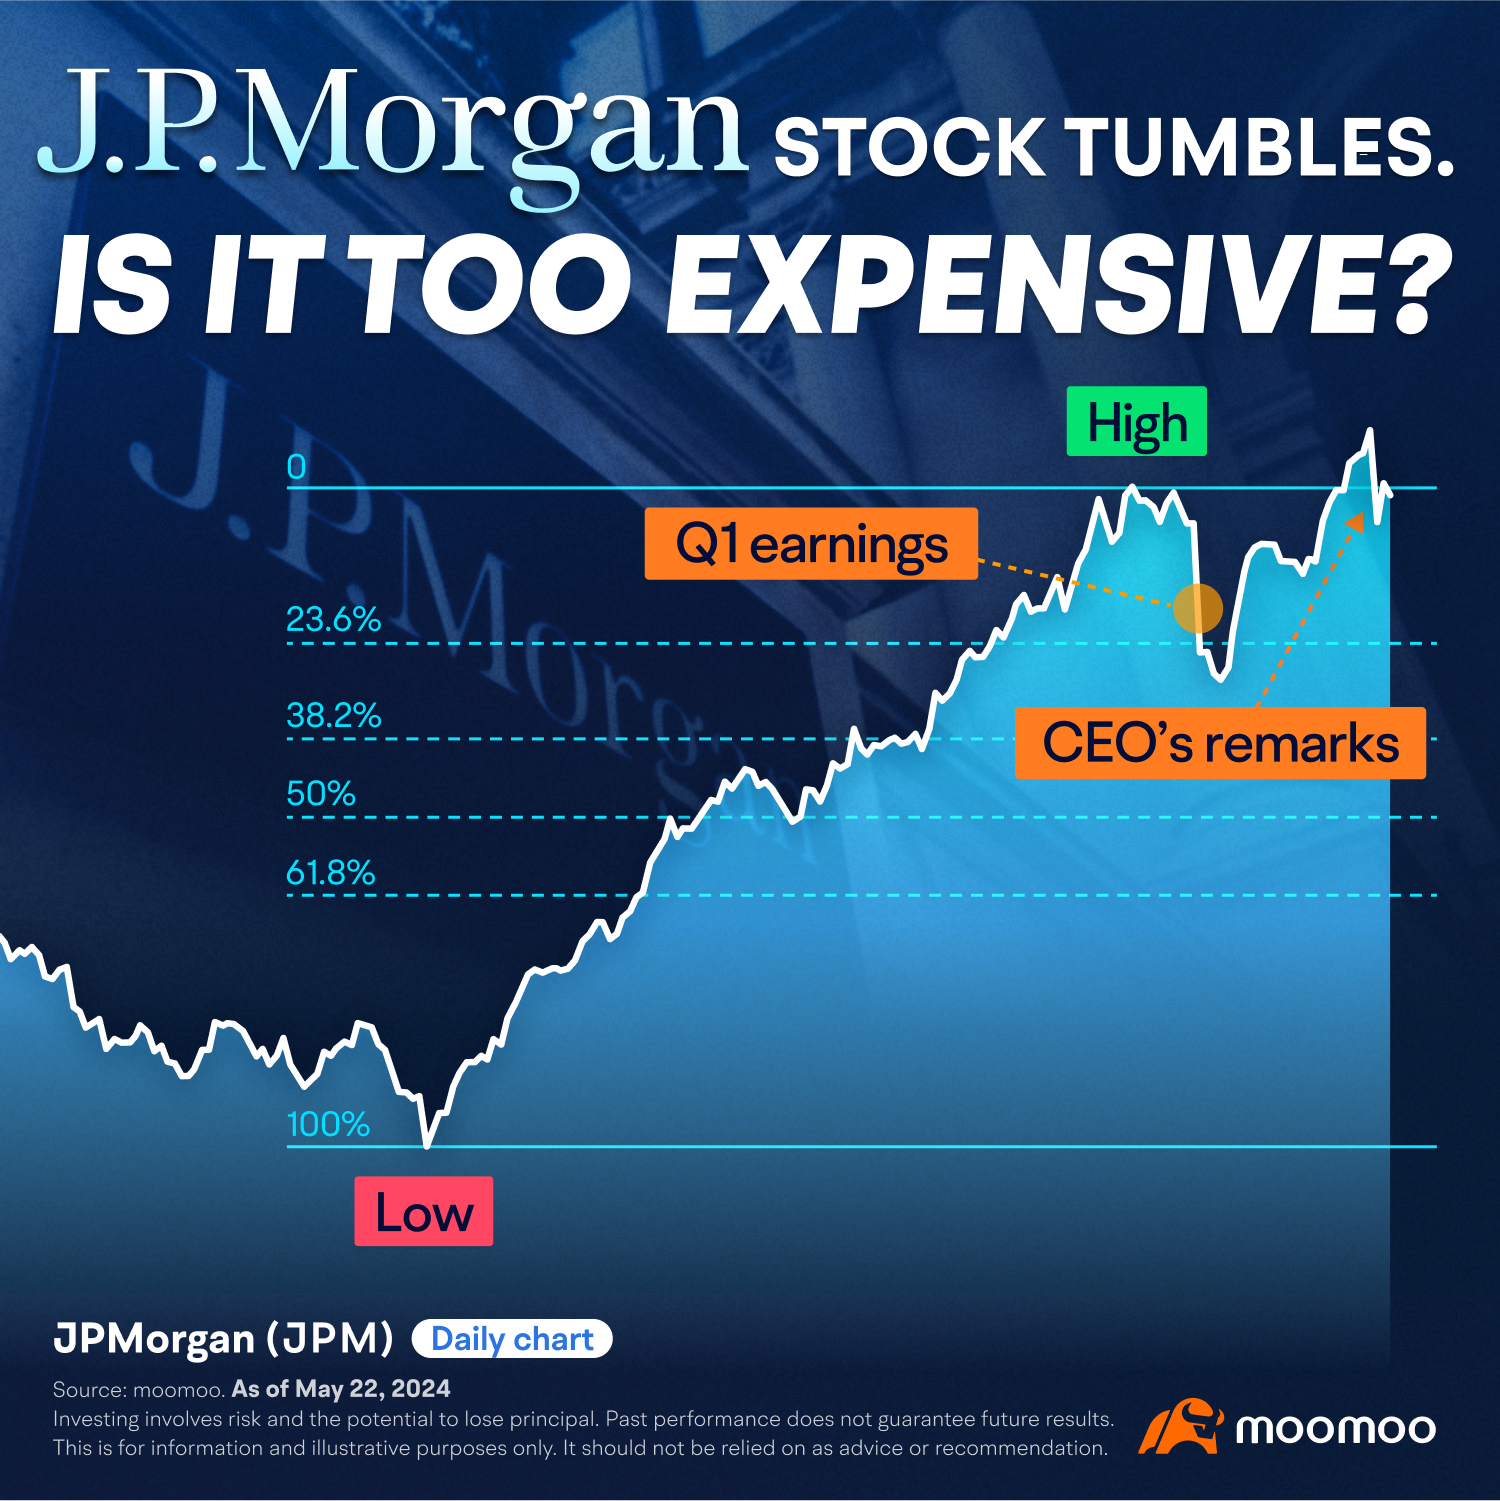
Hello, everyone! This week, we’re highlighting JPMorgan Chase & Co. $JPMorgan(JPM.US)$, the biggest U.S. bank by assets. We’ll explore the latest trends and take a close look at the company's recent market activity.
What’s new?
On May 20, 2024, JPMorgan’s stock price, which had surged by 40% over the past year to a 52-week high of $205.88, suddenly plunged by 4.5%. This decline was triggered by a comment from the bank’s longtime CEO, Jamie Dimon, who warned that JPMorgan's shares might be overvalued and hinted that he might retire sooner than expected.
During JPMorgan’s annual investor meeting, Dimon clarified the bank’s stance on share repurchases by stating, “Buying back the stock of a financial company at more than twice its tangible book value is a mistake. We aren’t going to do it.”
Data from moomoo reveals a nuanced picture of JPMorgan's valuation, as measured by two industry metrics that are widely used—price-to-book (P/B) and price-to-earnings (P/E).
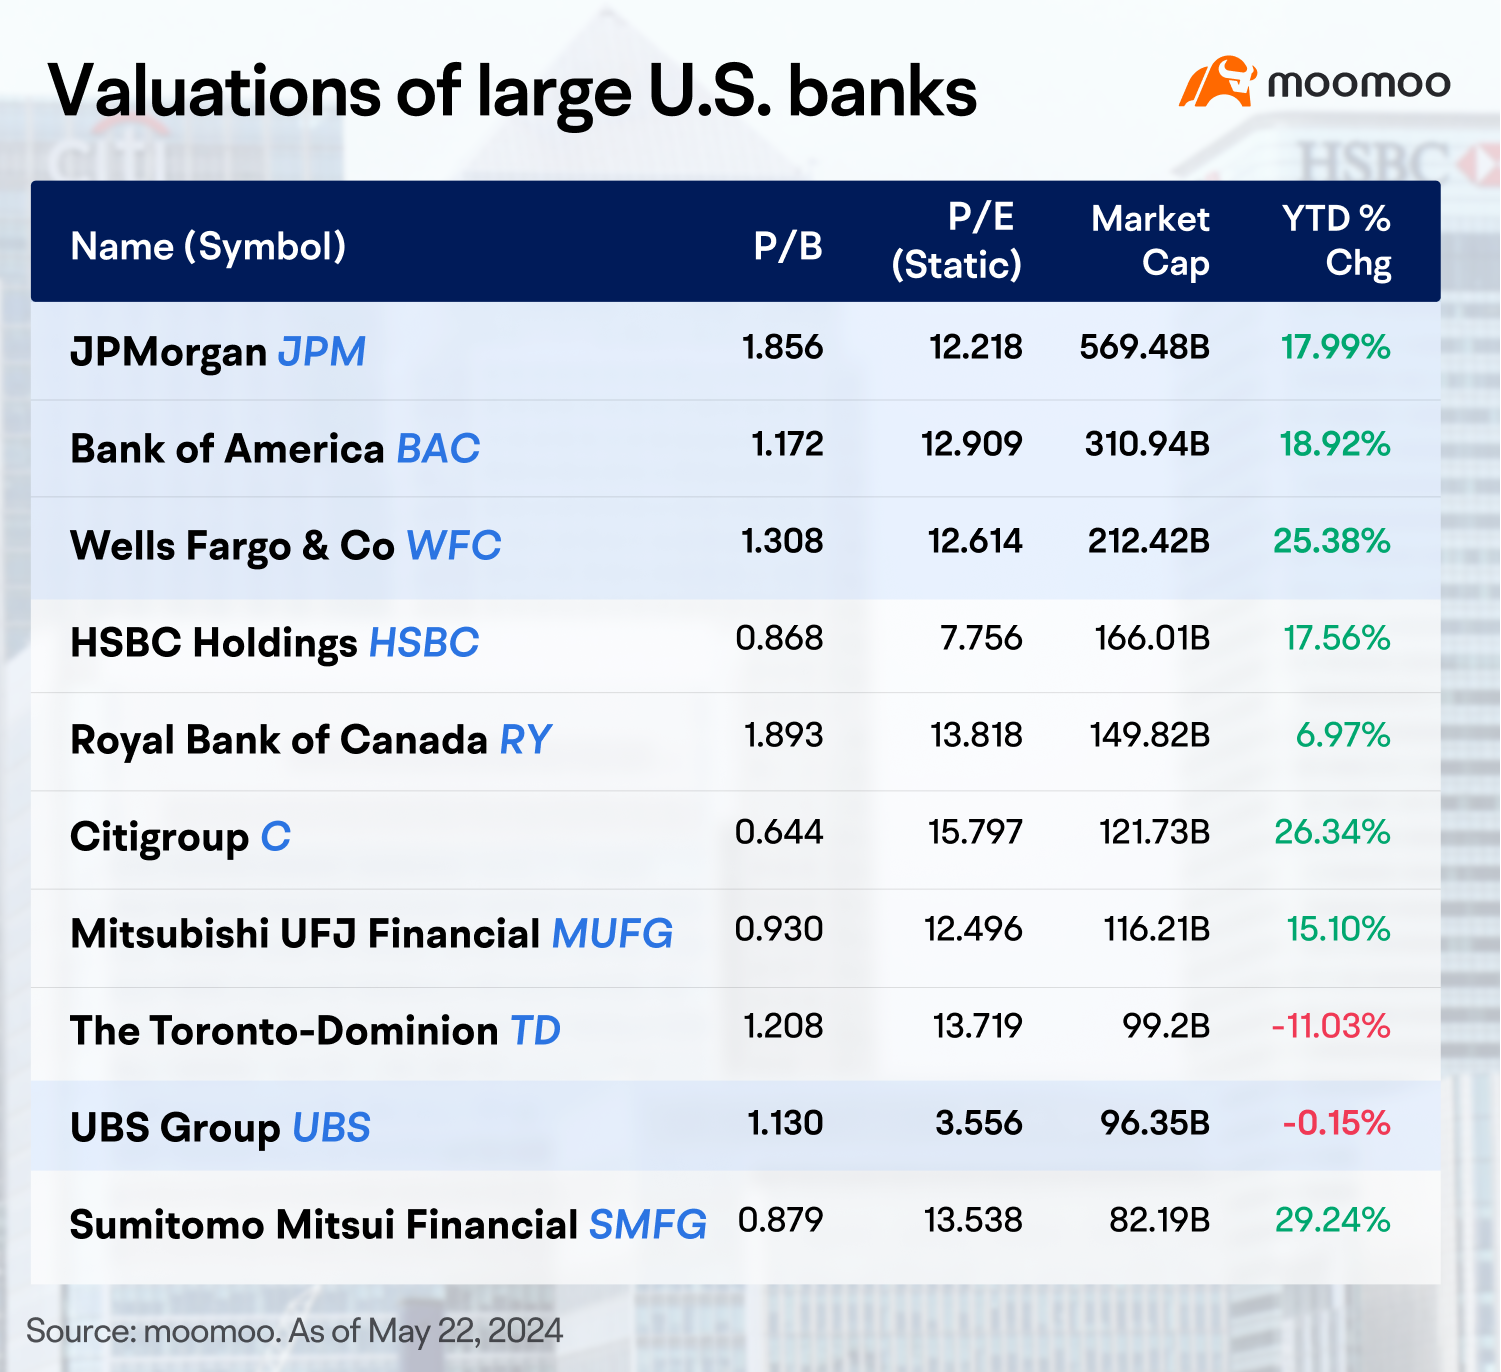
At present, JPMorgan is priced at around 12 times P/E, which is on par with the average level among top U.S. lenders. However, in terms of P/B, the bank's valuation is approximately 1.8 times, which is significantly higher than its peers.
It’s worth noting that JPMorgan has been repurchasing its stock under a previously authorized buyback program. Dimon’s comment suggests that it is unlikely the program will be expanded anytime soon.
According to a March research note by Portales Partners analyst Charles Peabody, JPMorgan is likely to purchase shares at a $2 billion to $2.5 billion quarterly clip.
Chart of the day
Trend analysis:
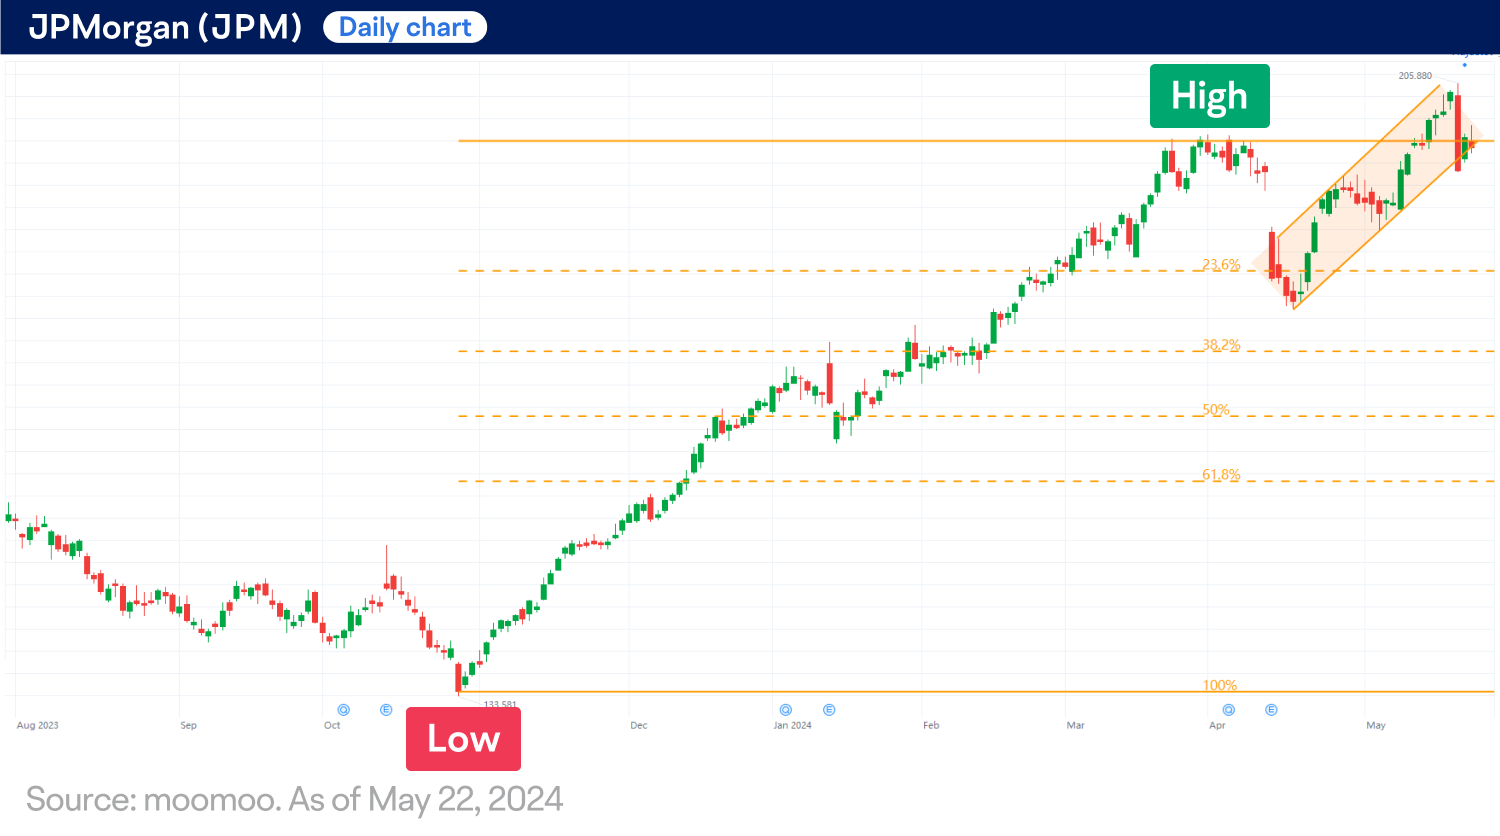
Since late October 2023, JPMorgan’s stock (JPM) has been on a robust uptrend, up by an impressive 45% as of May 17, 2024. The absence of any significant price corrections during the uptrend, as evidenced by the Fibonacci retracement tool, provides a strong indication that the bull market remains intact.
Technical indicators:
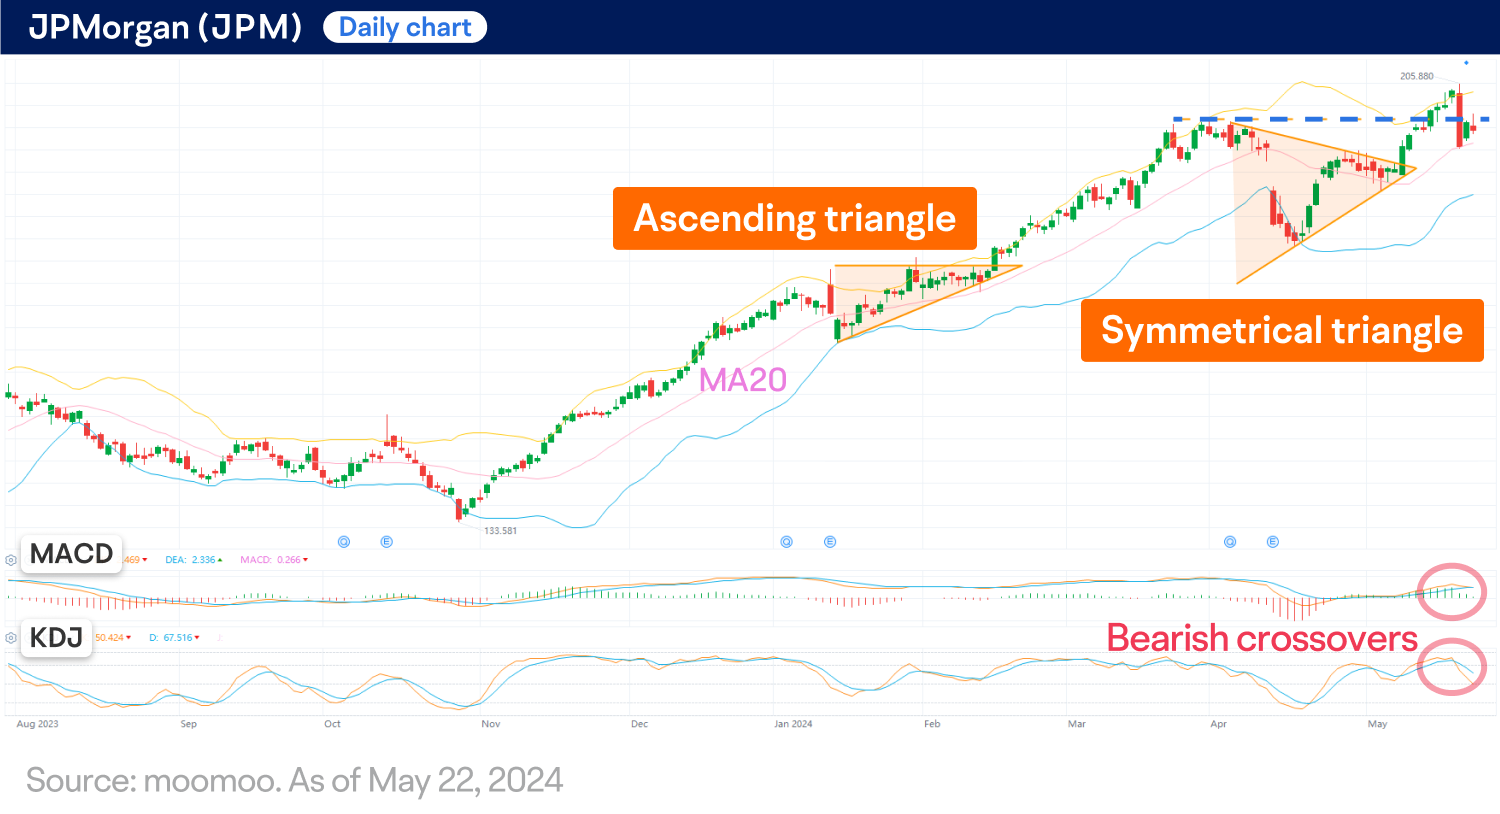
The Bollinger Bands indicator shows that JPM has mostly remained above the middle band, which is the 20-day moving average (MA20), and is likely to act as potential support.
The moving average convergence/divergence (MACD) oscillator and the KDJ indicator are signaling a bearish crossover, indicating a potentially short-term bearish sentiment.
The stock had previously formed a symmetrical triangle, a consolidation chart pattern, before hitting record highs.
The $200 psychological level might serve as a potential resistance in the short term.
Next move?
While JPM is still poised to move upward as the uptrend persists, traders may key an eye out for potential short-term price corrections.
The 20-day moving average (MA20) could continue to provide support, while the $200 level serves as a key psychological benchmark for short-term market sentiment.
This presentation discusses technical analysis, other approaches, including fundamental analysis, may offer very different views. The examples provided are for illustrative purposes only and are not intended to be reflective of the results you can expect to achieve.
All investing involves risk, including the potential loss of principal, and there can be no guarantee that any investing strategy will be successful.
This presentation is for informational and educational use only and is not a recommendation or endorsement of any particular investment or investment strategy. Investment information provided in this content is general in nature, strictly for illustrative purposes, and may not be appropriate for all investors. Read more