Lululemon shares plummet. Breakout or fakeout? (03/27/2024)

Hello, everyone! This week, we’ll be focusing on Lululemon Athletica $Lululemon Athletica(LULU.US)$ to analyze the latest trends and examine the company’s recent market movements.
What’s new?
On March 22, 2024, Lululemon's shares plummeted 16% after the athletic apparel retailer issued disappointing guidance and said it’s seeing soft sales in the U.S., its largest market.
While the retailer's holiday earnings exceeded expectations, its growth in North America showed stagnation, with a mere 9% sales increase compared to the previous year’s 29% growth for the same quarter.
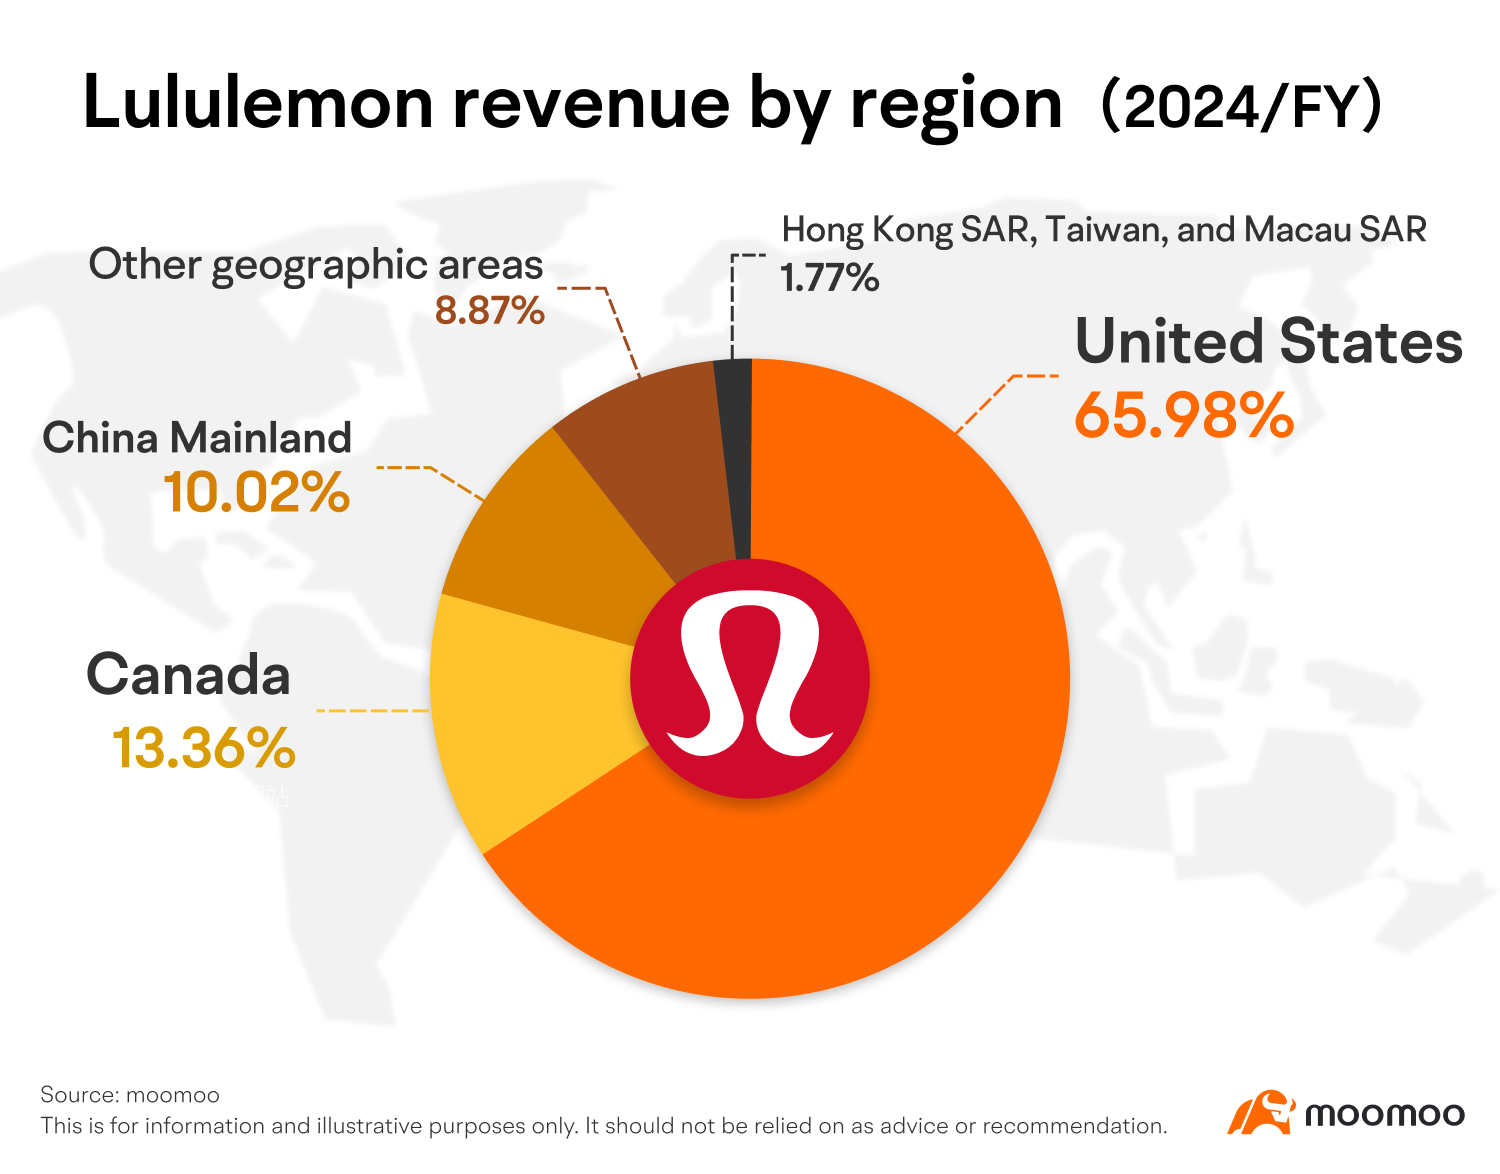
During an analyst call, CEO Calvin McDonald recognized the change in U.S. consumer patterns and a sluggish kickoff to the year. Lululemon anticipates its quarterly net revenue to range from $2.18 billion to $2.20 billion, marking an increase of 9% to 10%. This forecast is below the analysts' projection of $2.25 billion, or a 12.5% rise, as reported by LSEG.
With more competition in the women's athletic apparel market, Lululemon faces challenges to maintain its market leadership position against newer entrants like Alo Yoga and Vuori.
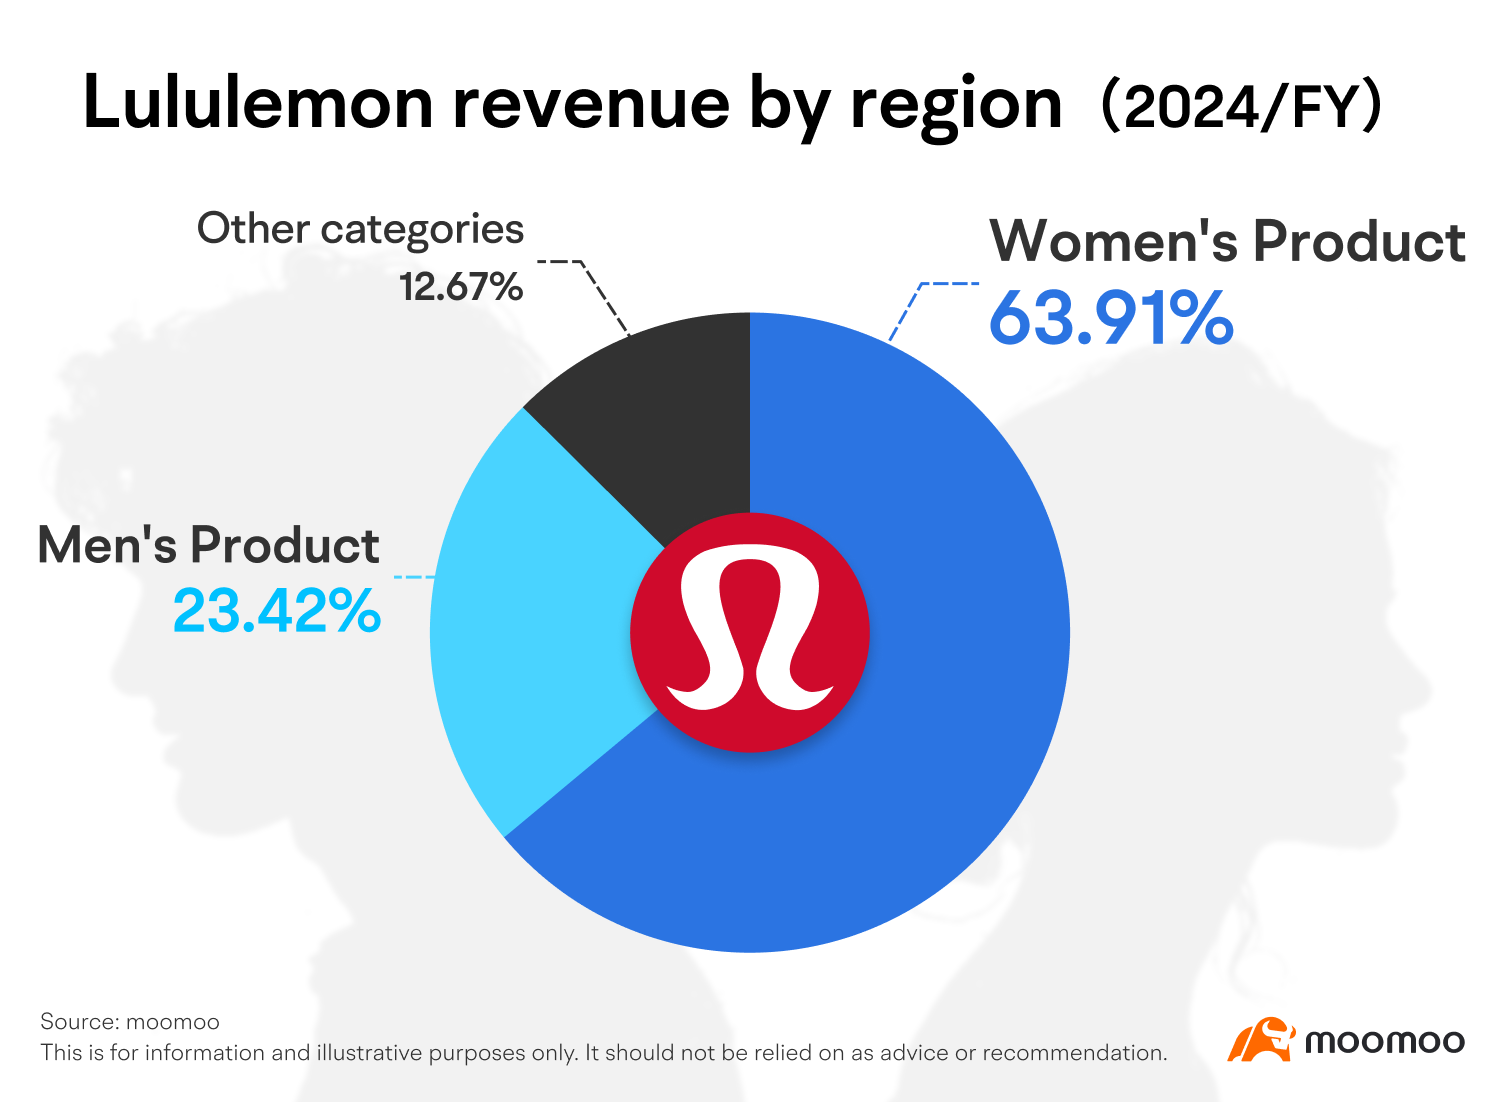
Facing the same issues as its rivals, Lululemon contends with erratic demand and reduced discretionary spending, a trend that’s heavily affected the apparel sector. Investors are keeping a watchful eye on how Lululemon fares in North America, its key revenue driver, as it grapples with touch year-over-year comparisons and a consumer shift favoring experiences over new apparel and footwear purchases.
On March 22, 2024, Barclays adjusted its outlook on Lululemon, lowering the price target from $610 to $546 while maintaining an Overweight rating on the stock.
The good news is that Lululemon is currently focused on expanding its international presence, with Q4 international sales growing 54% on a reported basis. Sales in China grew by 78%, and the rest of Lululemon's markets saw a 36% increase.
Chart of the day
Since the start of 2024, LULU has been on a downward trend that diverges from the broader market. As of March 27, 2024, LULU had fallen by 24%, in stark contrast to the 10% increase observed in the S&P 500.
Trend analysis:
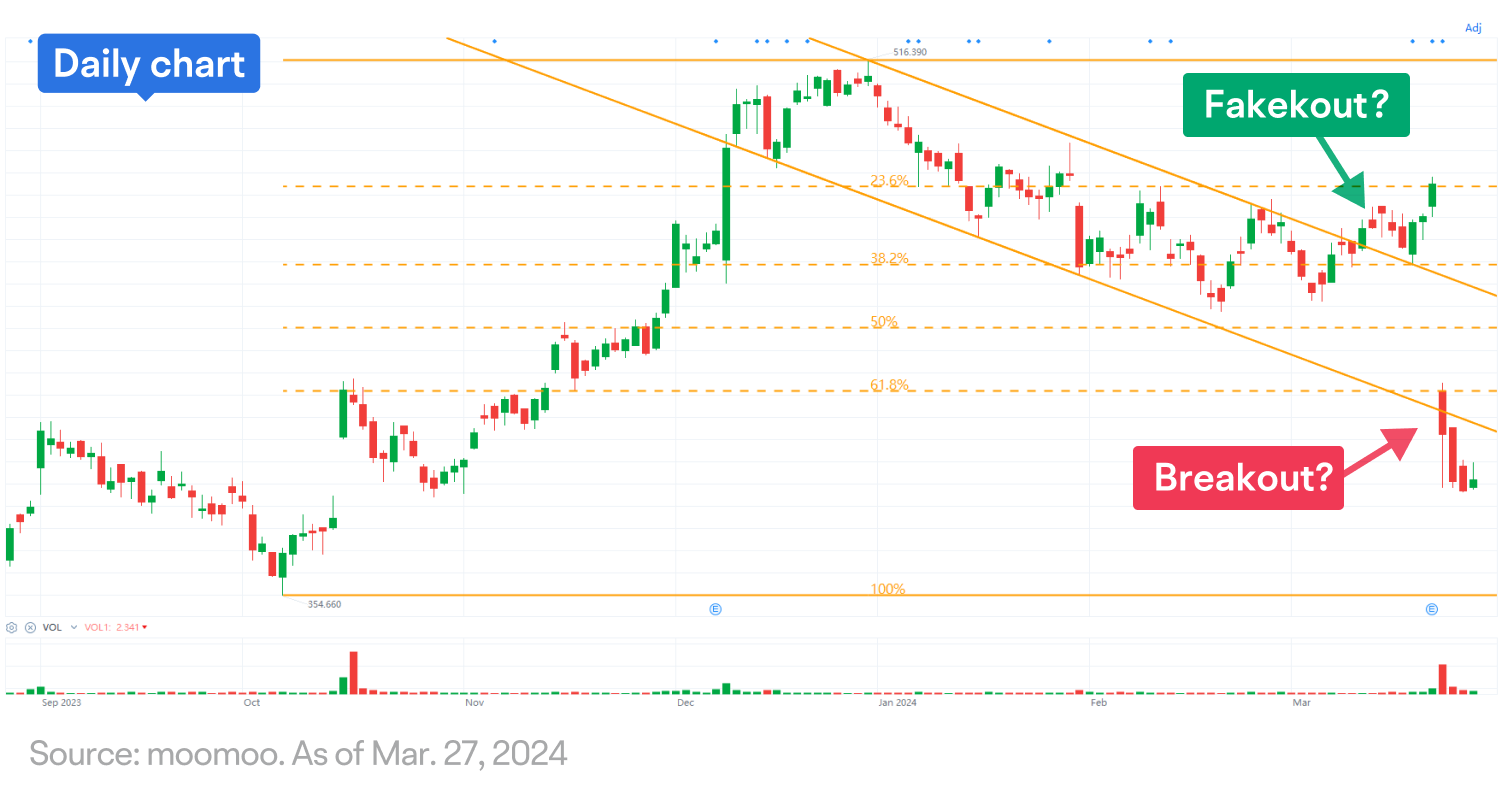
1. LULU experienced a notable increase in early October 2023, with prices surging by more than 40% within three months.
2. The stock pulled back in the following two months, retracing by less than 50% of the prior gains.
3. Prior to LULU’s Q4 earnings, a false breakout to the upside was observed, indicating the market’s anticipation of positive results of the company.
4. However, following the earnings report, LULU plummeted by 16%, forming a large price gap and signaling a continuation of the downtrend.
Technical indicators:
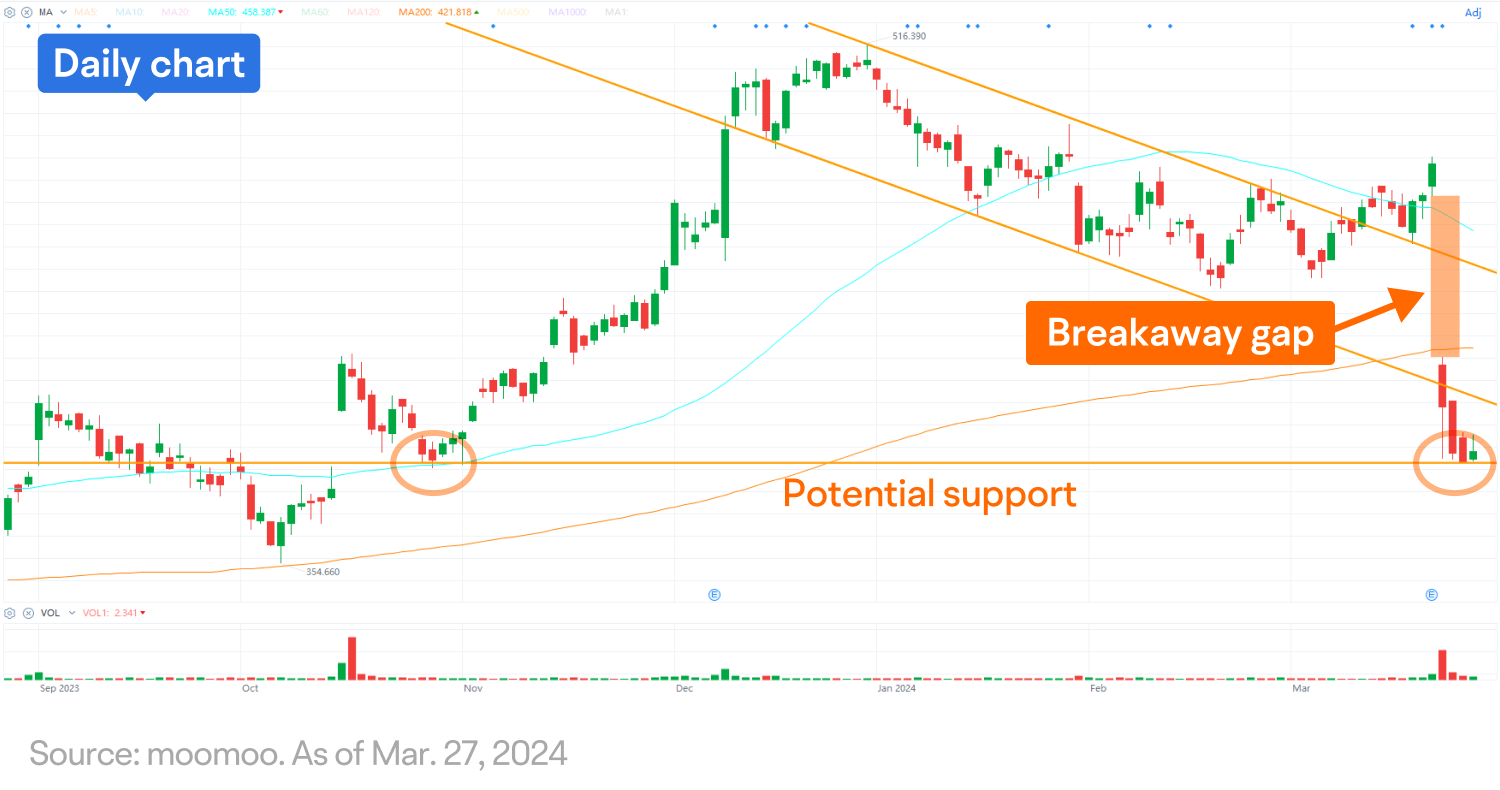
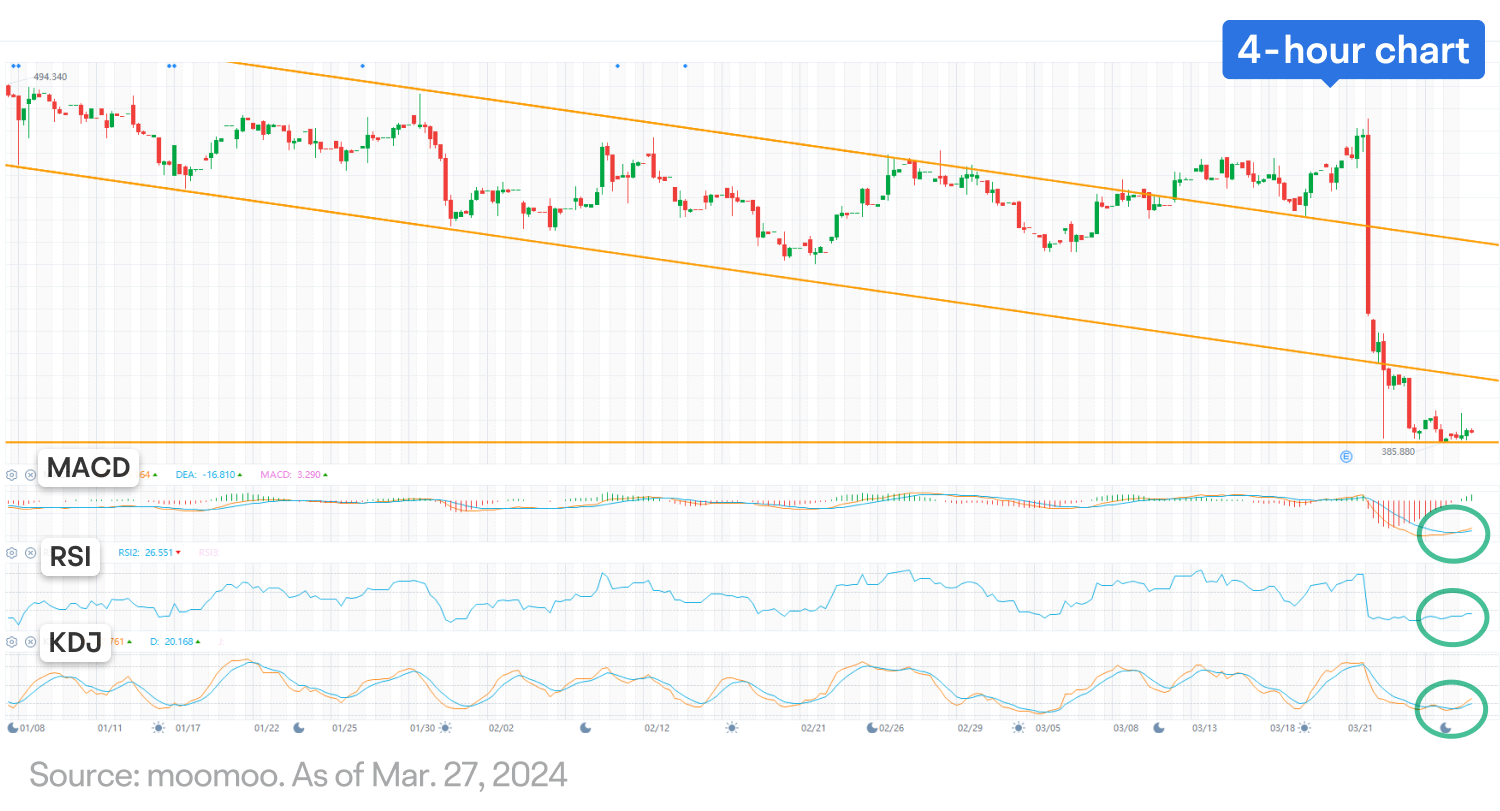
LULU held steady above the 200-day moving average (MA200) for more than nine months, but saw a sharp drop after the Q4 earnings report, hinting at a possible bearish trend in the medium term. Yet in the short term, the post-earnings sell-off has eased with lower trading volume, and the price appears to have found support near the $386 level.
Further analysis of the 4-hour chart reveals an oversold situation on the RSI and KDJ indicators, which could suggest a short-term price rebound is on the horizon. In addition, bullish technical signals such as the MACD bullish crossover have emerged.
Next move?
Looking ahead, the large price gap formed on the daily chart is considered a “breakaway gap”, which is not expected to be filled in the short term. While potential support might be found around $386, the 200-day moving average might act as potential resistance.
This presentation discusses technical analysis, other approaches, including fundamental analysis, may offer very different views. The examples provided are for illustrative purposes only and are not intended to be reflective of the results you can expect to achieve.
All investing involves risk, including the potential loss of principal, and there can be no guarantee that any investing strategy will be successful.
This presentation is for informational and educational use only and is not a recommendation or endorsement of any particular investment or investment strategy. Investment information provided in this content is general in nature, strictly for illustrative purposes, and may not be appropriate for all investors. Read more