Occidental Petroleum is trending downward. What to focus on? (05/08/2024)
Hello, everyone! This week, our spotlight is on Occidental Petroleum Corporation $Occidental Petroleum(OXY.US)$, a company that has received support from the billionaire investor Warren Buffett. We’ll explore the latest trends and take a close look at the company's recent market activity.
What’s new?
On May 7, 2024, Occidental Petroleum released its first-quarter earnings report, which revealed mixed results.
The company's Q1 earnings per share (EPS) fell by 42% to 63 cents, while its revenue dropped by 17% to $5.975 billion.
According to FactSet, analysts had expected the EPS to decline by 47% to 58 cents, with sales totaling $6.7 billion.
Occidental Petroleum stock remained relatively stable on Tuesday. However, the stock fell 5% last week to $64.39, dropping below its 50-day moving average.
Additionally, U.S. oil prices closed below $80 for the first time since March 8 this week, influenced by Middle East geopolitical risks, mixed signals about demand growth in China, and increasing U.S. inventories.
Recent filings show that Berkshire Hathaway's publicly traded portfolio is worth roughly $360 billion, with Occidental Petroleum being the sixth largest position, worth around $15 billion.
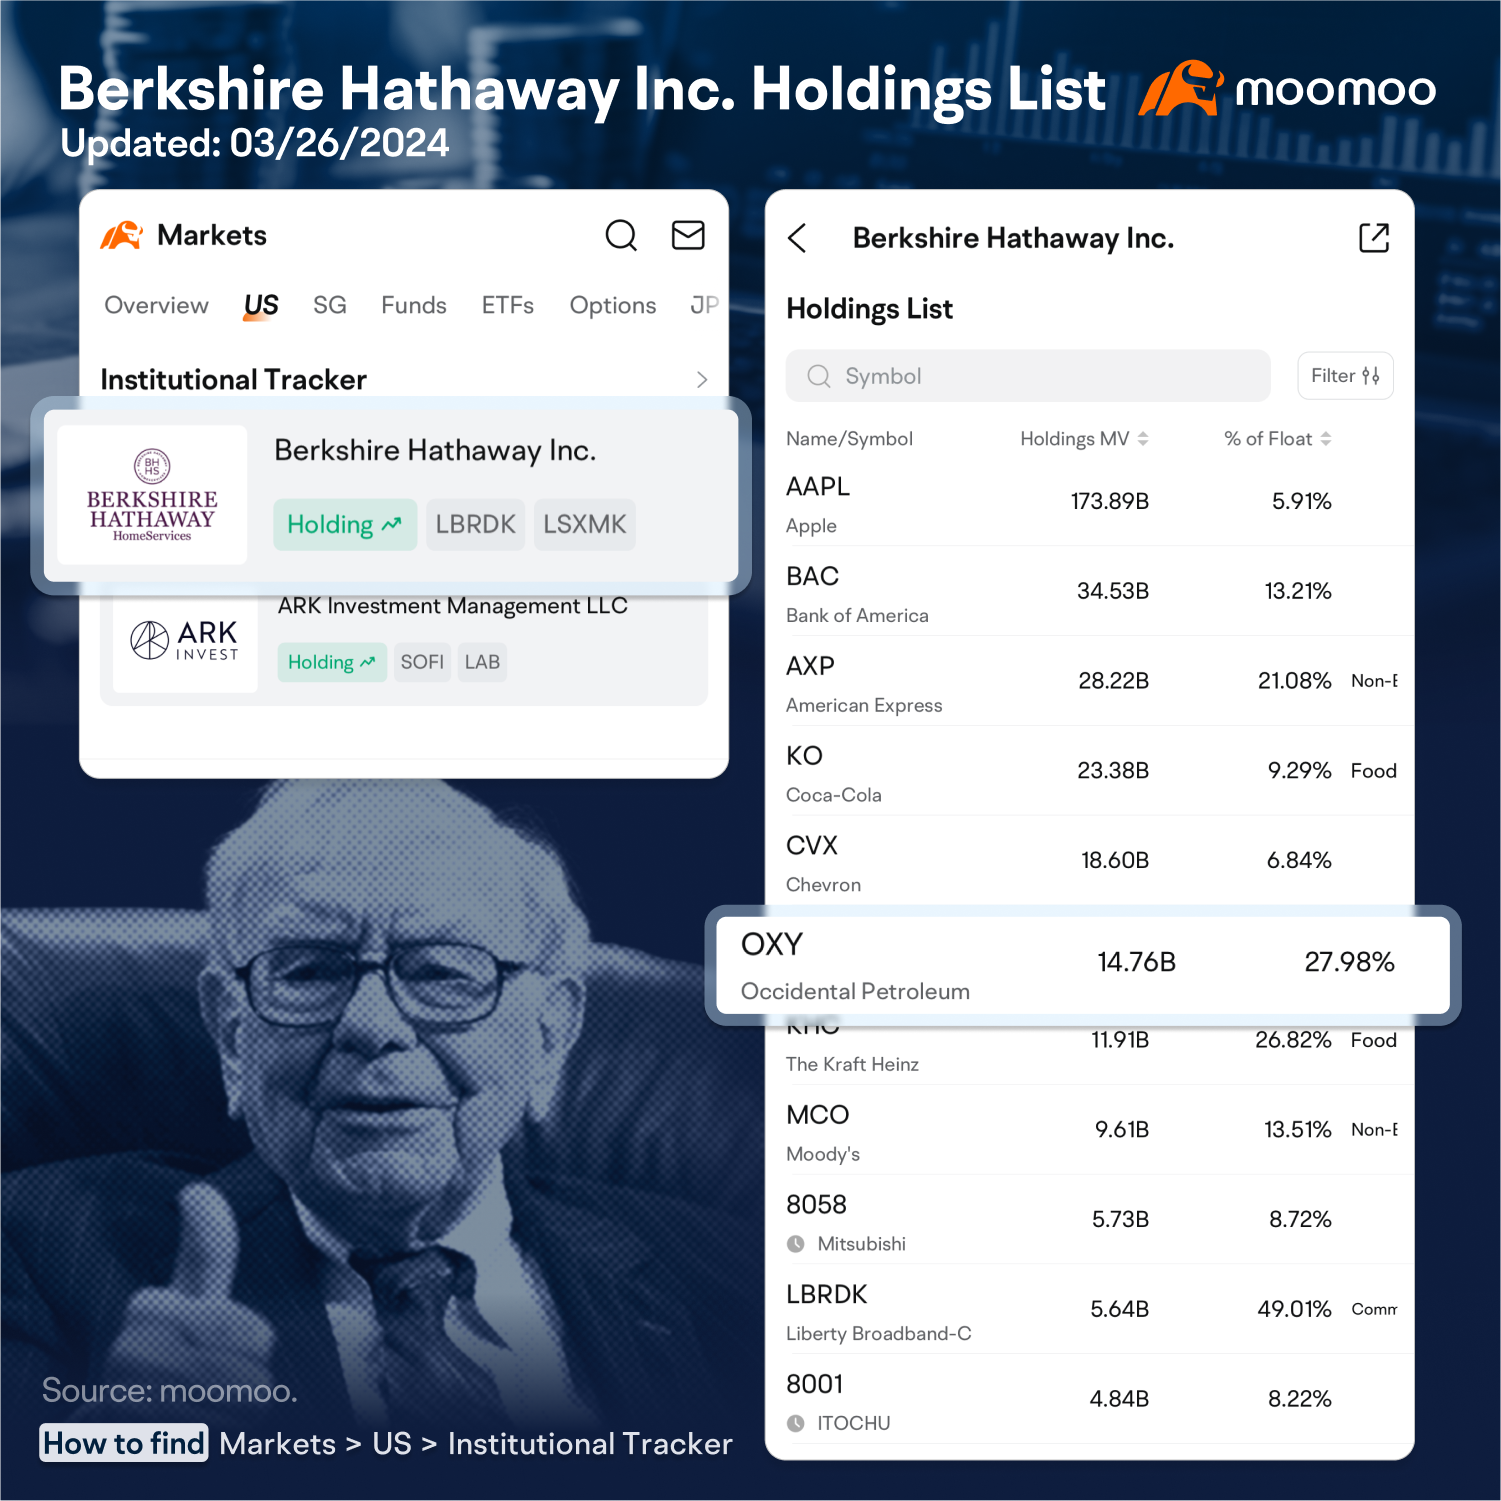
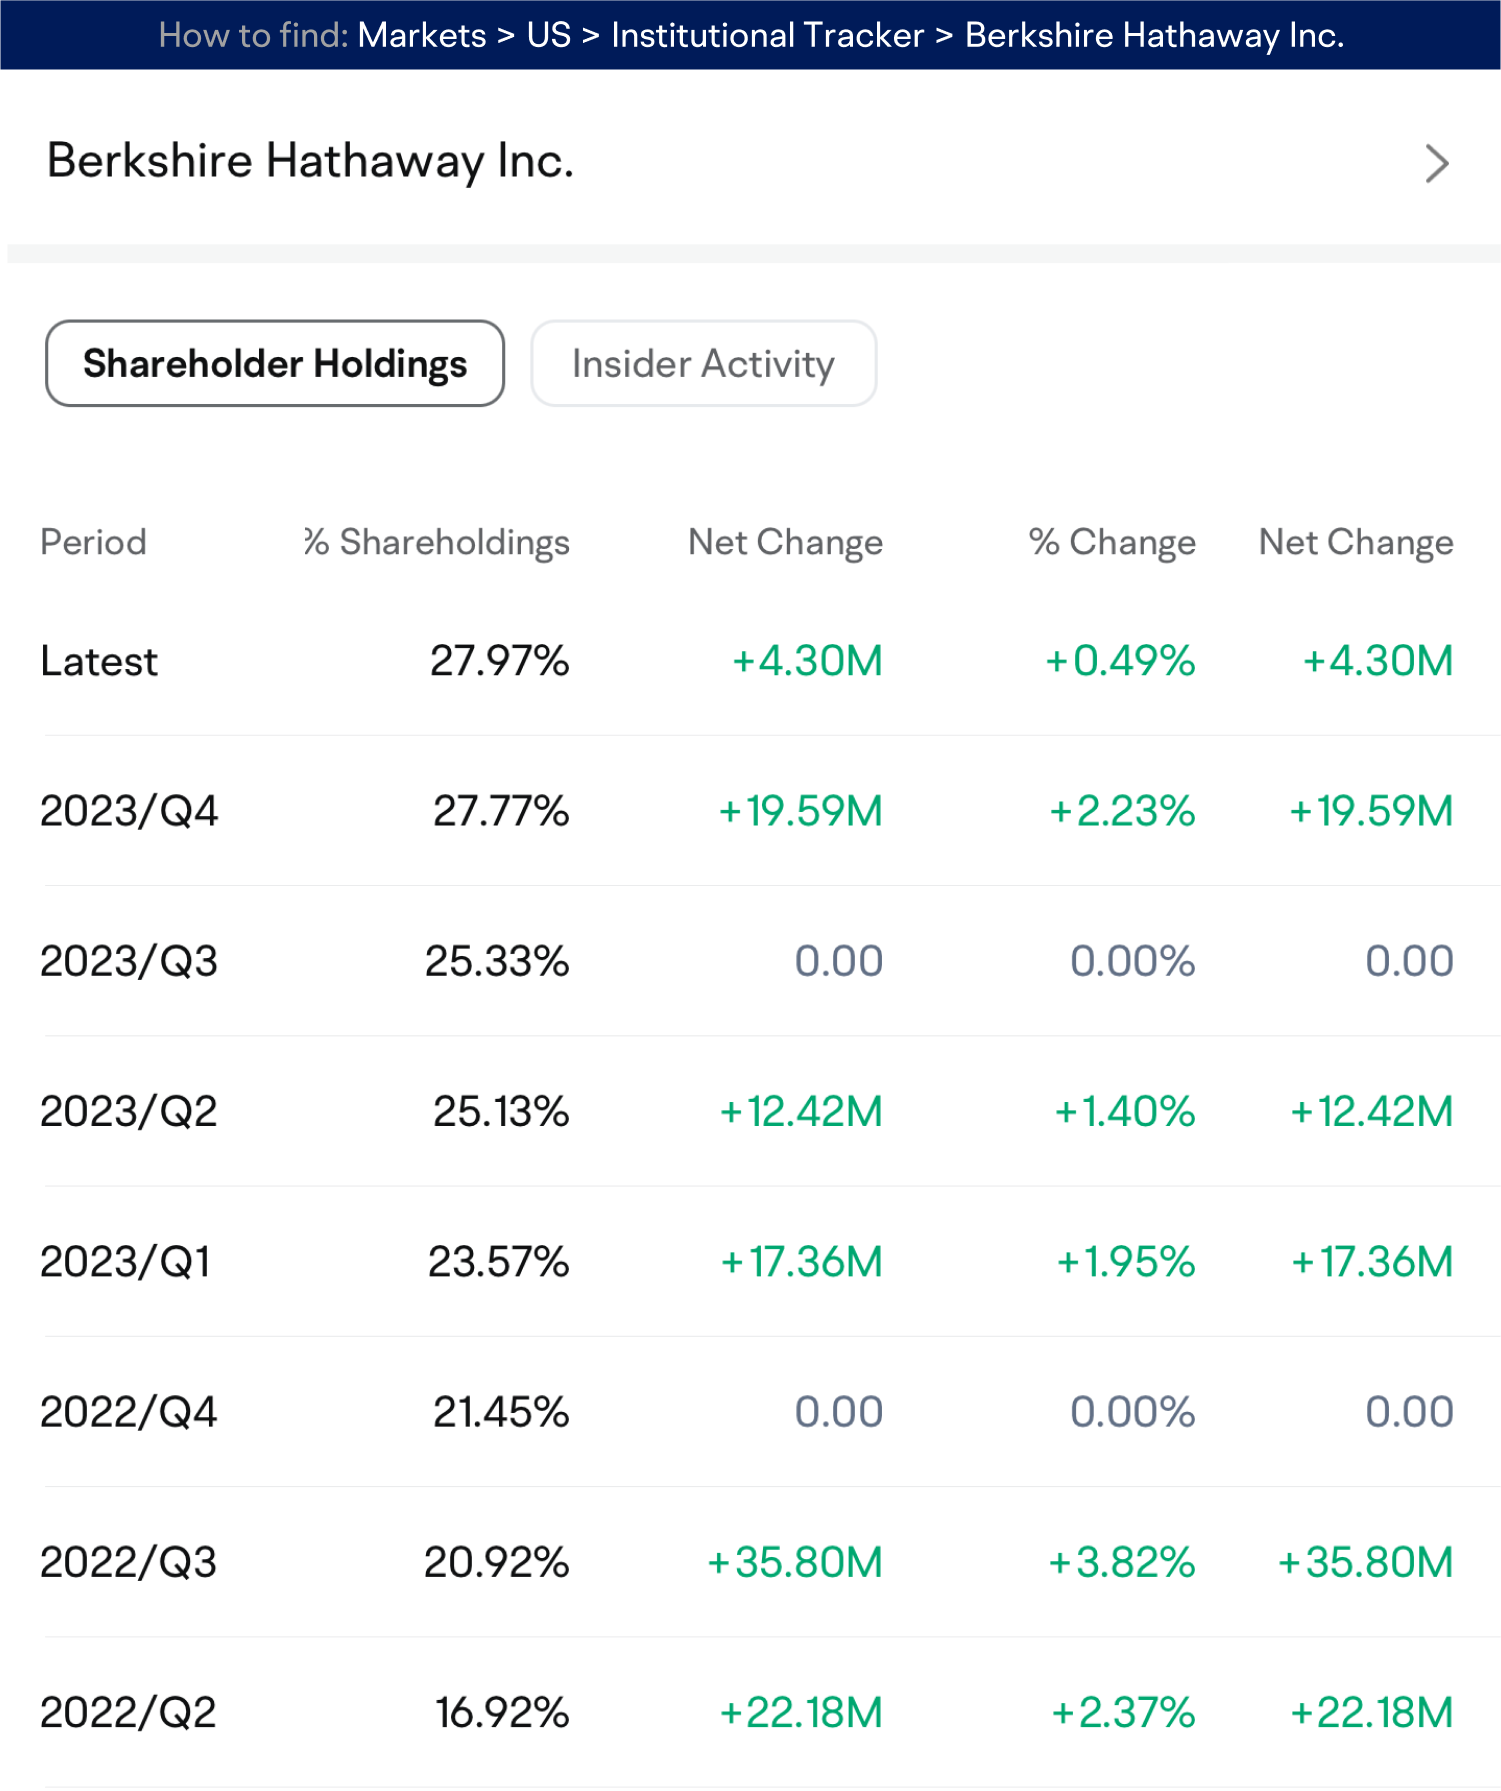
Berkshire first purchased Occidental Petroleum shares in the first quarter of 2022 when the company traded between $20 and $30 per share. Today, the share price is above $60, yet Berkshire remains heavily invested, with no share sales reported last quarter.
Occidental Petroleum and Chevron are the only oil and gas stocks owned by Buffett in this portfolio, together they represent approximately 10% of the portfolio's total value. It is evident that someone at Berkshire, perhaps even Buffett himself, has a strong belief in the potential of Occidental Petroleum stock.
Chart of the day
Trend analysis:
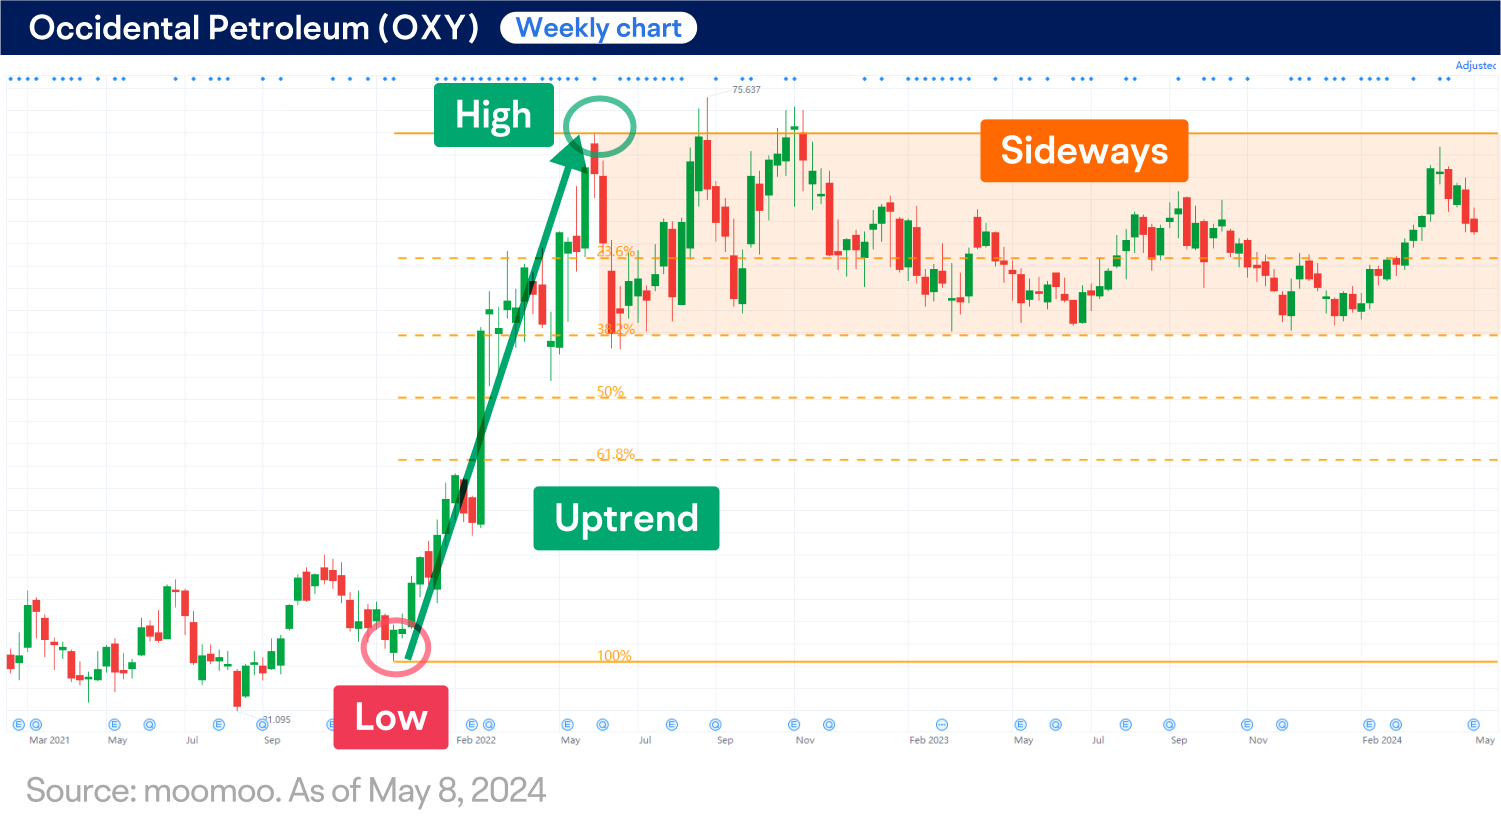
At the beginning of 2022, Occidental Petroleum (OXY) stock was in a robust uptrend, with the price surging approximately 150% within five months, as shown in the weekly chart above. Since then, the stock has mostly traded between $55 and $75.
It's worth noting that Berkshire Hathaway has substantially increased its stake in OXY over the past year, targeting shares in the $57-$61.50 price range.
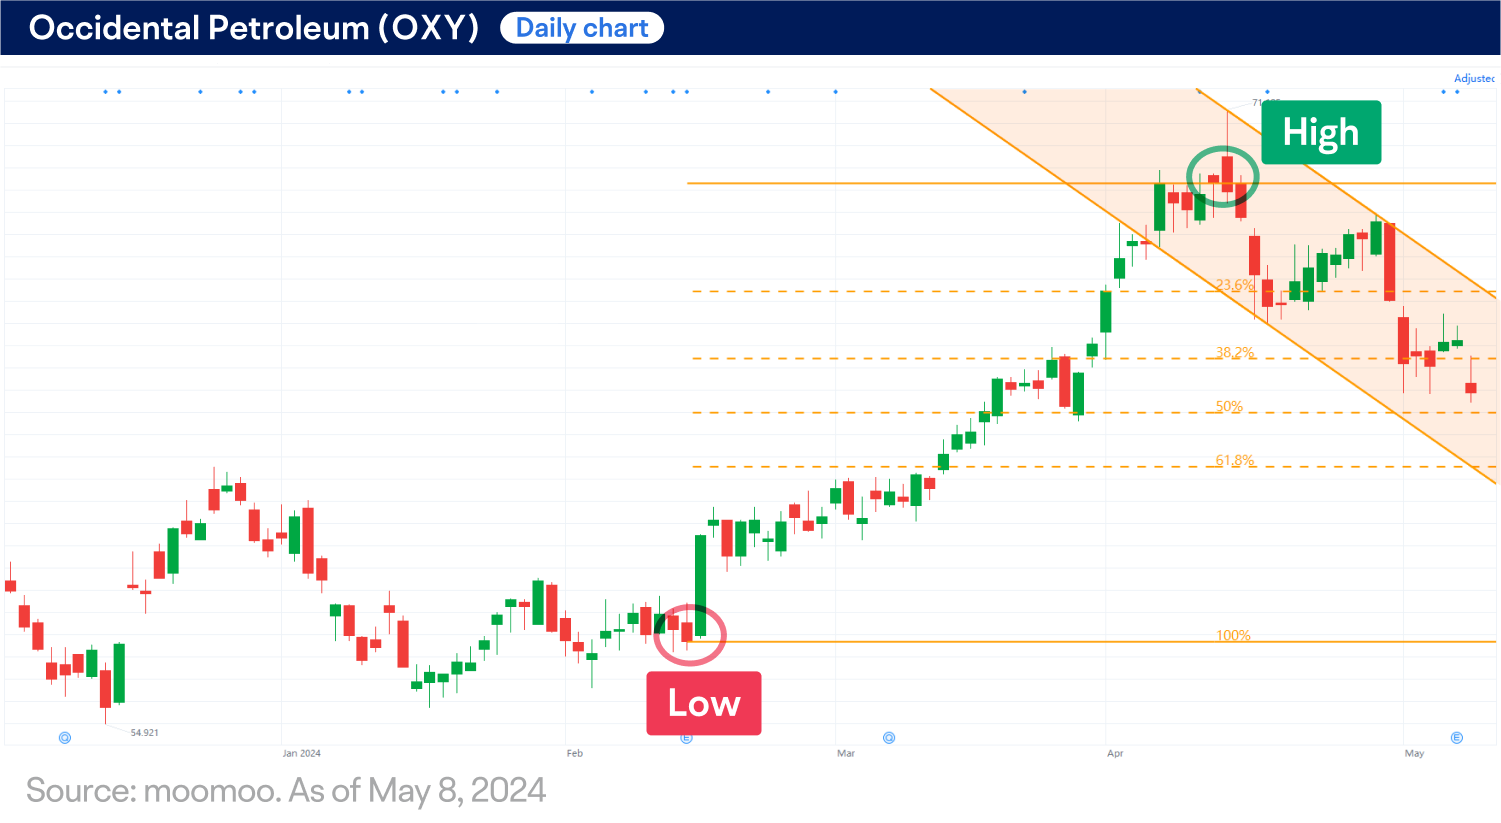
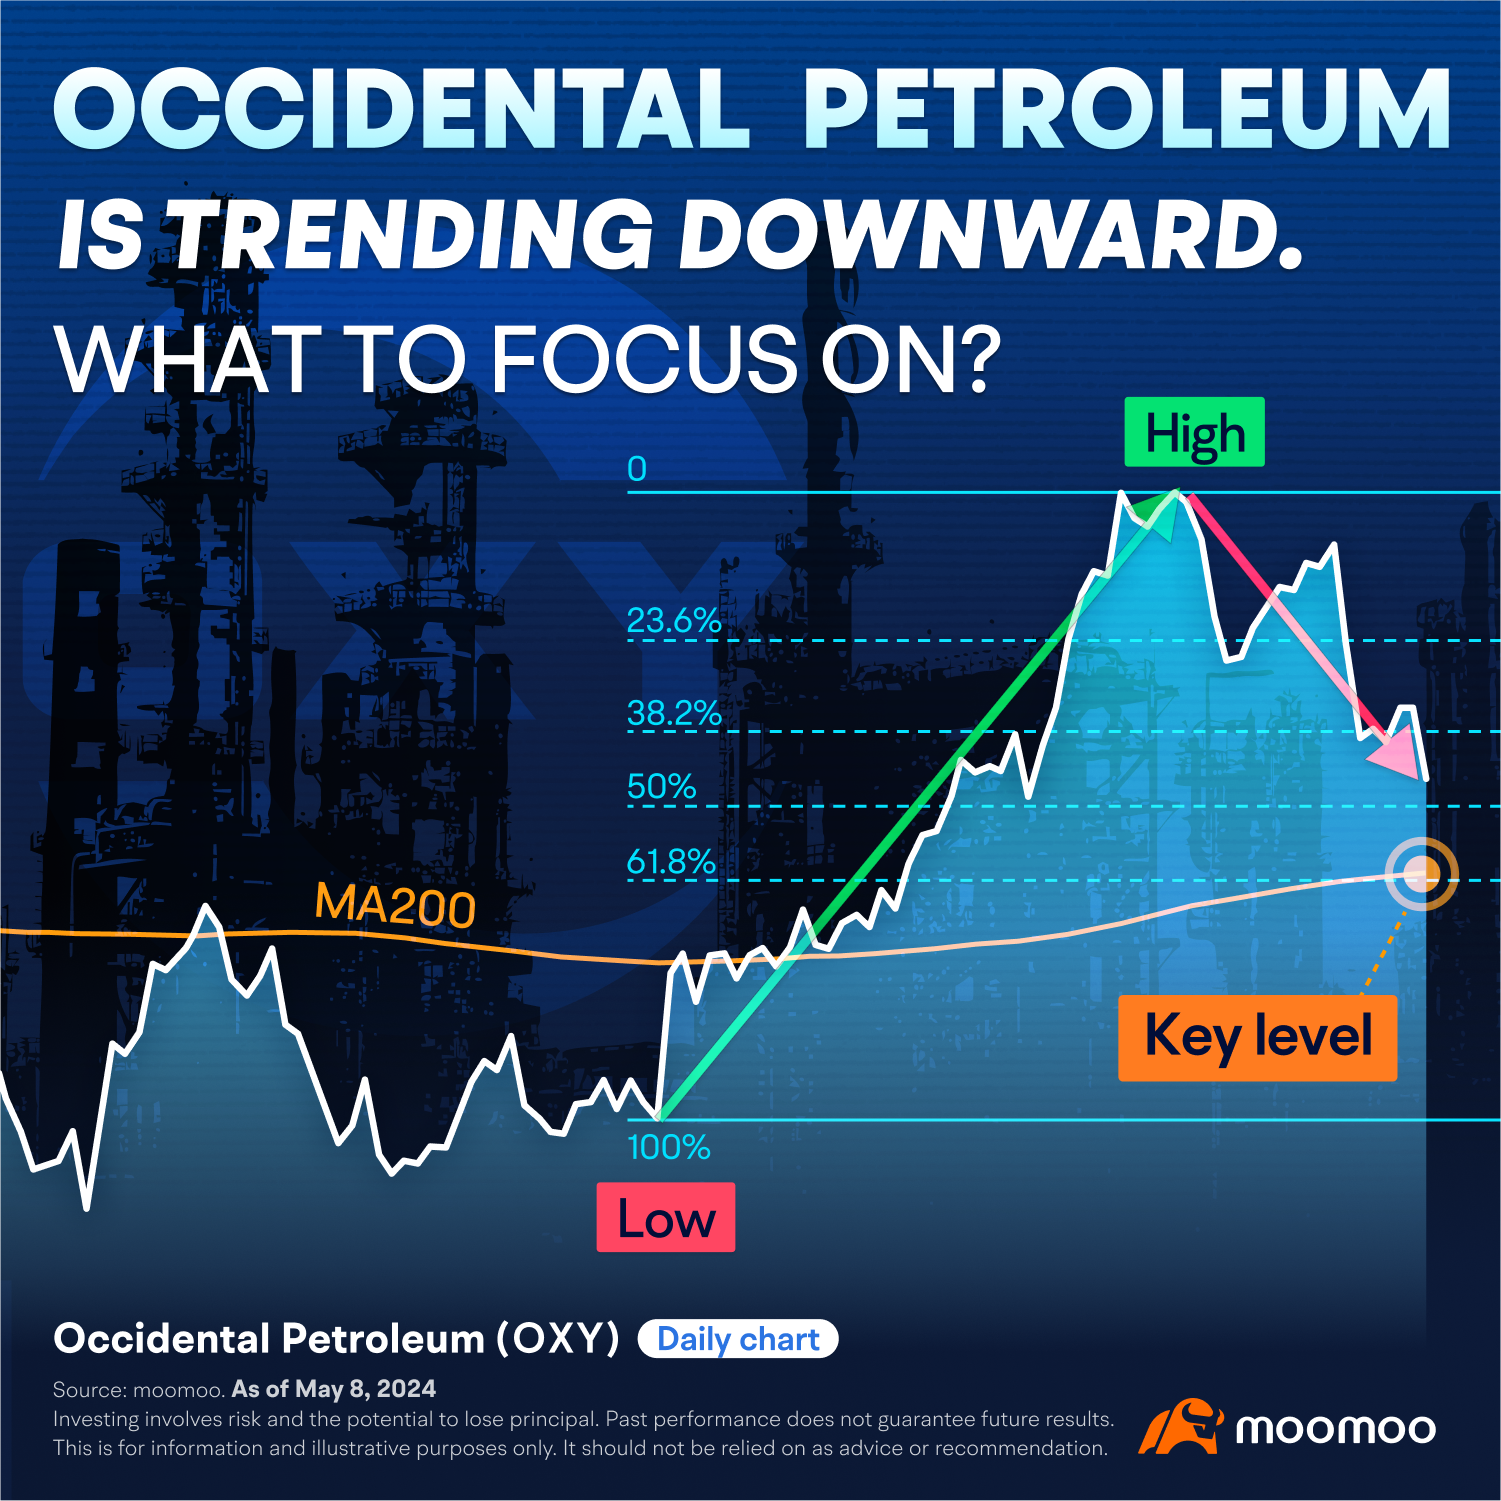
As for the daily chart, OXY has been trending upwards since mid-February 2024, with the price at one point rising above $70, which is the highest level seen in more than two years. However, the bulls failed to hold their ground, and the price pulled back nearly 50% of its prior gains. Currently, the price is trending downward within two parallel lines.
Technical indicators:
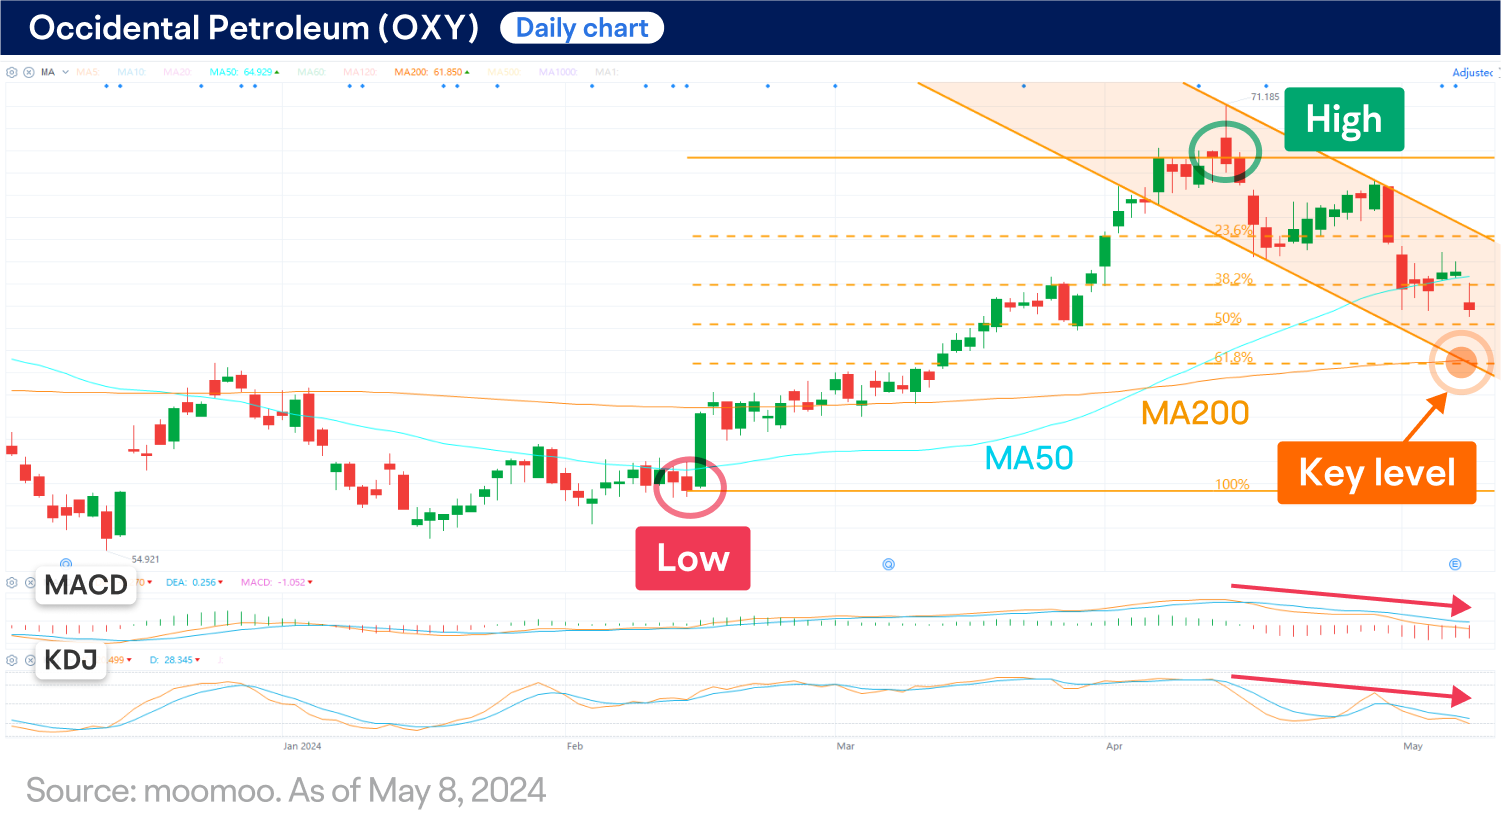
OXY has fallen below the 50-day moving average (MA50), indicating a potential short-term bearish market.
The moving average convergence/divergence (MACD) oscillator is below the zero line and trending downward.
The KDJ indicator is likely to move into the oversold territory (<20), but there’s no evident signal that a potential price rebound is about to happen in the short term.
The 200-day moving average (MA200) overlaps significantly with the key 61.8% Fibonacci retracement level, which may serve as potential support.
Next move?
OXY is currently trending downward within two parallel lines on the daily chart. Traders may want to keep an eye on the potential support of the MA200 as well as the key 61.8% Fibonacci retracement level, which is around $62. A potential breakout of this level is likely to signal a reversal of the prior uptrend.
This presentation discusses technical analysis, other approaches, including fundamental analysis, may offer very different views. The examples provided are for illustrative purposes only and are not intended to be reflective of the results you can expect to achieve.
All investing involves risk, including the potential loss of principal, and there can be no guarantee that any investing strategy will be successful.
This presentation is for informational and educational use only and is not a recommendation or endorsement of any particular investment or investment strategy. Investment information provided in this content is general in nature, strictly for illustrative purposes, and may not be appropriate for all investors. Read more