A complete guide to the Russell 2000 Index
When it comes to US stock market indices, investors typically think of three major ones: the S&P 500 Index, the Dow Jones Industrial Average (DJIA), and the NASDAQ Composite.
However, there is another index that many investors are highly interested in - the Russell 2000 Index.
In this article, we will discuss why this index is important, its constituent stocks, the characteristics of the index, and whether its structure could meet your investment objectives, and if so, ways to gain exposure to this index.
This article is for informational and educational use only and is not a recommendation or endorsement of any particular investment or investment strategy.
What is the Russell 2000 Index?
Before introducing the Russell 2000 Index, it is necessary to first understand what the Russell Index is.
The Russell Index is a series of US indexes launched by Frank Russell in 1984 to measure the US market and track the performance of large and small US stocks.
In the past, there was no strict distinction between "large, medium, and small stocks" based on their market value. FTSE Russell compiled three different indexes to allow investors to distinguish the recent differences in the performance of the three stock categories. The three different indexes are:
Russell 3000 Index: Tracking the performance of the 3000 largest US companies by market value. It includes large, medium, and small stocks, as well as some micro stocks. At present, this index represents nearly 98% of the investable US stock market by market value.
Russell 1000 Index: The top 1000 companies with the largest market value within the Russell 3000 Index are selected for inclusion in the Russell 1000 Index.
Russell 2000 Index: The bottom 2000 companies with the smallest market value within the Russell 3000 Index are selected in the Russell 2000 Index. The market value of the Russell 2000 Index only accounts for about 7% of the market value of the Russell 3000 Index.
Thus, the Russell 2000 Index is mainly used to track the performance of small US companies, reflecting the operating conditions of US small enterprises, and is frequently used as a benchmark for US investors to track the performance of small-cap stocks in the US stock market.
Features of the Russell 2000 Index
You may wonder what distinguishes the Russell 2000 Index from other mainstream market indices. There are three main characteristics:
1. Small-size and high-volatility companies
The Russell 2000 Index comprises companies with smaller market capitalizations, including many emerging growth companies. Compared with large companies, these companies tend to be more volatile. In other words, the Russell 2000 Index tends to fluctuate more than the broad market index, and therefore is relatively risky.
2. High growth potential
Although small-cap stocks tend to be more volatile, their growth potential is usually higher than that of large companies. To give a more general example, Apple (AAPL), the largest company by market value, may find it much more difficult to double its market value than a new technology company with a market value of $1 billion.
3. More diversified
The Russell 2000 index is more diversified compared to other major market indices because it includes 2,000 smaller companies. Firstly, it is less biased towards large companies and not overly reliant on the performance of a few big players. Moreover, it offers greater industry diversification without placing undue emphasis on any specific sector.
How does the Russell 2000 Index work?
Like the S&P 500 Index and the Nasdaq Composite Index, the Russell 2000 is a market capitalization-weighted index. This means that the larger the market value of the companies in the index, the greater their influence on the index.
However, to ensure that the index is fully representative of smaller companies, the composition of the Russell 2000 is updated annually.
Simply put, if a company's market value becomes too large, it will be removed from the Russell 2000 index and may be included in the Russell 1000 index.
This rule prevents the dominance of larger companies at the top of the index, which is currently seen in both the S&P 500 index and the Nasdaq Composite index.
The index adjustments are typically made between May and June each year.
Since many mutual fund managers and individual investors closely follow the Russell 2000 index, speculation about which companies will be included or removed from the index may cause significant short-term volatility in the stock prices of some companies.
Components of the Russell 2000 Index
Although the Russell 2000 Index is designed to track 2,000 small US companies, the actual number of constituent stocks may vary. Sometimes there are more than 2,000 constituent stocks, and sometimes there are fewer than 2,000.
This is because the Russell Index has a "No Replace Rule". This means that if any stock is excluded from the index for specific reasons, such as poor liquidity or merger, it will not be replaced by other stocks.
As of November 30, 2023, the Russell 2000 Index tracks the stocks of 1,967 small companies.
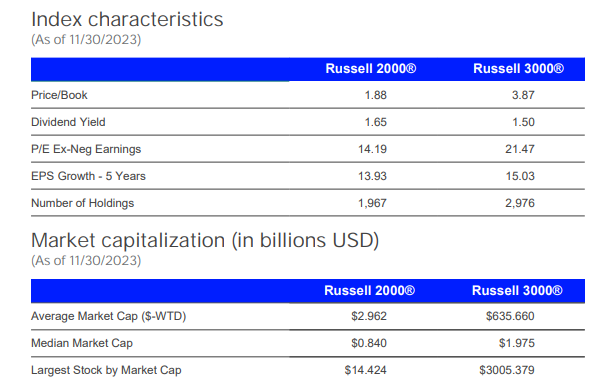
To better understand the attributes of the Russell 2000 Index, the constituent stocks in the index can be analyzed from the following three aspects:
1. Look at the top ten constituent stocks
As of December 26, 2023, the top ten constituent stocks of the Russell 2000 Index ranked by market value are as follows:
The first is Super Micro Computer (SMCI), with a market value of $16.35 billion. The tenth is cosmetics company e.l.f. Beauty (ELF), with a market value of nearly $8 billion.
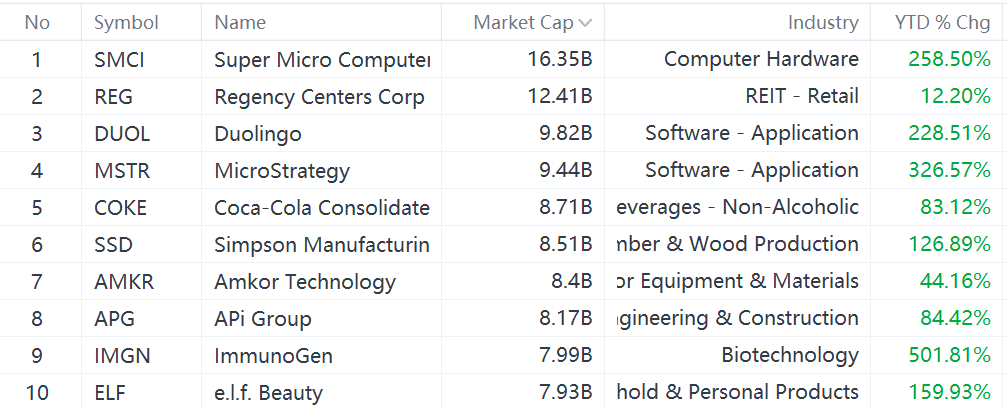
Source: moomoo. As of December 26, 2023. High, double and triple-digit returns are highly unusual and there should be no expectations that these can be sustained.
2. Look at industry distribution:
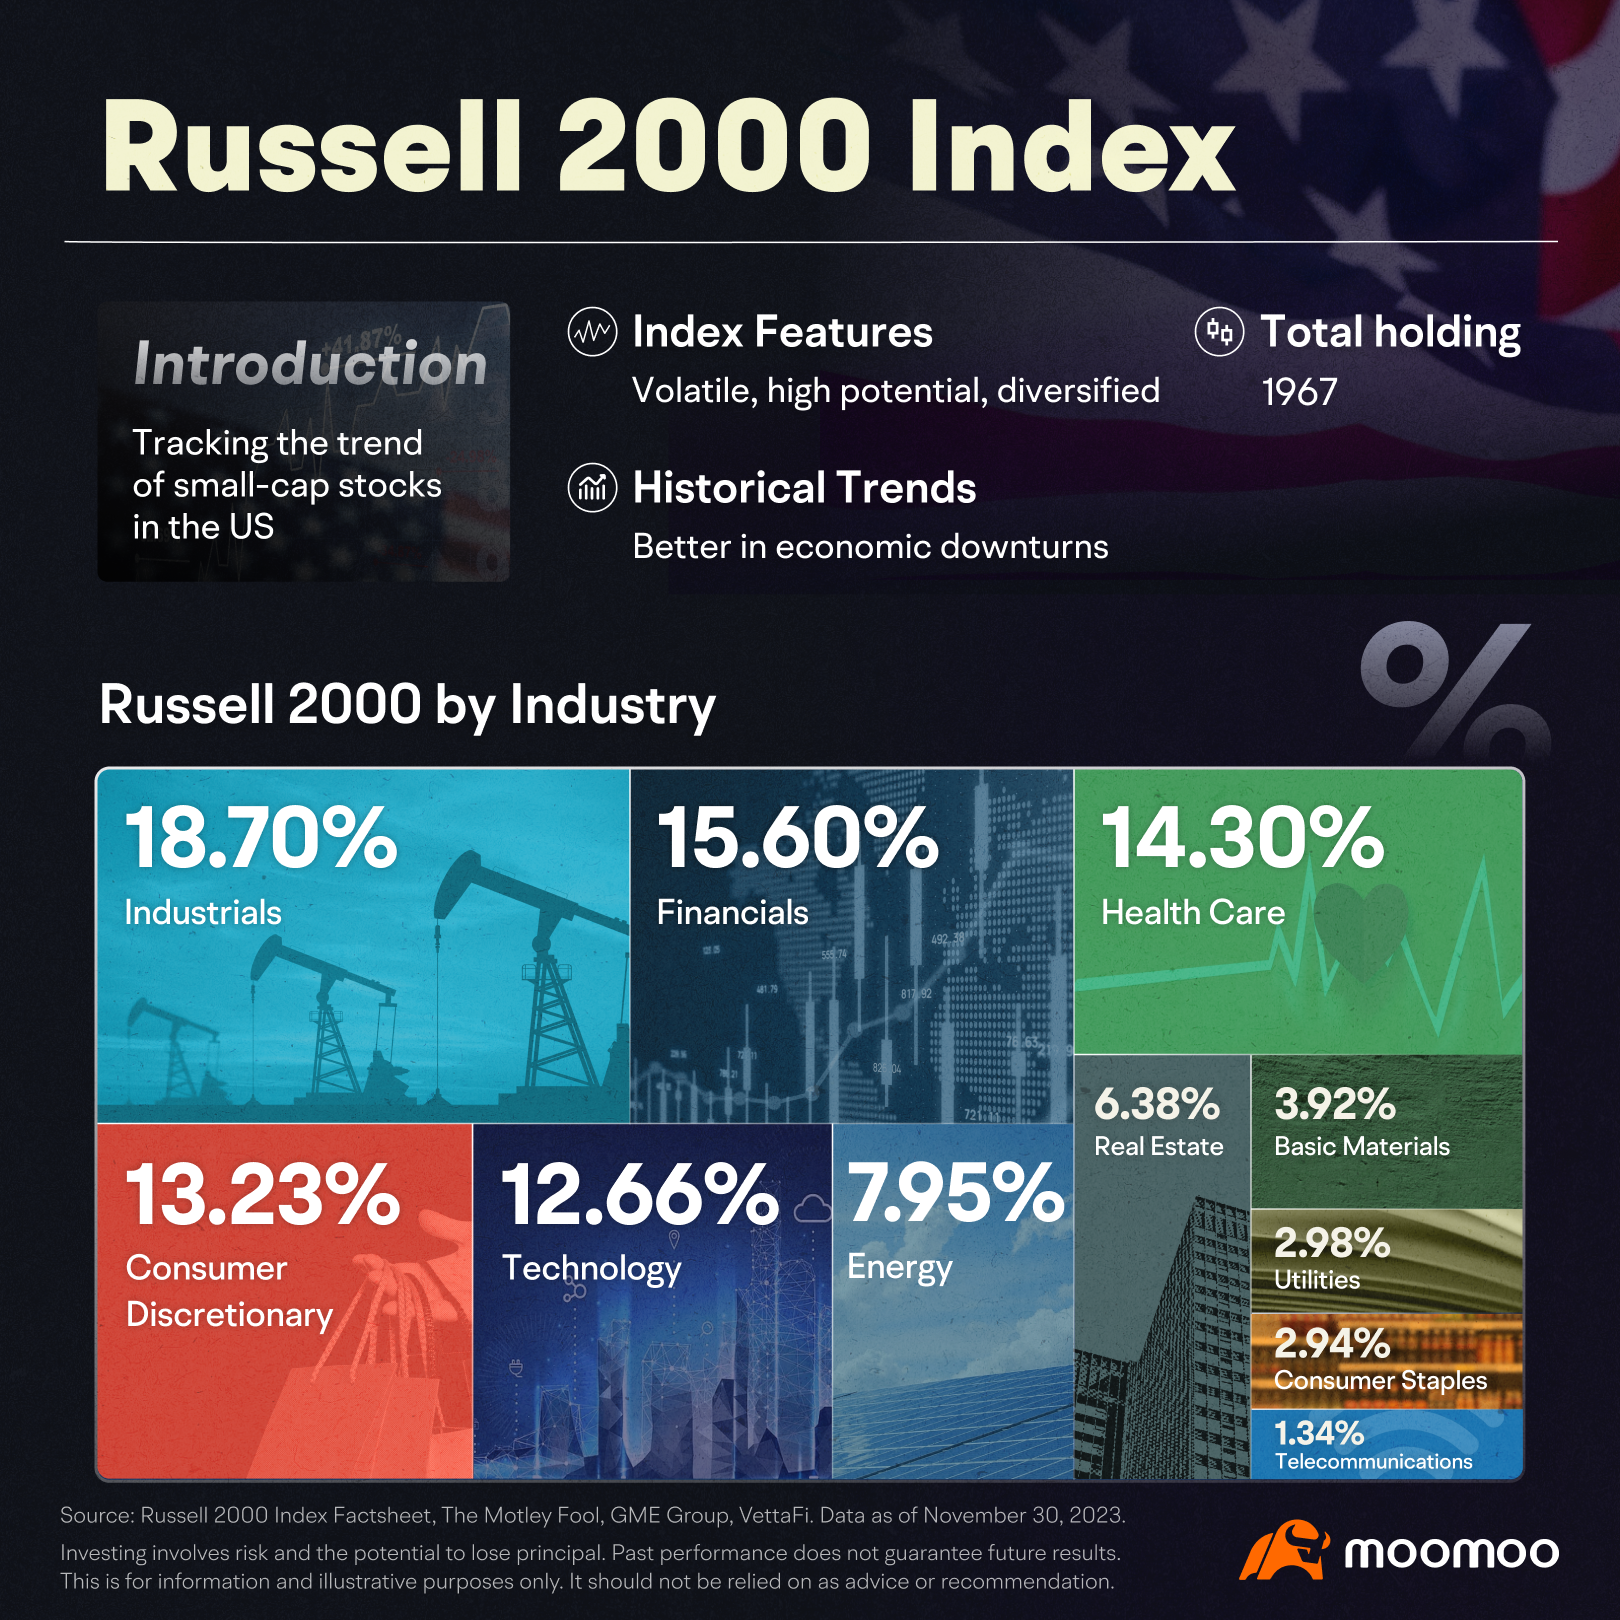
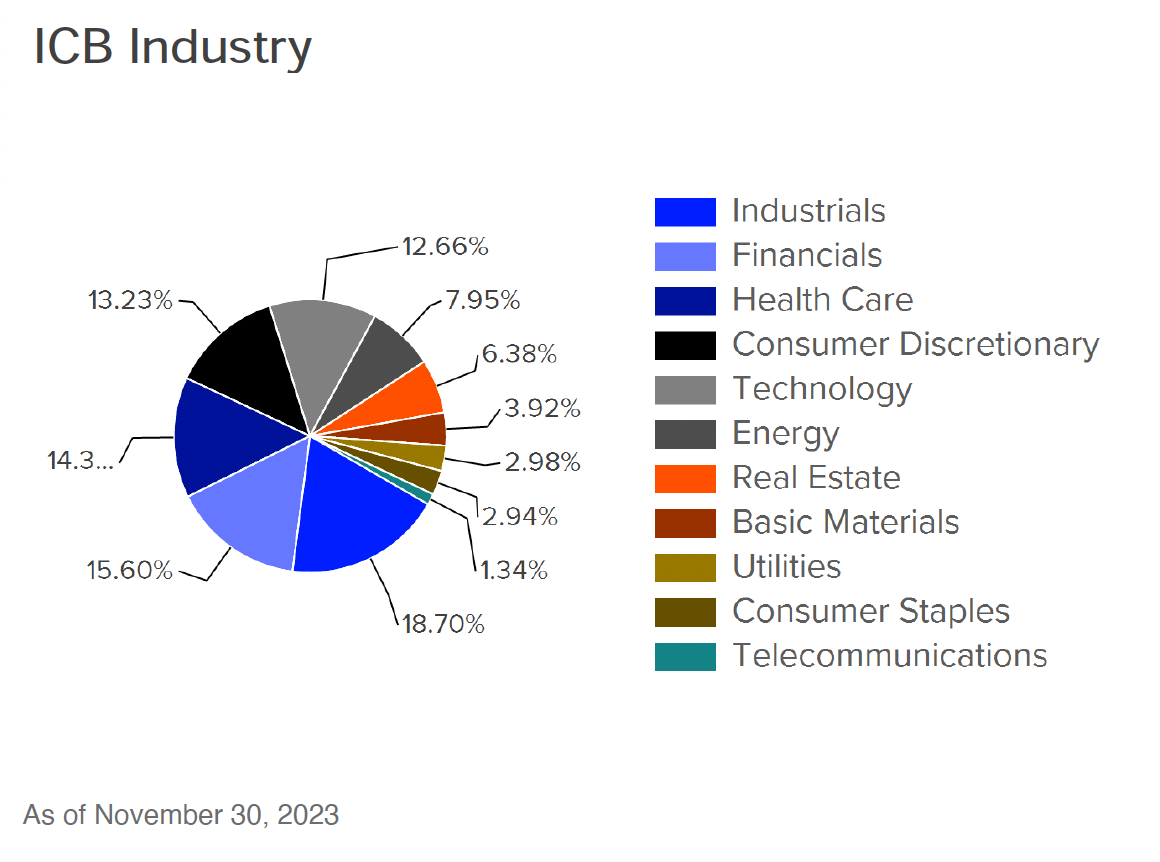
The Russell 2000 Index features a relatively even distribution of stocks across various industries.
As of November 30, 2023, industrials sector accounts for the highest proportion (18.7%) in the Russell 2000 Index, followed by Financials (15.6%), Health Care (14.3%), Consumer Discretionary (13.2%), and Technology (12.66%), with the Telecommunications sector accounting for the lowest proportion (1.34%).
This balanced distribution ensures that the index is less susceptible to fluctuations in any single industry, unlike indices such as the S&P 500 Index and Nasdaq Composite Index which have a higher concentration of technology stocks.
Therefore, when there are significant fluctuations in the technology industry, these indices tend to be more greatly affected compared to the Russell 2000 Index.
3. Growth vs. Value
Growth and value are two styles that companies in the Russell 2000 Index can be divided into based on their Price-to-book value ratio(P/B ratio), I/B/E/S (Institutional Brokers' Estimate System) forecast growth, and historical sales per share growth.
The index itself is split into the Russell 2000 Growth Index and the Russell 2000 Value Index, with different industries making up each one, while some stocks appear in both sub-indices.
As of November 30, 2023, there are 1073 constituent stocks in the Russell 2000 Growth Index, with the largest contributions from the Industrials, Health Care, and Technology sectors.
While there are 1432 constituent stocks in the Russell 2000 Value Index, with the largest contributions from the Financials, Industrials, and Consumer Discretionary sectors.
Therefore, if investors want a higher technology component in the index, the Russell 2000 Growth Index may be a better choice.
Over the past decade, the Russell 2000 Growth Index has had marginally higher returns than both the Value Index and the overall index.
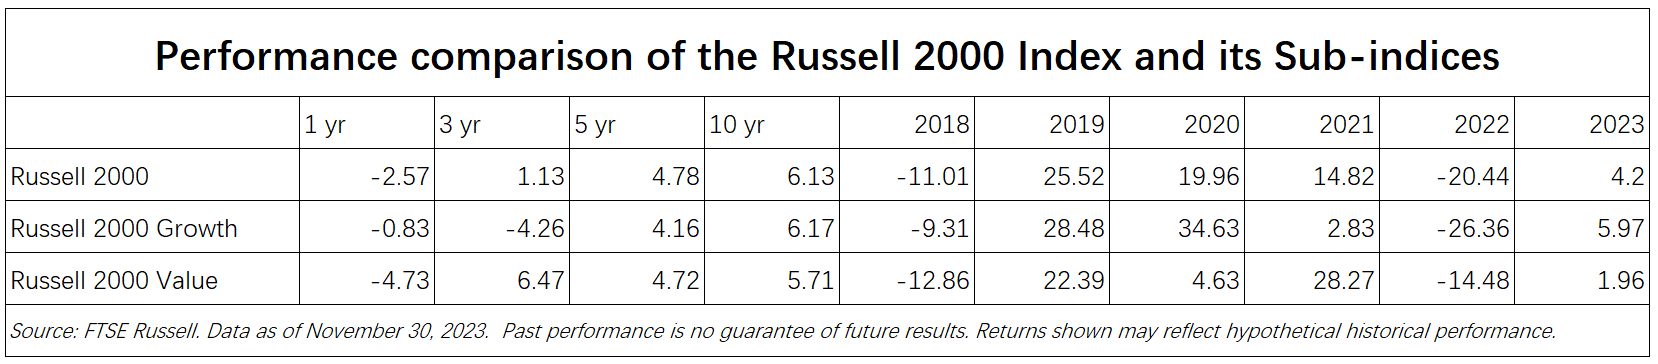
Historical Performance of The Russell 2000 Index
As mentioned earlier, it may be much harder for Apple to double its market value than for a new tech company with a market value of $1 billion, so many investors often have a subconscious feeling that small-cap stocks may outperform large-cap stocks.
However, for the index as a whole, does the return of the small-cap stock index necessarily outperform the large-cap stock index? The answer is not necessary.
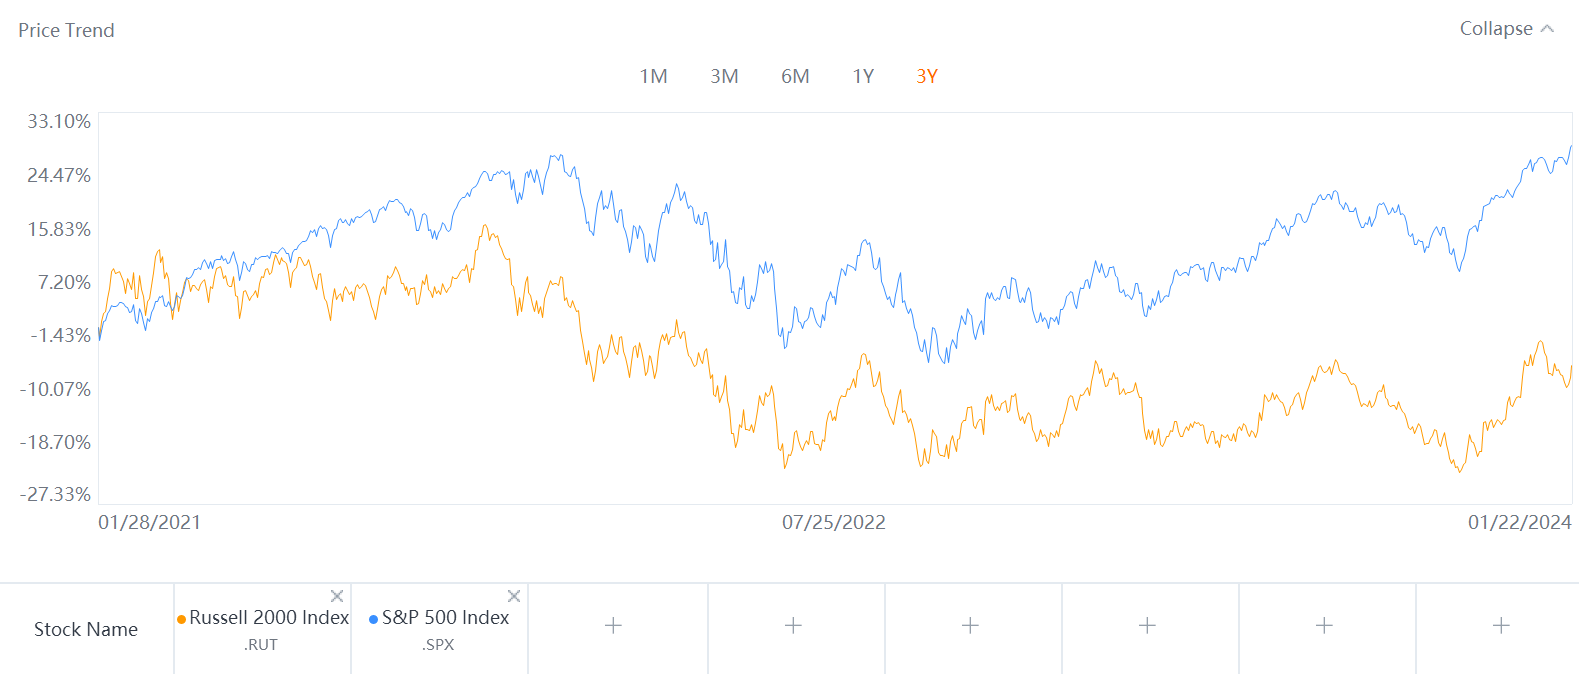
The following chart compares the Russell 2000 index and the S&P 500 index. As you can see, since the beginning of 2021, the Russell 2000 index has lagged behind the S&P 500 index significantly.
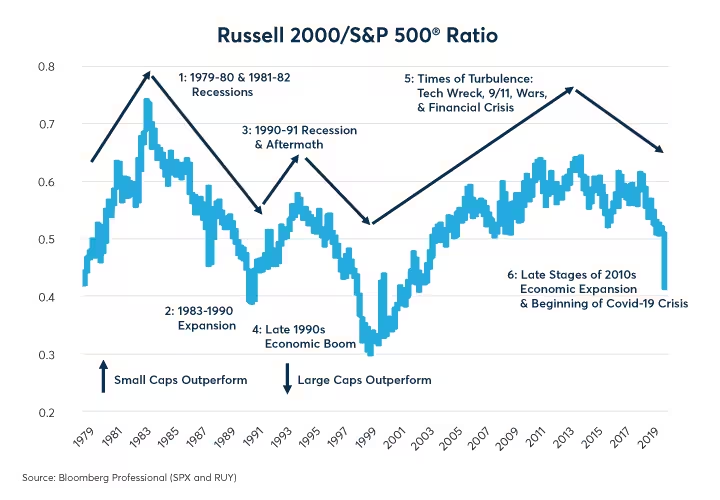
GME Group conducted a historical comparison of the Russell 2000 index and the S&P 500 index from 1979 to 2020, taking into account the economic environment in each period.
Surprisingly, they found that during economic downturns, the small-cap index often outperformed the S&P 500, while during economic booms or expansions, the large-cap index outperformed it.
Is the Russell 2000 Index suitable for your portfolio?
To answer this question, it's important to understand the cyclical nature, influencing factors, and potential risks of the Russell 2000 Index.
1. Cyclicality
Small businesses are more sensitive to economic and interest rate cycles due to their reliance on debt. During a recession, they may be more affected than large enterprises.
However, if the US experiences an economic downturn, interest rate cuts by the Federal Reserve can greatly reduce the burden on small businesses. Changes in economic and interest rate cycles have both advantages and disadvantages for small business operations.
However, historical trends suggest that during troubled times, the Russell 2000 index may perform better than large-cap stock indexes like the S&P 500. Of course, past trends do not represent the future, and there may be different trends in the future.
2. Influencing factors
Apart from economic and interest rate cycles, other factors such as valuation and profitability may also impact the Russell 2000 index.
Since October 2023, the index has outperformed the S&P 500 index (as of December 13, 2023), a report suggests that the comeback of small-cap stocks may be attributed to the following key drivers:
Lower concerns about interest rate hikes
Greater profit flexibility for small-cap stocks in a recovering economy
Attractive valuations of small-cap stocks relative to large-cap stocks
Increased demand for diversification among investors
Historical trends of rebounding after extreme downturns.
It can be seen that there may be many factors affecting the trend of the index in different environments. Market conditions are always changing, so investors should not rely on a single indicator to make judgments.
3. Potential risks
High volatility: The Russell 2000 index, consisting of many emerging growth companies, tends to be more volatile and less profitable compared to larger companies. Consequently, the index fluctuates more than the broader market index, resulting in relatively high risk.
A low proportion of the tech industry: The Russell 2000 index is relatively diversified with a focus on industries such as finance, healthcare, consumer discretionary, etc., but it has a lower representation of the technology sector compared to other large-cap stock indexes. Given that technology is currently one of the hottest sectors in the market encompassing areas like artificial intelligence, cloud computing, and semiconductors; if future investment trends continue favoring technology stocks, the Russell 2000 index may miss out on potential gains from this rising sector.
How to Invest in Russell 2000?
Like other indices, the Russell 2000 Index cannot be directly invested, and can only be used to observe the trend of the market.
However, investors can obtain similar levels of returns by buying funds or ETFs that track the index.
It is worth noting that these ETFs track the Russell 2000 Index, so they will also inherit the characteristics of the index. This includes experiencing significant fluctuations in the index and having a relatively dispersed distribution across industries.
Therefore, investors should consider their investment objectives and risk tolerance when making investment decisions and implementing risk management measures.
Summary
The Russell 2000 Index tracks the performance of small-cap stocks and is compiled from the smallest 2000 stocks in the Russell 3000 Index.
Being market capitalization-weighted, the Russell 2000 Index gives more influence to companies with larger market values, but it ensures the representation of small companies by updating its constituent stocks annually.
Compared to other broad market indices, the Russell 2000 Index is characterized by its high volatility, potential for growth, and diversified industry distribution.
Historically, during economic downturns, the Russell 2000 Index outperformed the S&P 500 index.
Investors can achieve similar returns by investing in funds or ETFs that mirror the Russell 2000 Index, while also employing appropriate risk management strategies.
Additional disclaimer:
Important Information: Before investing in an ETF, you should read both its summary prospectus and its full prospectus, which provide detailed information on the ETF’s investment objective, principal investment strategies, risks, costs, and historical performance (if any). You can find prospectuses on the websites of the financial firms that sponsor a particular ETF, as well as through your broker.
A Word About Risk: Investment returns will fluctuate and are subject to market volatility, so that an investor's shares, when redeemed or sold, may be worth more or less than their original cost. ETFs are subject to market volatility and the risks of their underlying securities, which may include the risks associated with investing in smaller companies, international securities, commodities, fixed income, and more. An ETF may trade at a premium or discount to its net asset value (NAV).
This presentation is for informational and educational use only and is not a recommendation or endorsement of any particular investment or investment strategy. Investment information provided in this content is general in nature, strictly for illustrative purposes, and may not be appropriate for all investors. Read more