Visa faces rare miss on top-line: What comes next? (07/24/2024)

Hello, everyone! Today is July 24, 2024, and we will be focusing on Visa Inc. $Visa (V.US)$ , the world’s largest payments processor. In this article, we’ll explore the latest trends and take a close look at the company’s recent market activity.
What’s new?
On July 24, 2024, Visa’s shares experienced a significant decline of 4%, marking the largest daily drop in over two years. The decline was attributed to the company’s showing of a slight slowdown in volumes during its fiscal third quarter ended June 30.
Although the company’s quarterly net revenue increased to $8.90 billion from $8.12 billion a year before, it fell slightly below analysts’ expectations of $8.92 billion. This was Visa’s first earnings miss since early 2020. Additionally, Visa’s adjusted earnings of $2.42 per share for the quarter were in line with expectations.
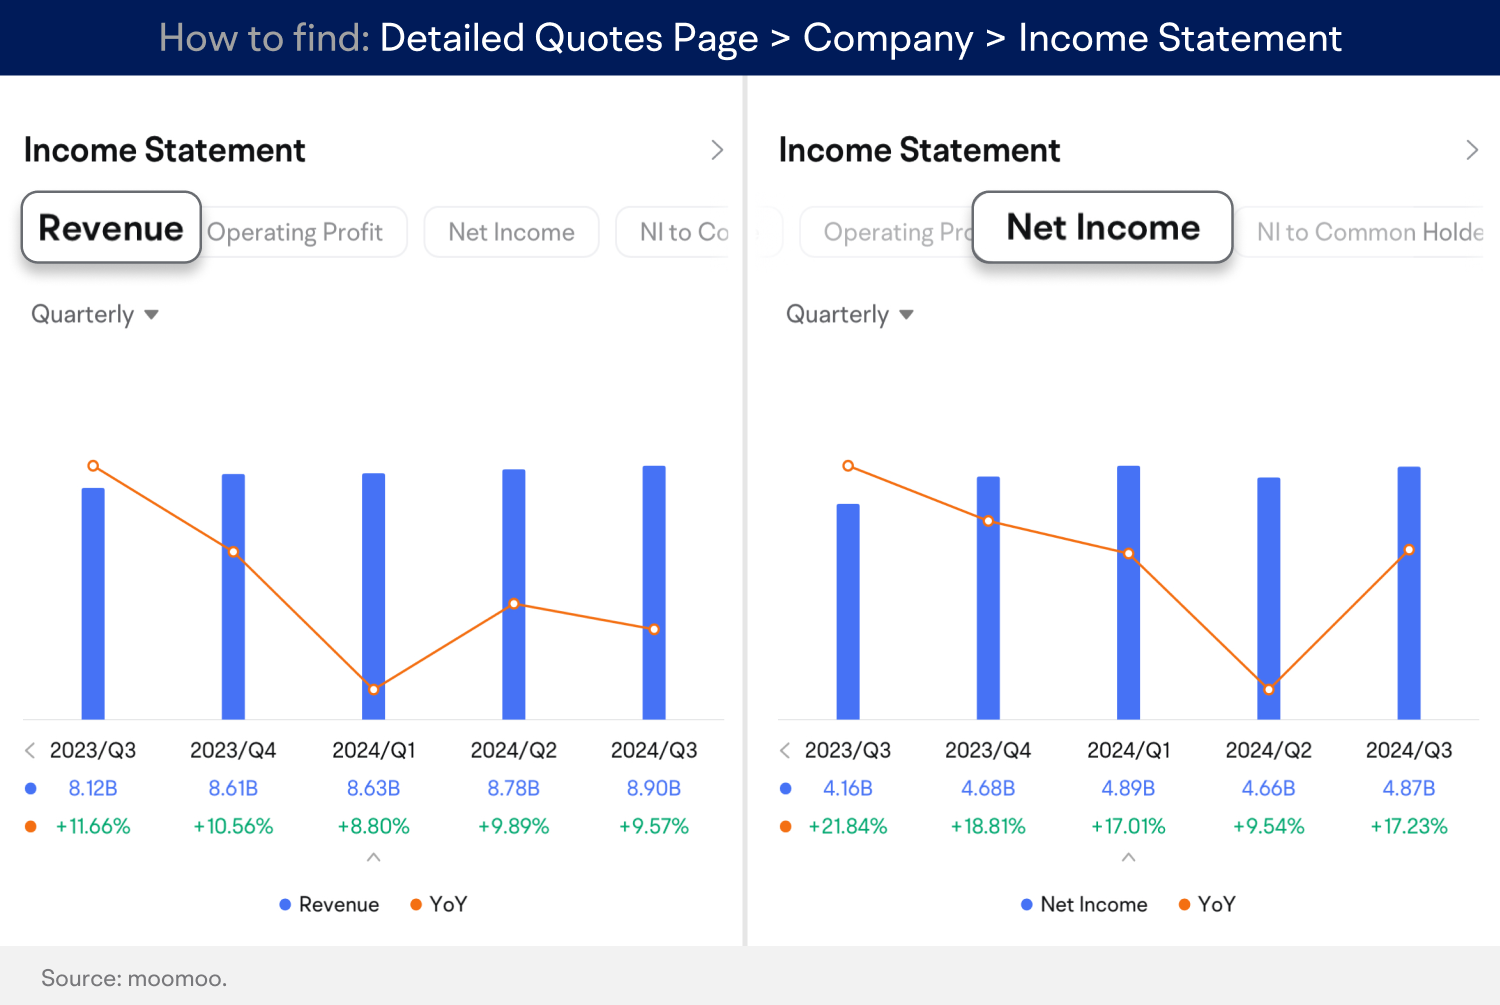
Payment volume growth in the Asia-Pacific market has slowed due to China's macroeconomic conditions, impacting post-pandemic travel recovery in the region. In the US, the Federal Reserve's measures to curb inflation have resulted in the highest interest rates since the 2008 financial crisis, straining the budgets of lower-income Americans living paycheck to paycheck.
Visa expects net revenue growth to be in the “low double-digit” percentages for the fiscal fourth quarter ending on September 30, compared to 10.6% reported last year. The company also reaffirmed its annual profit and revenue growth forecasts.
It’s worth noting that Visa’s shares have been underperforming this year and were in the red as of July 24, 2024, while the S&P 500 index has risen by approximately 14% during the same period. Historically, the company has only underperformed the S&P 500 in three calendar years since 2009. The question remains whether Visa’s shares will rebound and return to their usual pattern of outperforming.
Chart of the day
Trend analysis:
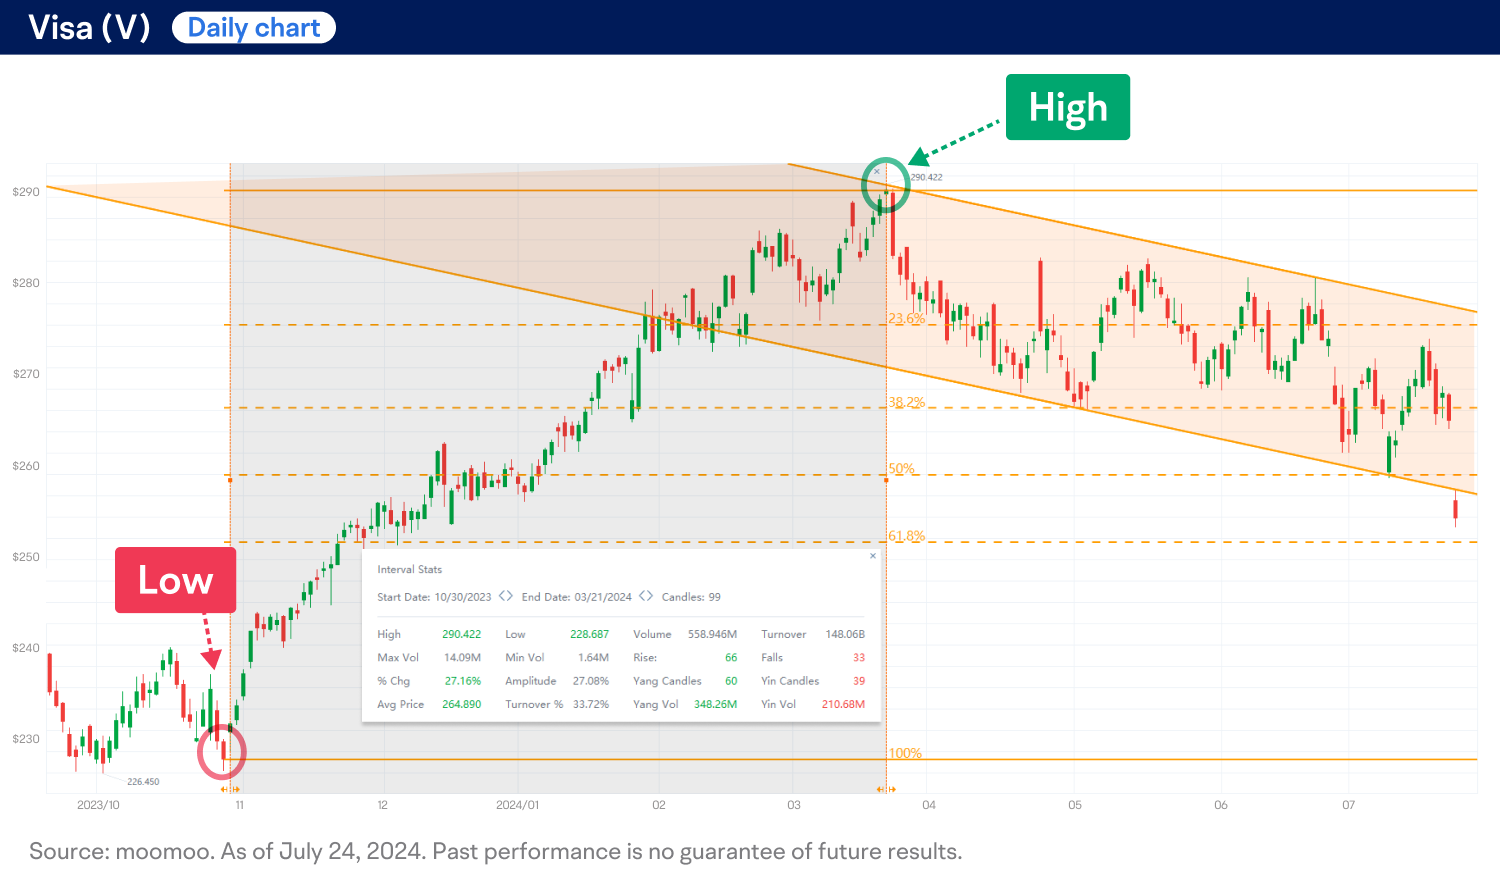
Visa’s shares $Visa (V.US)$ experienced an uptrend from late October 2023, with the price increasing by 27% within five months, as illustrated in the daily chart above. However, since then, the stock has moved in a descending channel and retraced over 50% of its prior gains, as shown on the Fibonacci retracement tool.
Technical indicators:
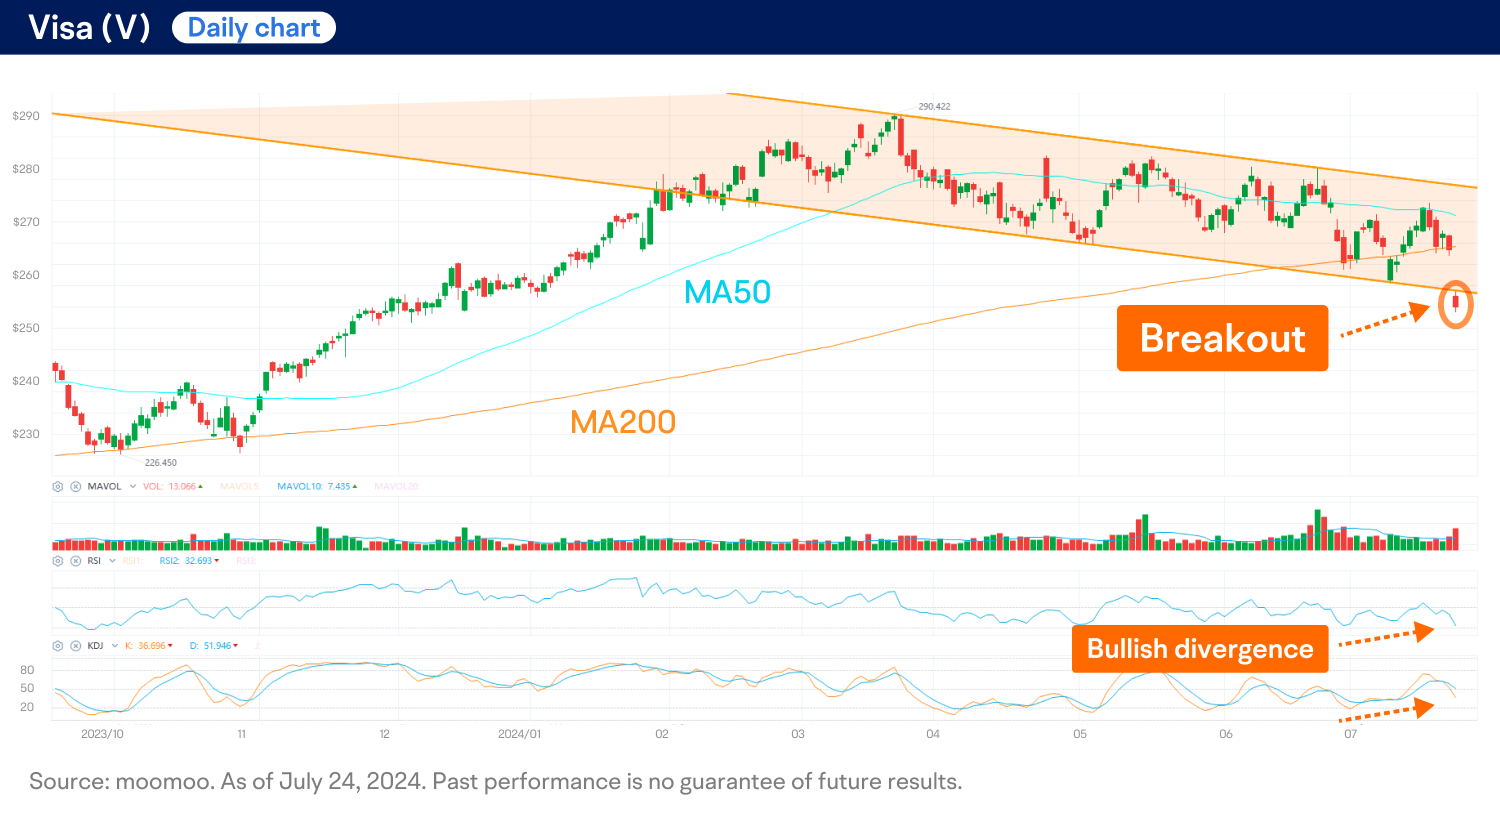
● $Visa (V.US)$ is currently trading below its major moving averages (MAs), such as the 50-day MA and 200-day MA, indicating a bearish market trend.
● After a 4% decline on July 24, the stock broke out of the descending channel with a spike in trading volume, suggesting a bearish market sentiment.
● Although the relative strength index (RSI) and the KDJ indicator had previously shown bullish divergence, they have now fallen below 50, indicating a continuation of the bearish trend.
Next move?
It’s obvious that Visa’s shares are currently displaying short-term bearish sentiment after breaking below the descending channel in the daily chart.
Traders may keep a close eye on the potential support around the key 61.8% Fibonacci retracement level. A break below this level could signal a bear market instead of just a price retracement.
This presentation discusses technical analysis, other approaches, including fundamental analysis, may offer very different views. The examples provided are for illustrative purposes only and are not intended to be reflective of the results you can expect to achieve.
All investing involves risk, including the potential loss of principal, and there can be no guarantee that any investing strategy will be successful.
This presentation is for informational and educational use only and is not a recommendation or endorsement of any particular investment or investment strategy. Investment information provided in this content is general in nature, strictly for illustrative purposes, and may not be appropriate for all investors. Read more