Walmart's Divestment from JD.com: What it Means for Investors? (08/21/2024)

Hello, everyone! This week, let's shift our focus to $JD.com (JD.US)$ , the Chinese e-commerce giant. In this article, we'll explore the latest trends and examine the company's recent market activity.
What's new?
On August 20, 2024, JD.com saw a 9.5% drop in after-hours trading after $Walmart (WMT.US)$, its second-largest shareholder, announced it had sold its stake in the company. The divestment, which netted Walmart about $3.6 billion, ended an eight-year partnership between the two retailers.
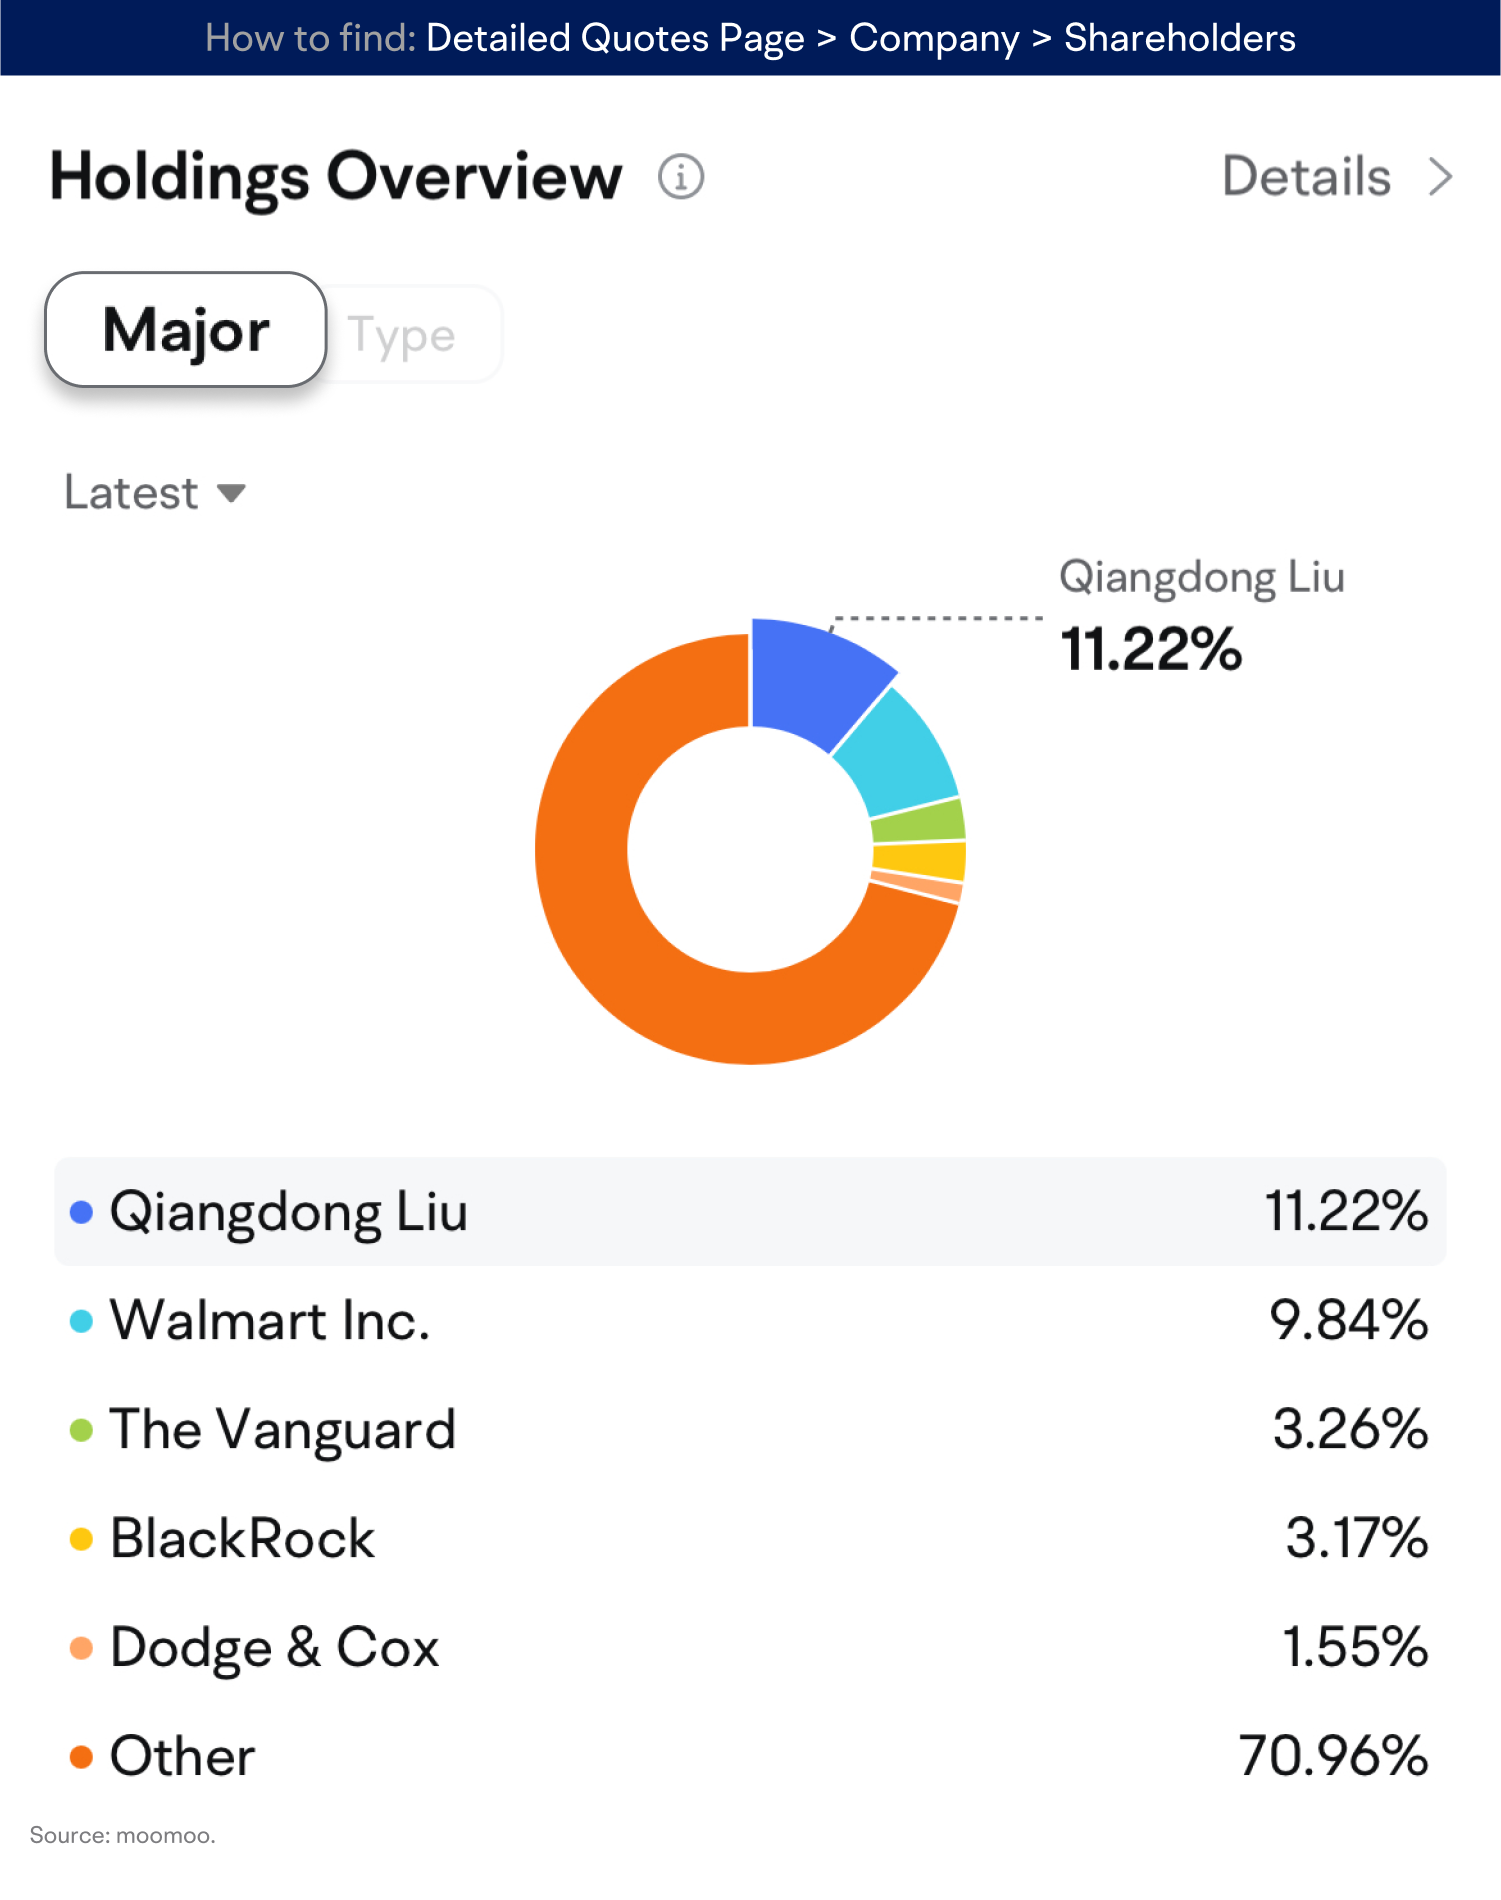
As reported by Bloomberg, undisclosed sources have revealed that Walmart discreetly sold 144.5 million JD.com shares at $24.95 per share. This transaction represents an 11% discount compared to the closing price in the US on the previous Tuesday.
Walmart has expressed their rationale for selling the stake, asserting that it will enable the company to concentrate on bolstering their robust operations in China for both Walmart China and Sam's Club. Additionally, this divestment allows Walmart to allocate capital towards other pressing priorities.
Walmart's Sam's Club franchise has been a standout performer, being the only hypermarket chain among the top five to post sales growth last year, according to the China Chain Store & Franchise Association. Given this success, $Citigroup (C.US)$ anticipates that Walmart will strategically reinvest the capital from the sale to expand its own stores.
Amid economic uncertainty and evolving consumer shopping behaviors, China's prominent online retailers strive to reverse their declining fortunes. Notably, Alibaba, a long-standing industry barometer, surprised investors last week when it disclosed a contraction in its main commerce business during the June quarter. This revelation underscores the challenges online retailers face as they grapple with an ever-changing retail landscape.
Chart of the day
Trend analysis:
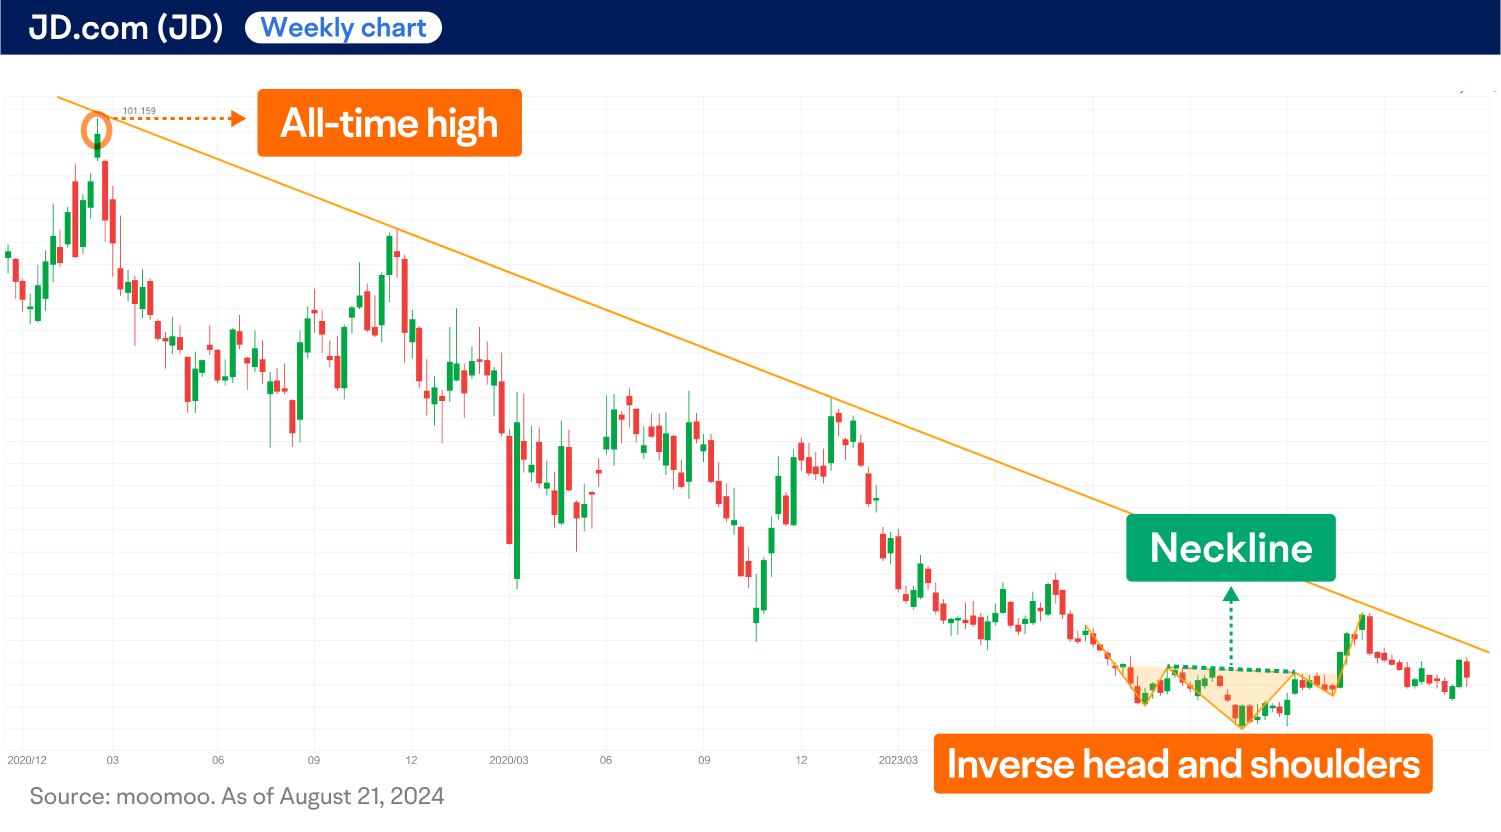
Following its peak at $101 in February 2021, JD.com's shares (JD) have been on a prolonged downtrend. However, after reaching a five-year low of $20 in January 2024, the stock exhibited a reversal pattern known as an inverse head and shoulders, with the neckline situating around $28, as depicted on the weekly chart above. As a result, the stock experienced a notable recovery of over 60%.
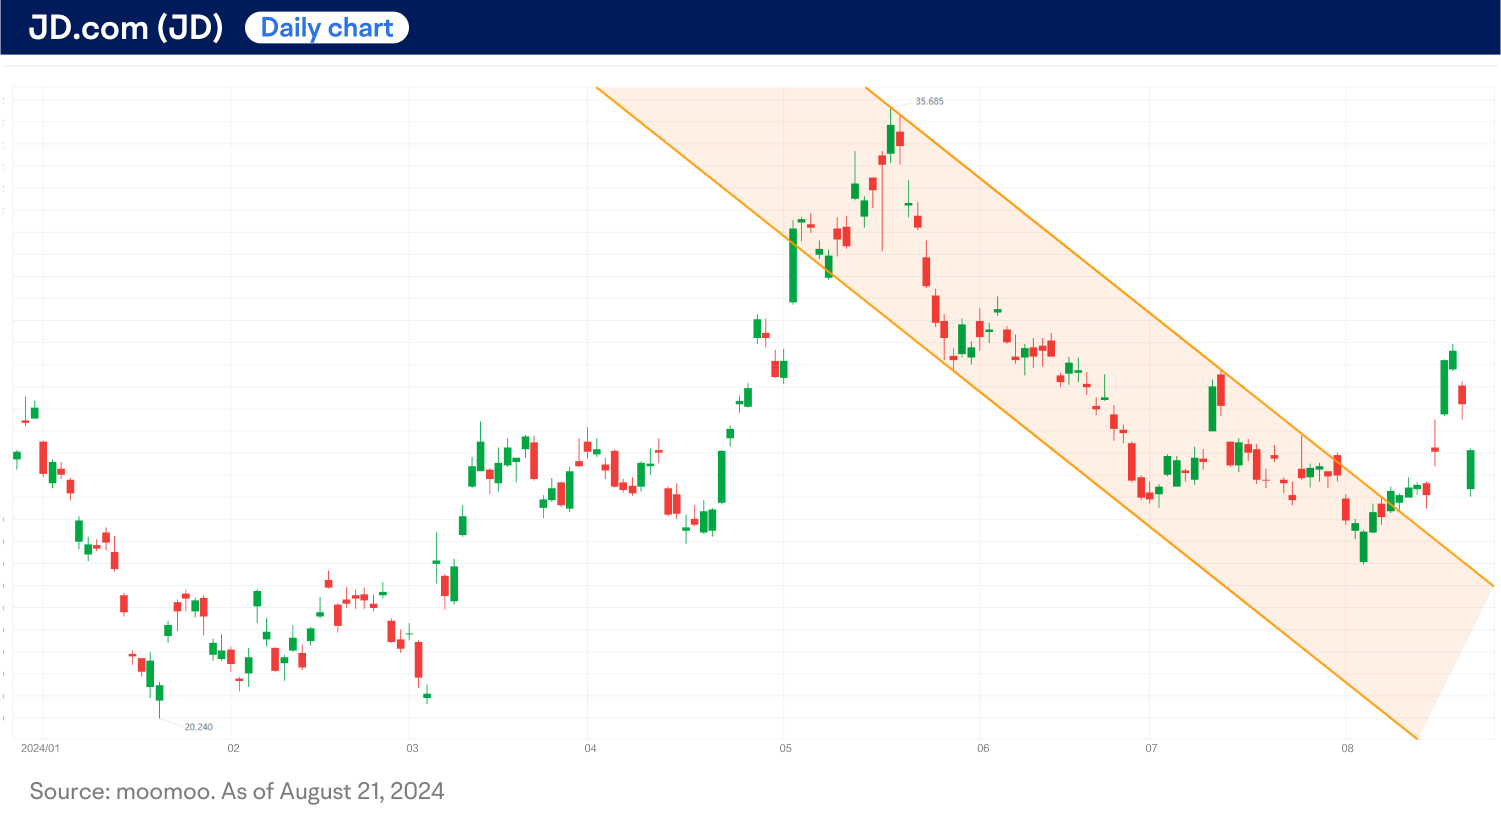
On the other hand, the daily chart illustrates a discernible trend reversal for JD, indicating a downward trajectory in recent months.
Technical indicators:
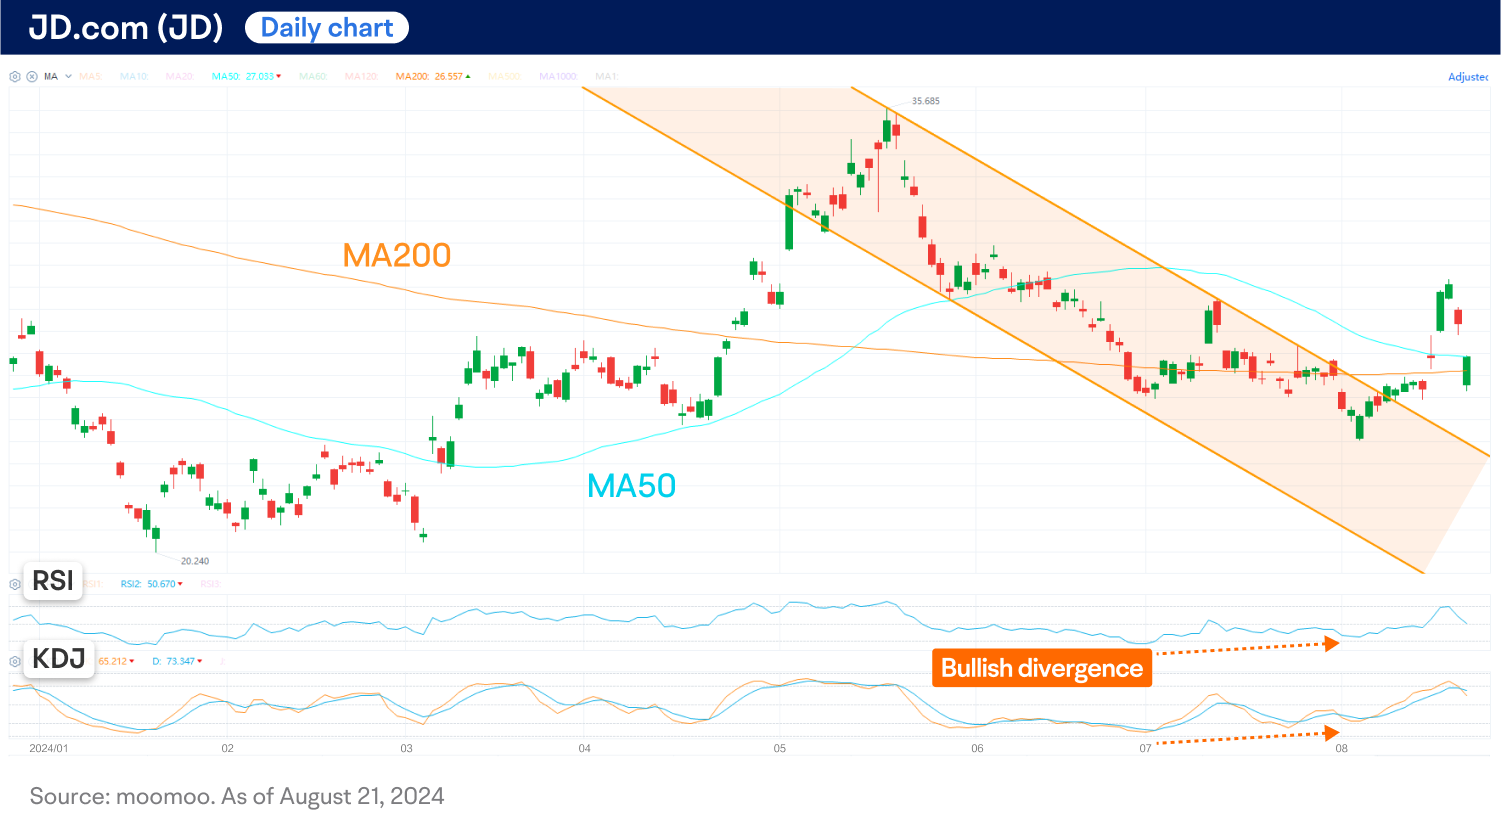
● JD is currently trading in the vicinity of the 50-day and 200-day moving averages (MAs), both of which display a relatively flat pattern in the short term. This observation indicates an absence of clear market direction.
● Momentum oscillators like the relative strength index (RSI) and the KDJ indicator initially signaled bullish divergence, corroborated by a subsequent price rebound. Nevertheless, these indicators have since reversed course in response to the recent price decline.
Next move?
As one of JD's major long-term shareholders, Walmart's substantial divestment at a discount reflects a lack of optimism about the company's prospects. In the near term, traders might want to monitor the pivotal level of around $28, where the neckline of the inverse head and shoulders pattern is situated.
This presentation discusses technical analysis, other approaches, including fundamental analysis, may offer very different views. The examples provided are for illustrative purposes only and are not intended to be reflective of the results you can expect to achieve.
All investing involves risk, including the potential loss of principal, and there can be no guarantee that any investing strategy will be successful.
This presentation is for informational and educational use only and is not a recommendation or endorsement of any particular investment or investment strategy. Investment information provided in this content is general in nature, strictly for illustrative purposes, and may not be appropriate for all investors. Read more