[October.2024] Just a step away from a trillion-dollar valuation: How to interpret Eli Lilly's earni
In the U.S. stock market, trillion-dollar companies like $Apple (AAPL.US)$ , $NVIDIA (NVDA.US)$ , and $Microsoft (MSFT.US)$ are all tech giants. However, outside the tech sector, pharmaceutical giant $Eli Lilly and Co (LLY.US)$ is making a strong push to join this exclusive club.
Since 2017, Eli Lilly's stock has seen eight consecutive years of growth, with annual increases exceeding 30% over the past five years. This year, its market cap briefly surpassed $900 billion, putting it just a step away from the trillion-dollar mark.
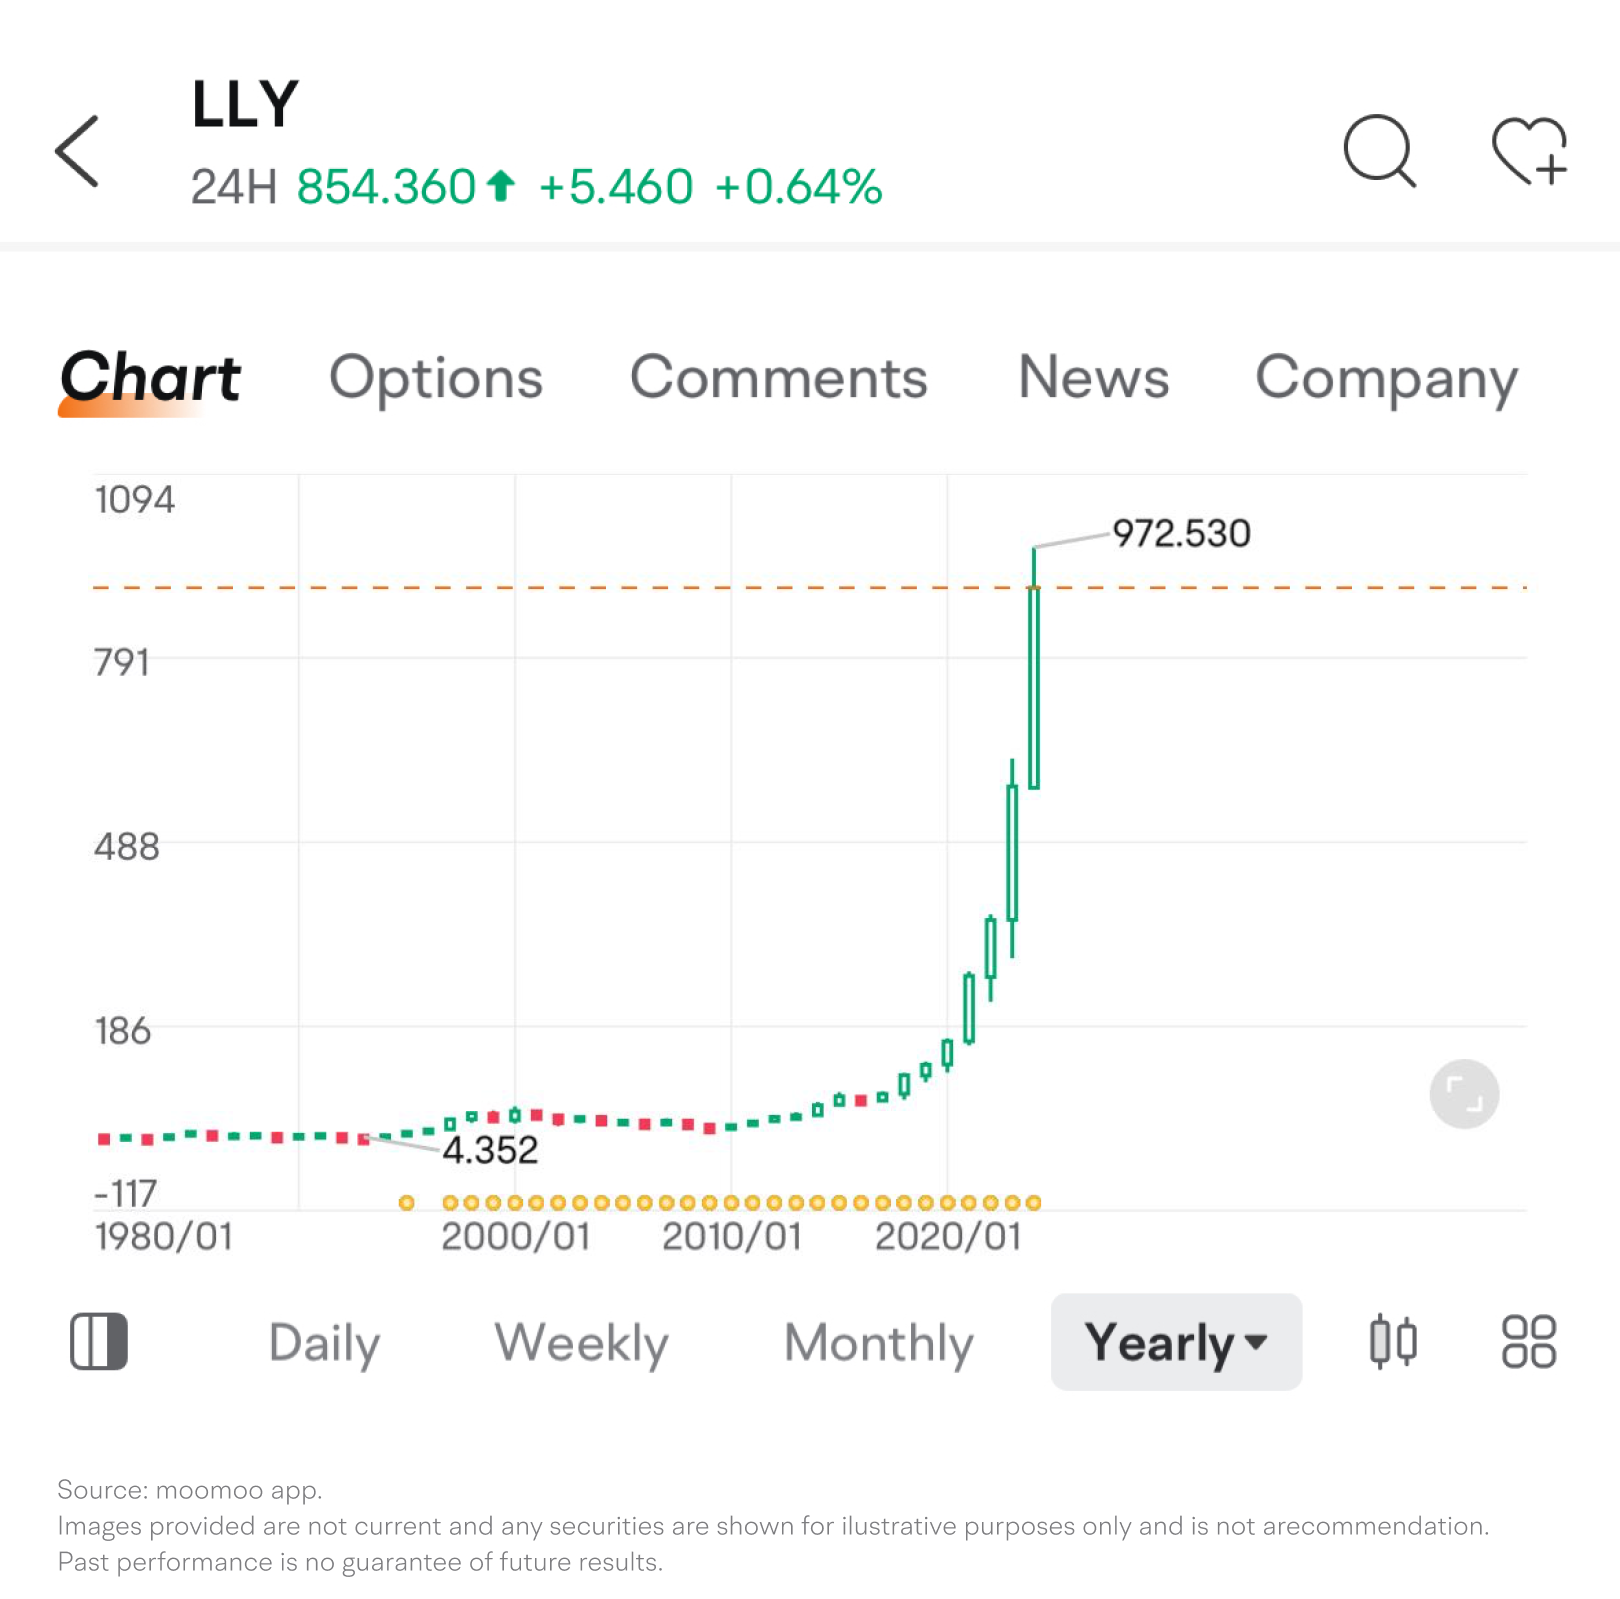
With the upcoming release of its Q3 earnings report on October 30, Eli Lilly's stock performance will be under scrutiny. Each earnings release presents a potential trading or investment opportunity, but investors first need to understand how to evaluate its performance.
To assess Eli Lilly's performance, we may focus on three key areas: revenue growth, changes in profitability, and shareholder returns.
1. Revenue growth
Eli Lilly's nearly trillion-dollar market cap comes with a price-to-earnings (P/E) ratio exceeding 100, which demands exceptionally high revenue growth to justify. Therefore, revenue growth is likely the market's primary focus.
Eli Lilly's drug portfolio is concentrated in four main areas: diabetes, oncology, autoimmune diseases, and neurological disorders. Diabetes-related medications are the company's most significant revenue source, accounting for over 60% of total revenue.
Before 2023, Eli Lilly's growth was steady but not spectacular. Between 2013 and 2022, revenue increased from $23.11 billion to $28.54 billion, a modest growth of just over 20% in ten years. Non-GAAP net income grew from $4.5 billion to approximately $7.2 billion, an increase of about 60% over the same period. If Eli Lilly continues at this slow growth rate, it will be challenging for the market to sustain such a high valuation.
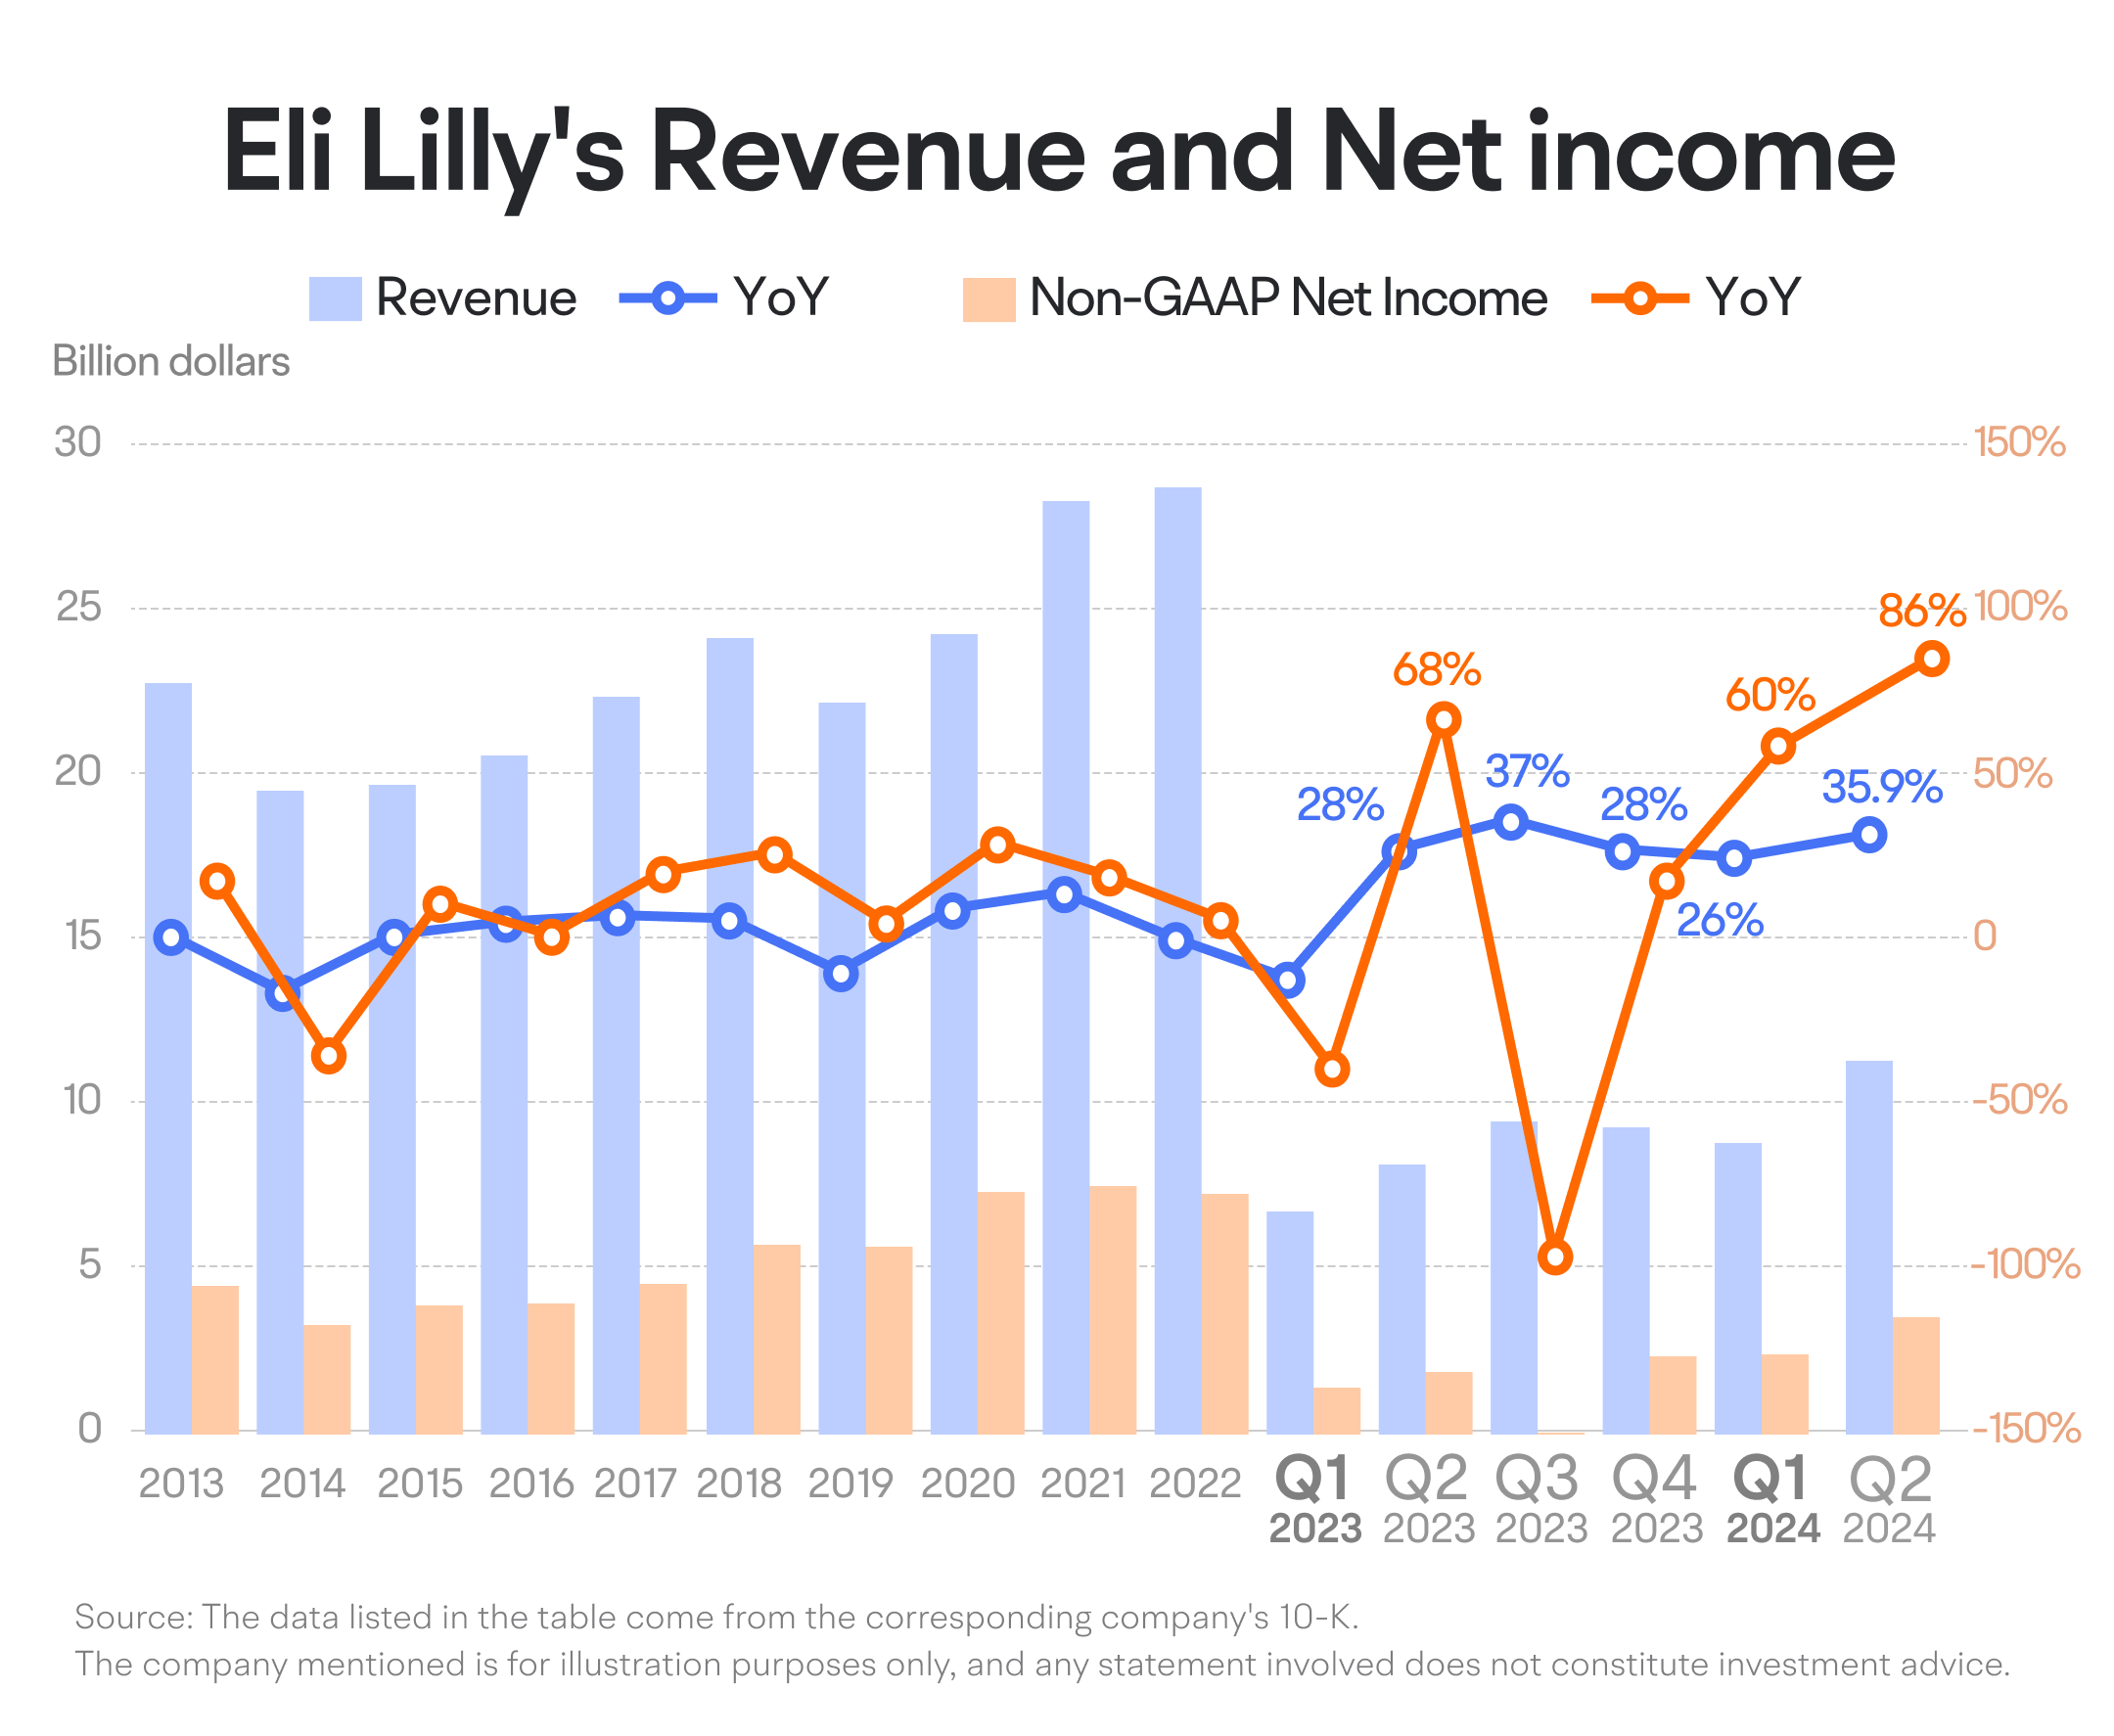
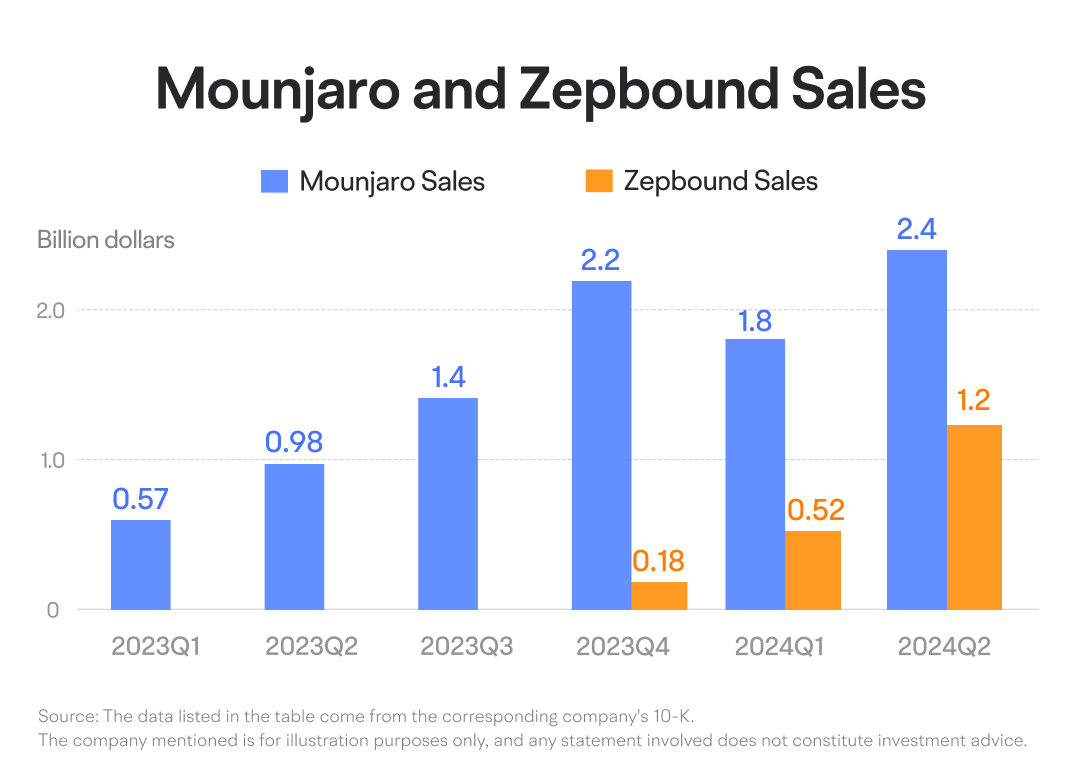
The turning point for Eli Lilly's growth occurred in Q2 2023. During this quarter, the company's blockbuster diabetes drug, branded as Mounjaro under Tirzepatide, saw accelerated sales, contributing nearly $1 billion in revenue for Q2 2023. Additionally, Tirzepatide's weight loss drug, branded as Zepbound, was commercially launched in Q4 2023. Starting from Q2 2023, Eli Lilly's quarterly revenue growth exceeded 25%.
Eli Lilly's net profit fell in Q2 2023 due to a one-time expense of over $2 billion. However, when adjusted, net profit growth soared to over 80% in Q2 2024.
In terms of net profit, aside from a significant dip in Q2 2023 due to a one-time expense of over $2 billion, Eli Lilly's Non-GAAP net income growth surged, at times exceeding 60%.
Whether Eli Lilly can sustain its impressive growth rates may depend on two main factors:
1. Short- to Medium-Term Factors
Mounjaro and Zepbound Sales Volume:
Production Capacity: Currently, the sales growth of Mounjaro and Zepbound is constrained not by consumer demand but by production capacity limitations. Eli Lilly has announced plans to invest billions of dollars to expand capacity to meet the production needs of these blockbuster drugs.
Market Share: Eli Lilly's primary competitor in the diabetes and weight loss drug markets is Novo Nordisk, a pharmaceutical giant with a market cap second only to Eli Lilly in the sector and over 90% of its revenue coming from diabetes-related medications. For instance, Novo Nordisk's weight loss drug Wegovy was commercialized earlier, giving it a first-mover advantage. Future observations should focus on whether Eli Lilly can accelerate growth and capture more market share from Novo Nordisk.
2. Long-Term Factors
Progress of New Drug Pipeline:
As Mounjaro and Zepbound reach high sales levels, their growth may transition from explosive to steady. If Eli Lilly's valuation remains high by then, new blockbuster drugs will be necessary to sustain it. Key developments in Eli Lilly's pipeline include the initiation of Phase 1 clinical trials for its second weight loss drug GLP-1-GIP, positive Phase III clinical results for Tirzepatide for obstructive sleep apnea, FDA and EMA filings for the Crohn's disease drug mirikizumab, and the potential approval of the Alzheimer's drug donanemab later this year. Monitoring the progress and commercialization of these core new drugs will be crucial for assessing Eli Lilly's future growth potential.
2. Profitability
In addition to tracking revenue growth, it's important to focus on improvements in Eli Lilly's profitability. As a pharmaceutical giant with annual revenue in the hundreds of billions, expecting continuous explosive revenue growth may be unrealistic. However, if Eli Lilly can enhance its profitability and, consequently, its net income, this would significantly support its valuation.
To assess Eli Lilly's profitability, we can examine two key aspects:
Profitability Metrics
Gross Margin, Net Margin, and Return on Equity (ROE):
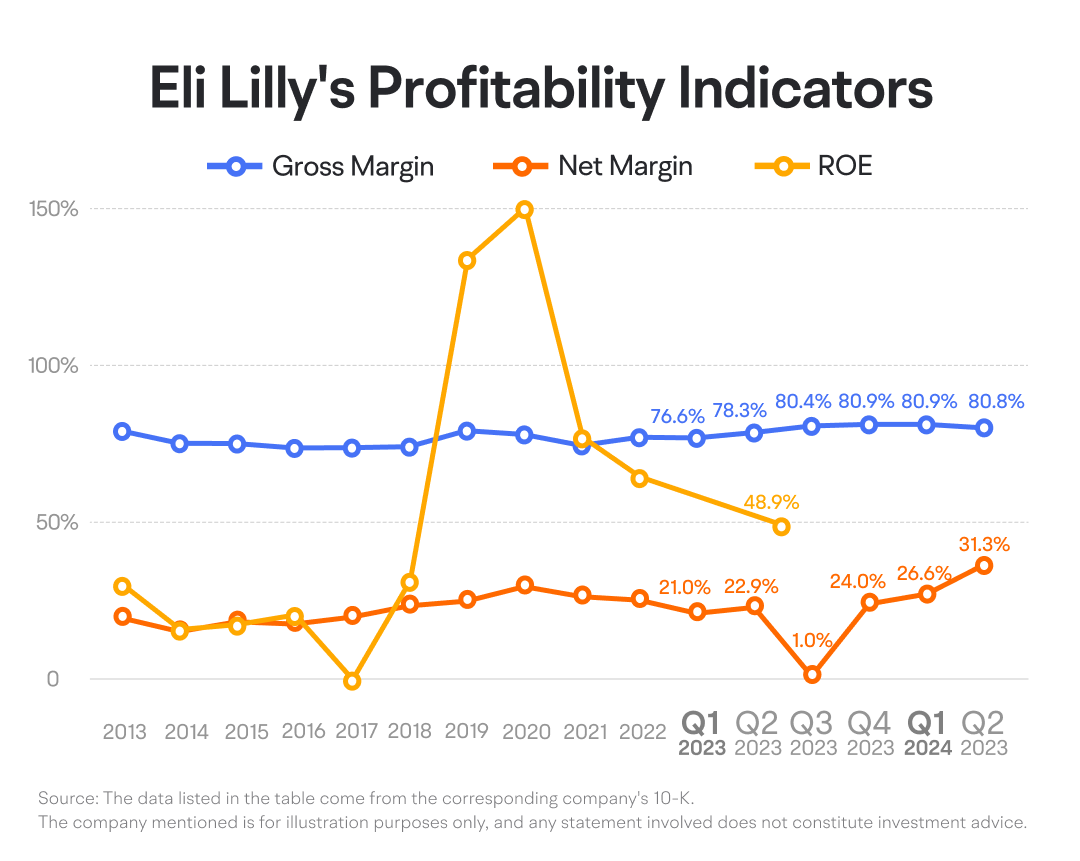
Gross Margin: For most of the time, Eli Lilly's gross margin has been above 75%, though with some fluctuations. Starting from Q2 2023, there has been a noticeable improvement in gross margin, increasing from 76.6% in Q1 2023 to 80.9% in Q1 2024.
Net Profit Margin: Due to one-time expenses, Eli Lilly's net profit margin has been somewhat unstable. However, its Non-GAAP net profit margin has generally remained above 20%, recently reaching around 26.6% in Q1 2024.
Return on Equity (ROE): While Eli Lilly's ROE has declined over the past few years, it still maintains a relatively high level, close to 50%.
Comparison with Competitor Novo Nordisk
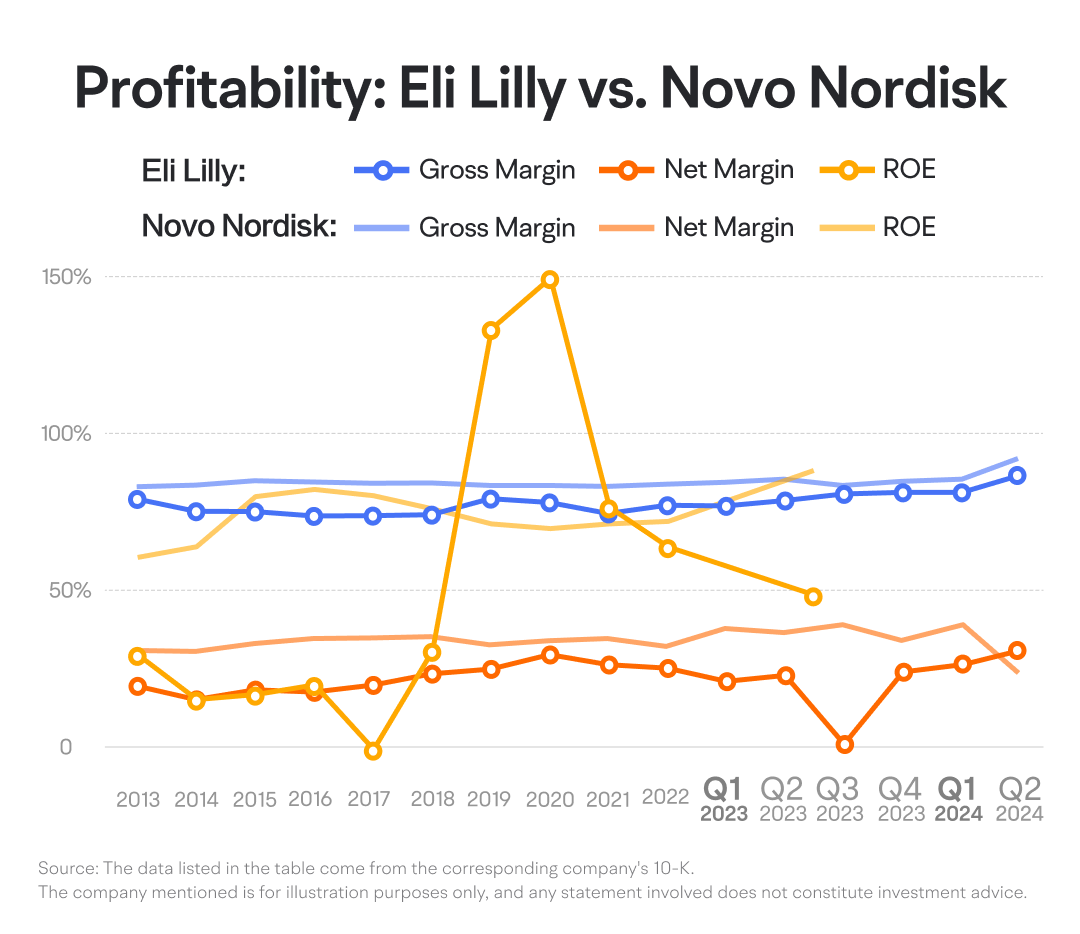
Historically, Eli Lilly's gross margin and net profit margin have been lower than those of its main competitor, Novo Nordisk. Additionally, Eli Lilly's ROE has also lagged behind Novo Nordisk in most years.
Novo Nordisk has demonstrated more stable profitability metrics, making its profitability more consistent compared to Eli Lilly. However, in Q2 of this year, Novo Nordisk's net profit margin fell below 30% for the first time due to a surge in short-term R&D expenses. This may, however, be a temporary setback.
In future financial reports, we can continue to monitor whether Eli Lilly can further improve its profitability and close the gap with Novo Nordisk.
3. Shareholder returns
For pharmaceutical giants like Eli Lilly and Novo Nordisk, R&D spending tends to be stable, and capacity expansion progresses gradually. With excess cash flow, these companies have ample resources to reward shareholders.
Public companies typically return value to shareholders through dividends and share buybacks. Dividends provide direct cash payouts, while buybacks can increase return on equity (ROE) and earnings per share (EPS), adding market liquidity and being well-received by shareholders.
Eli Lilly, a market leader in pharmaceutical stocks, excels in shareholder returns. Between 2013 and 2023, Eli Lilly's total dividends and buybacks amounted to $45.5 billion, nearly matching its net profit of $46.8 billion for the same period—representing 97% of net profit, significantly higher than Novo Nordisk's 88%.
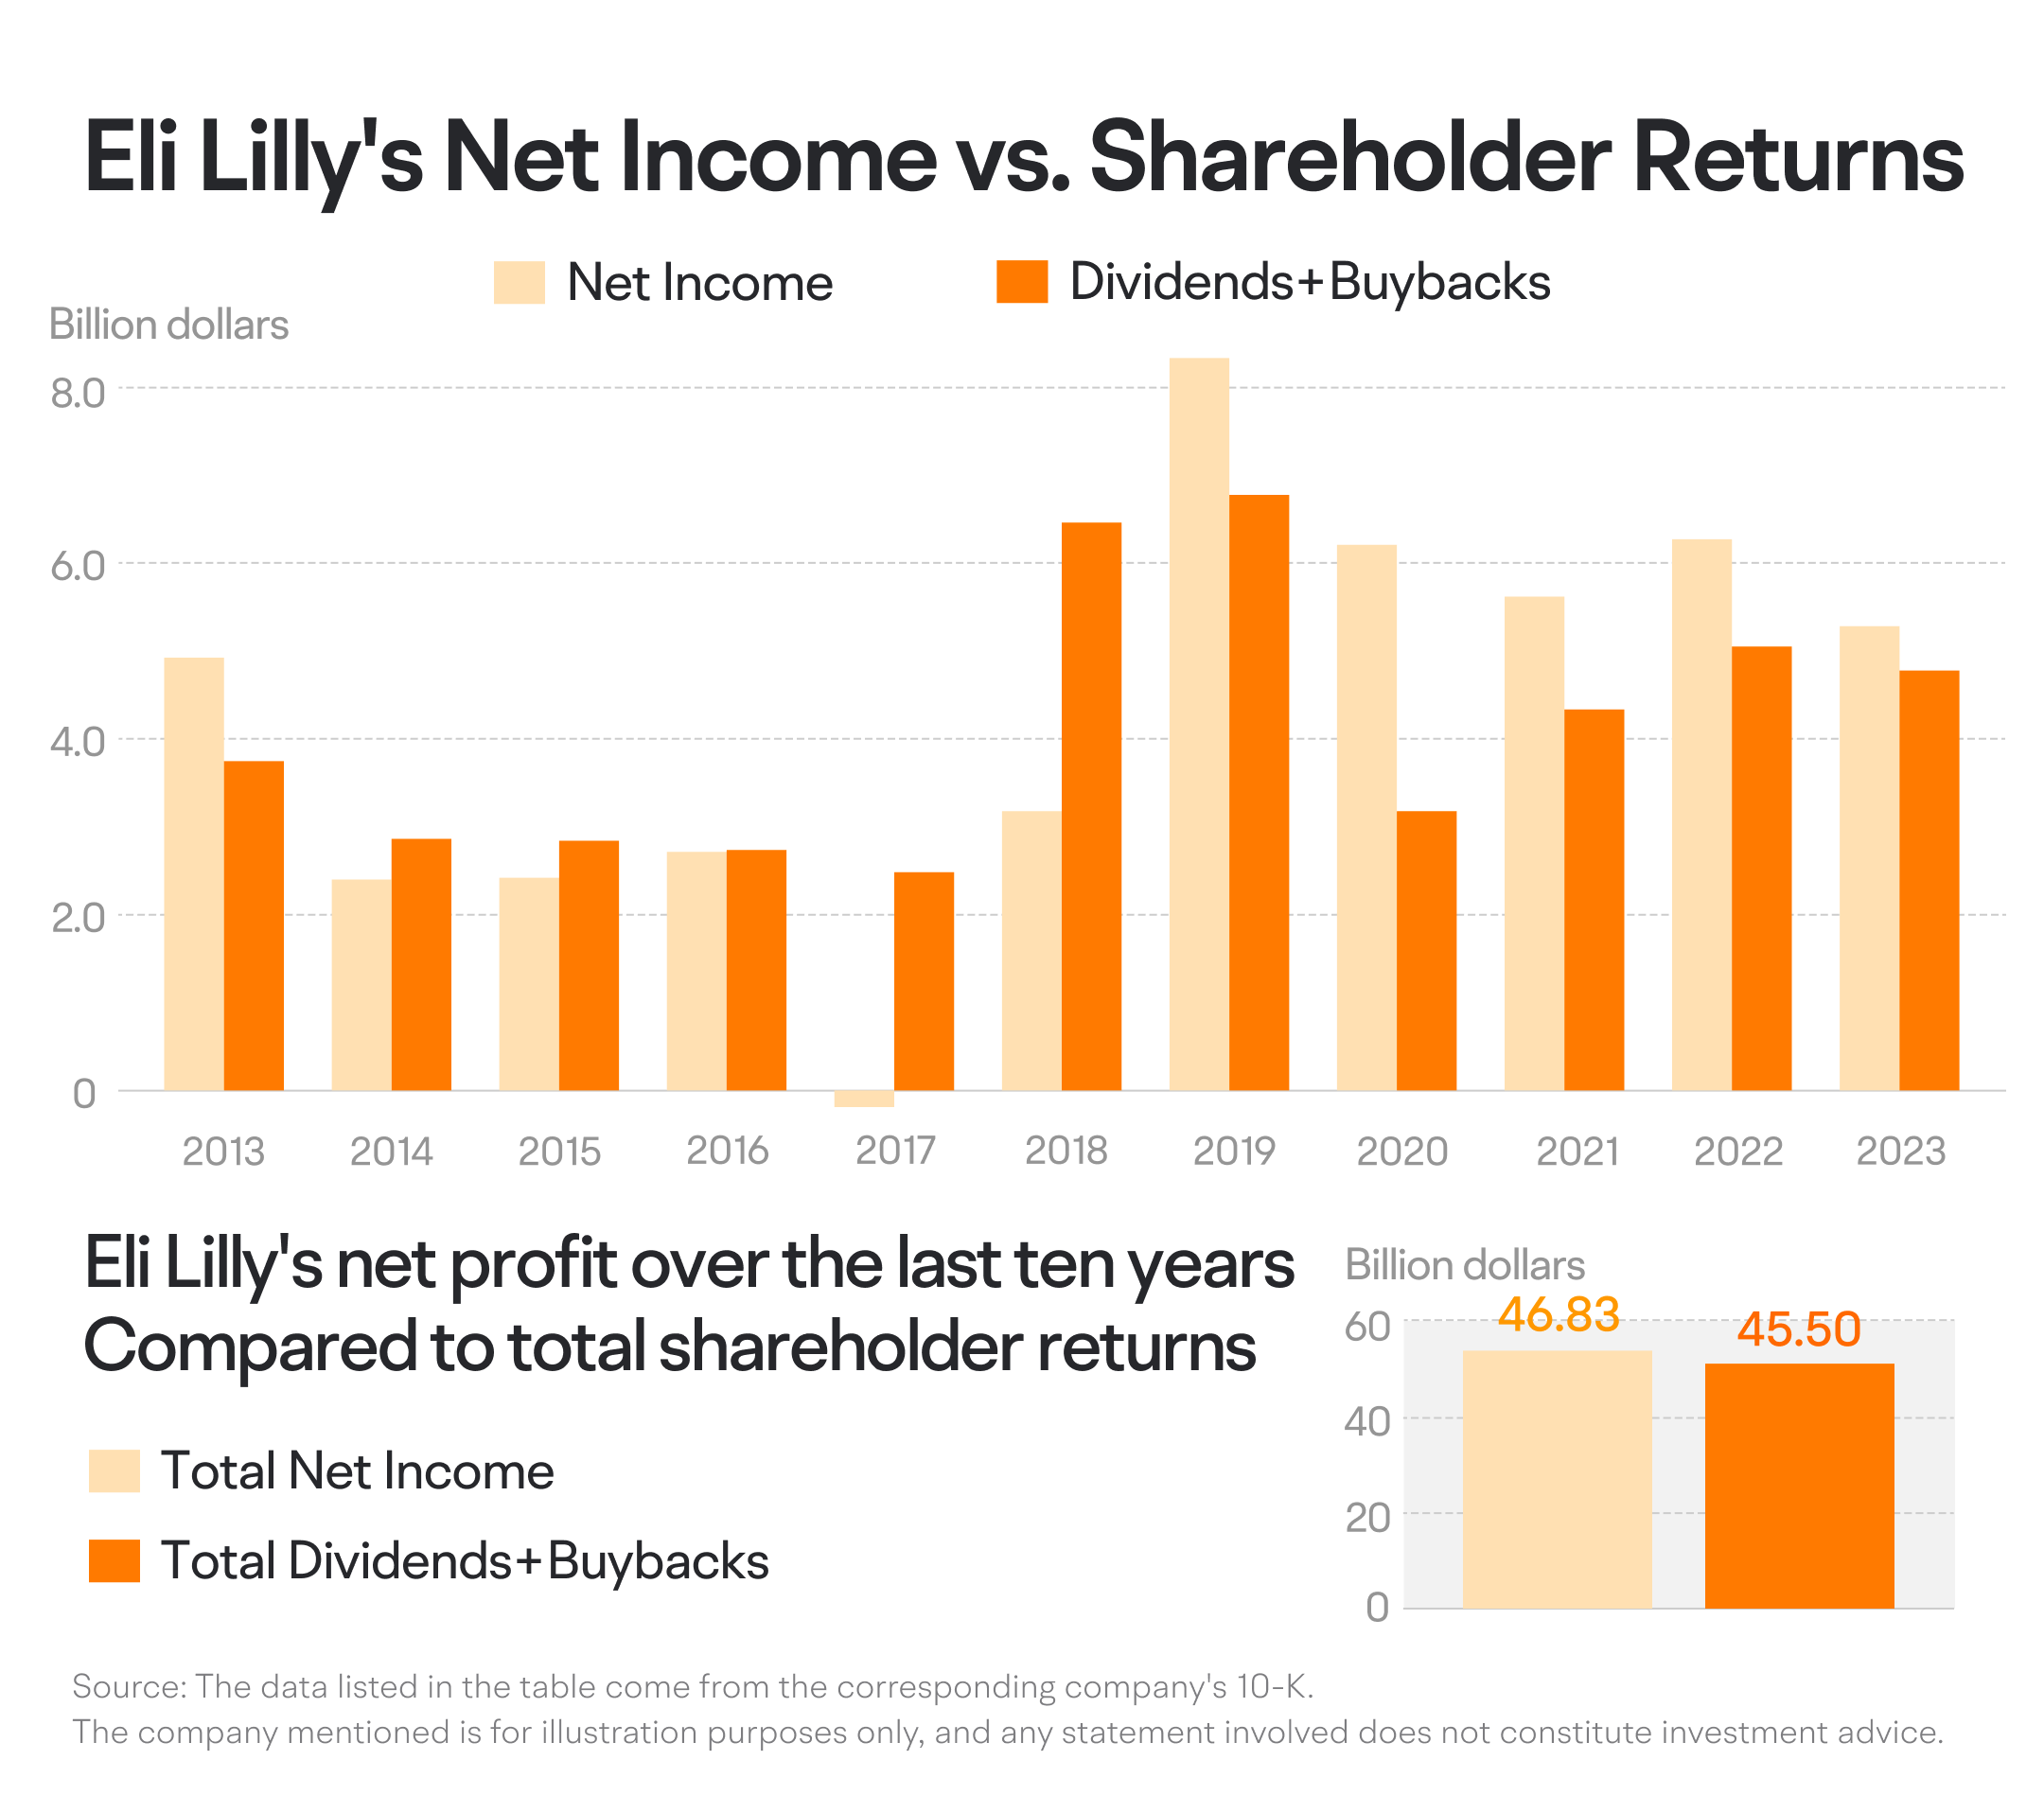
In future financial reports, we can continue to monitor whether Eli Lilly maintains its generous shareholder return policies.
Summary
For Eli Lilly's financial reports, we should focus on three key areas: performance growth, profitability, and shareholder returns.
Performance Growth: Pay close attention to the sales growth of Mounjaro and Zepbound, as well as the progress and commercialization of new drugs.
Profitability: Monitor the improvement in profitability metrics such as gross margin and net margin, and compare these with key competitor Novo Nordisk.
Shareholder Returns: Observe whether Eli Lilly continues its historically generous shareholder return policies.
This presentation is for informational and educational use only and is not a recommendation or endorsement of any particular investment or investment strategy. Investment information provided in this content is general in nature, strictly for illustrative purposes, and may not be appropriate for all investors. Read more