[December.2024] Decoding Broadcom earnings: the second-largest chip giant after Nvidia
When it comes to AI development beneficiaries, besides the hotshot NVIDIA, Broadcom definitely ranks high. As a leader in communication chips, Broadcom's network chips are essential for data transmission between AI chip clusters. Riding the AI wave, Broadcom's stock price has surged for two consecutive years, making it the second-largest chip giant by market value, just behind NVIDIA.
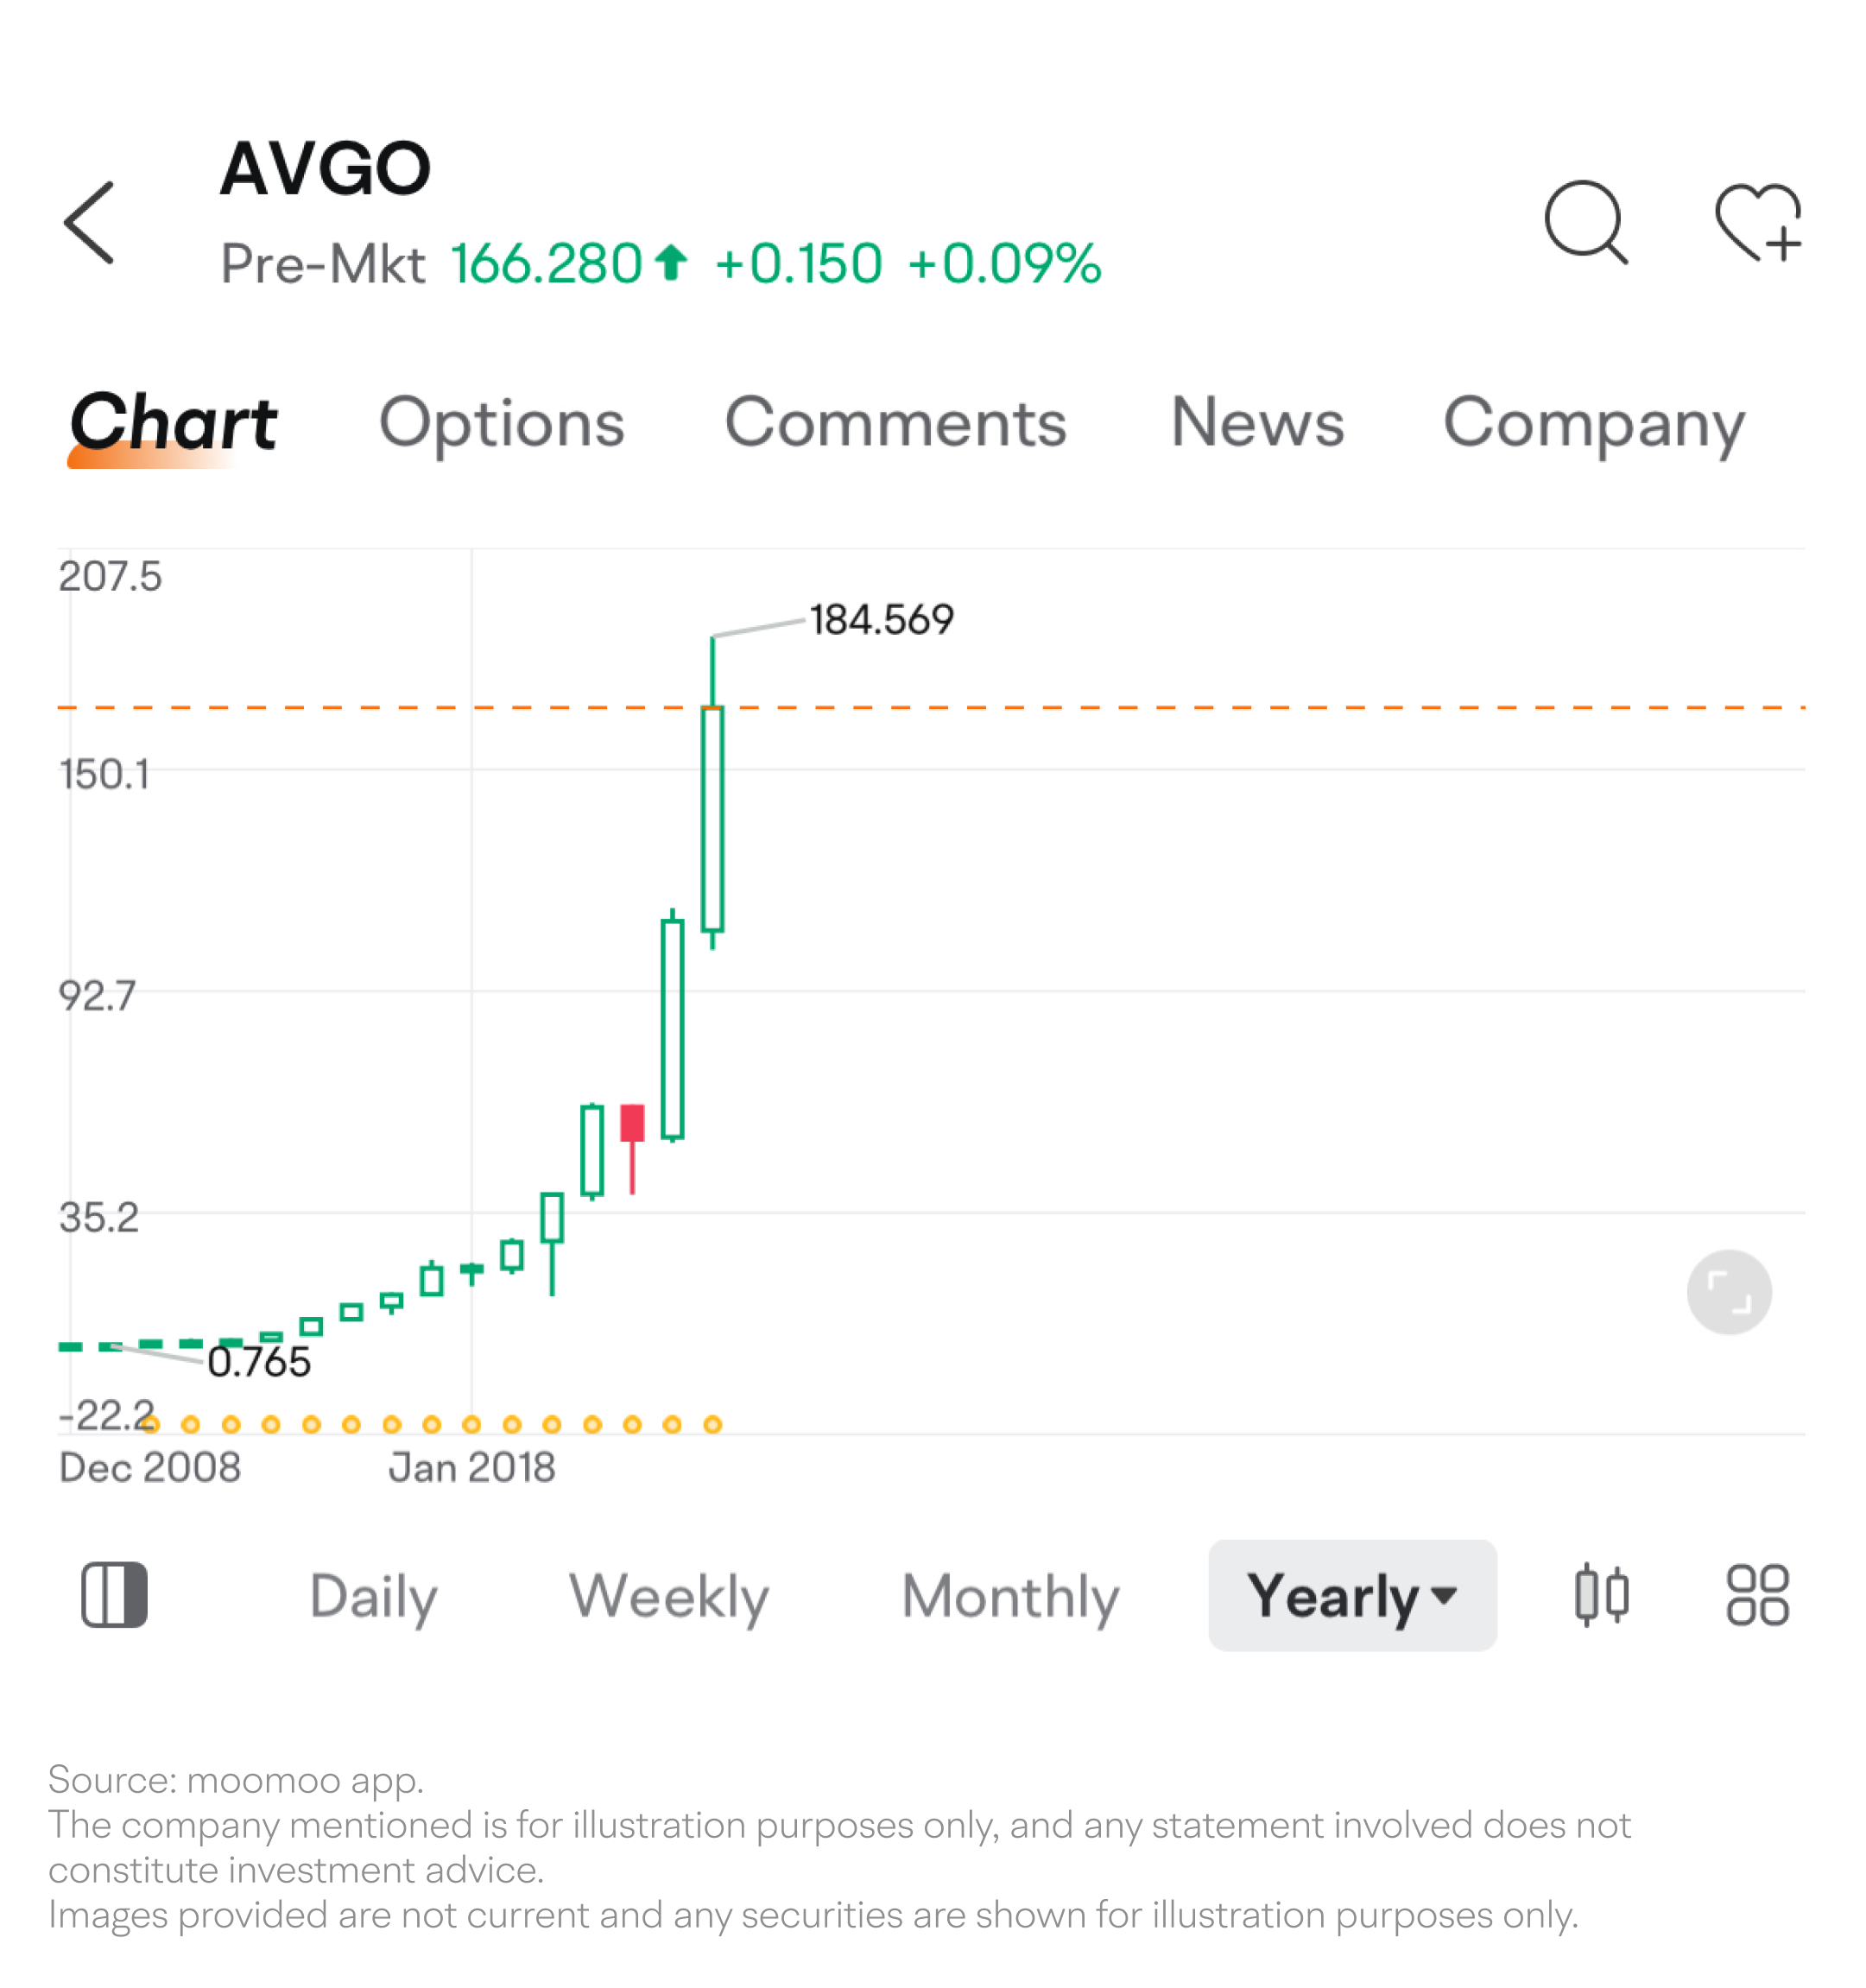
Broadcom is set to release its latest earnings report soon. Each earnings release may present a promising trading or investment opportunity. But before diving in, investors need to understand how to interpret its performance. We may focus on four key areas: revenue growth, profitability, inventory changes, and cash flow and shareholder returns.
1. Revenue growth
Broadcom is known as a big player in mergers and acquisitions, with historical deals totaling over $100 billion. This has resulted in a diverse business portfolio, offering thousands of chip and software-related products that span enterprise and data center networks, set-top boxes, telecom equipment, smartphones, and base stations.
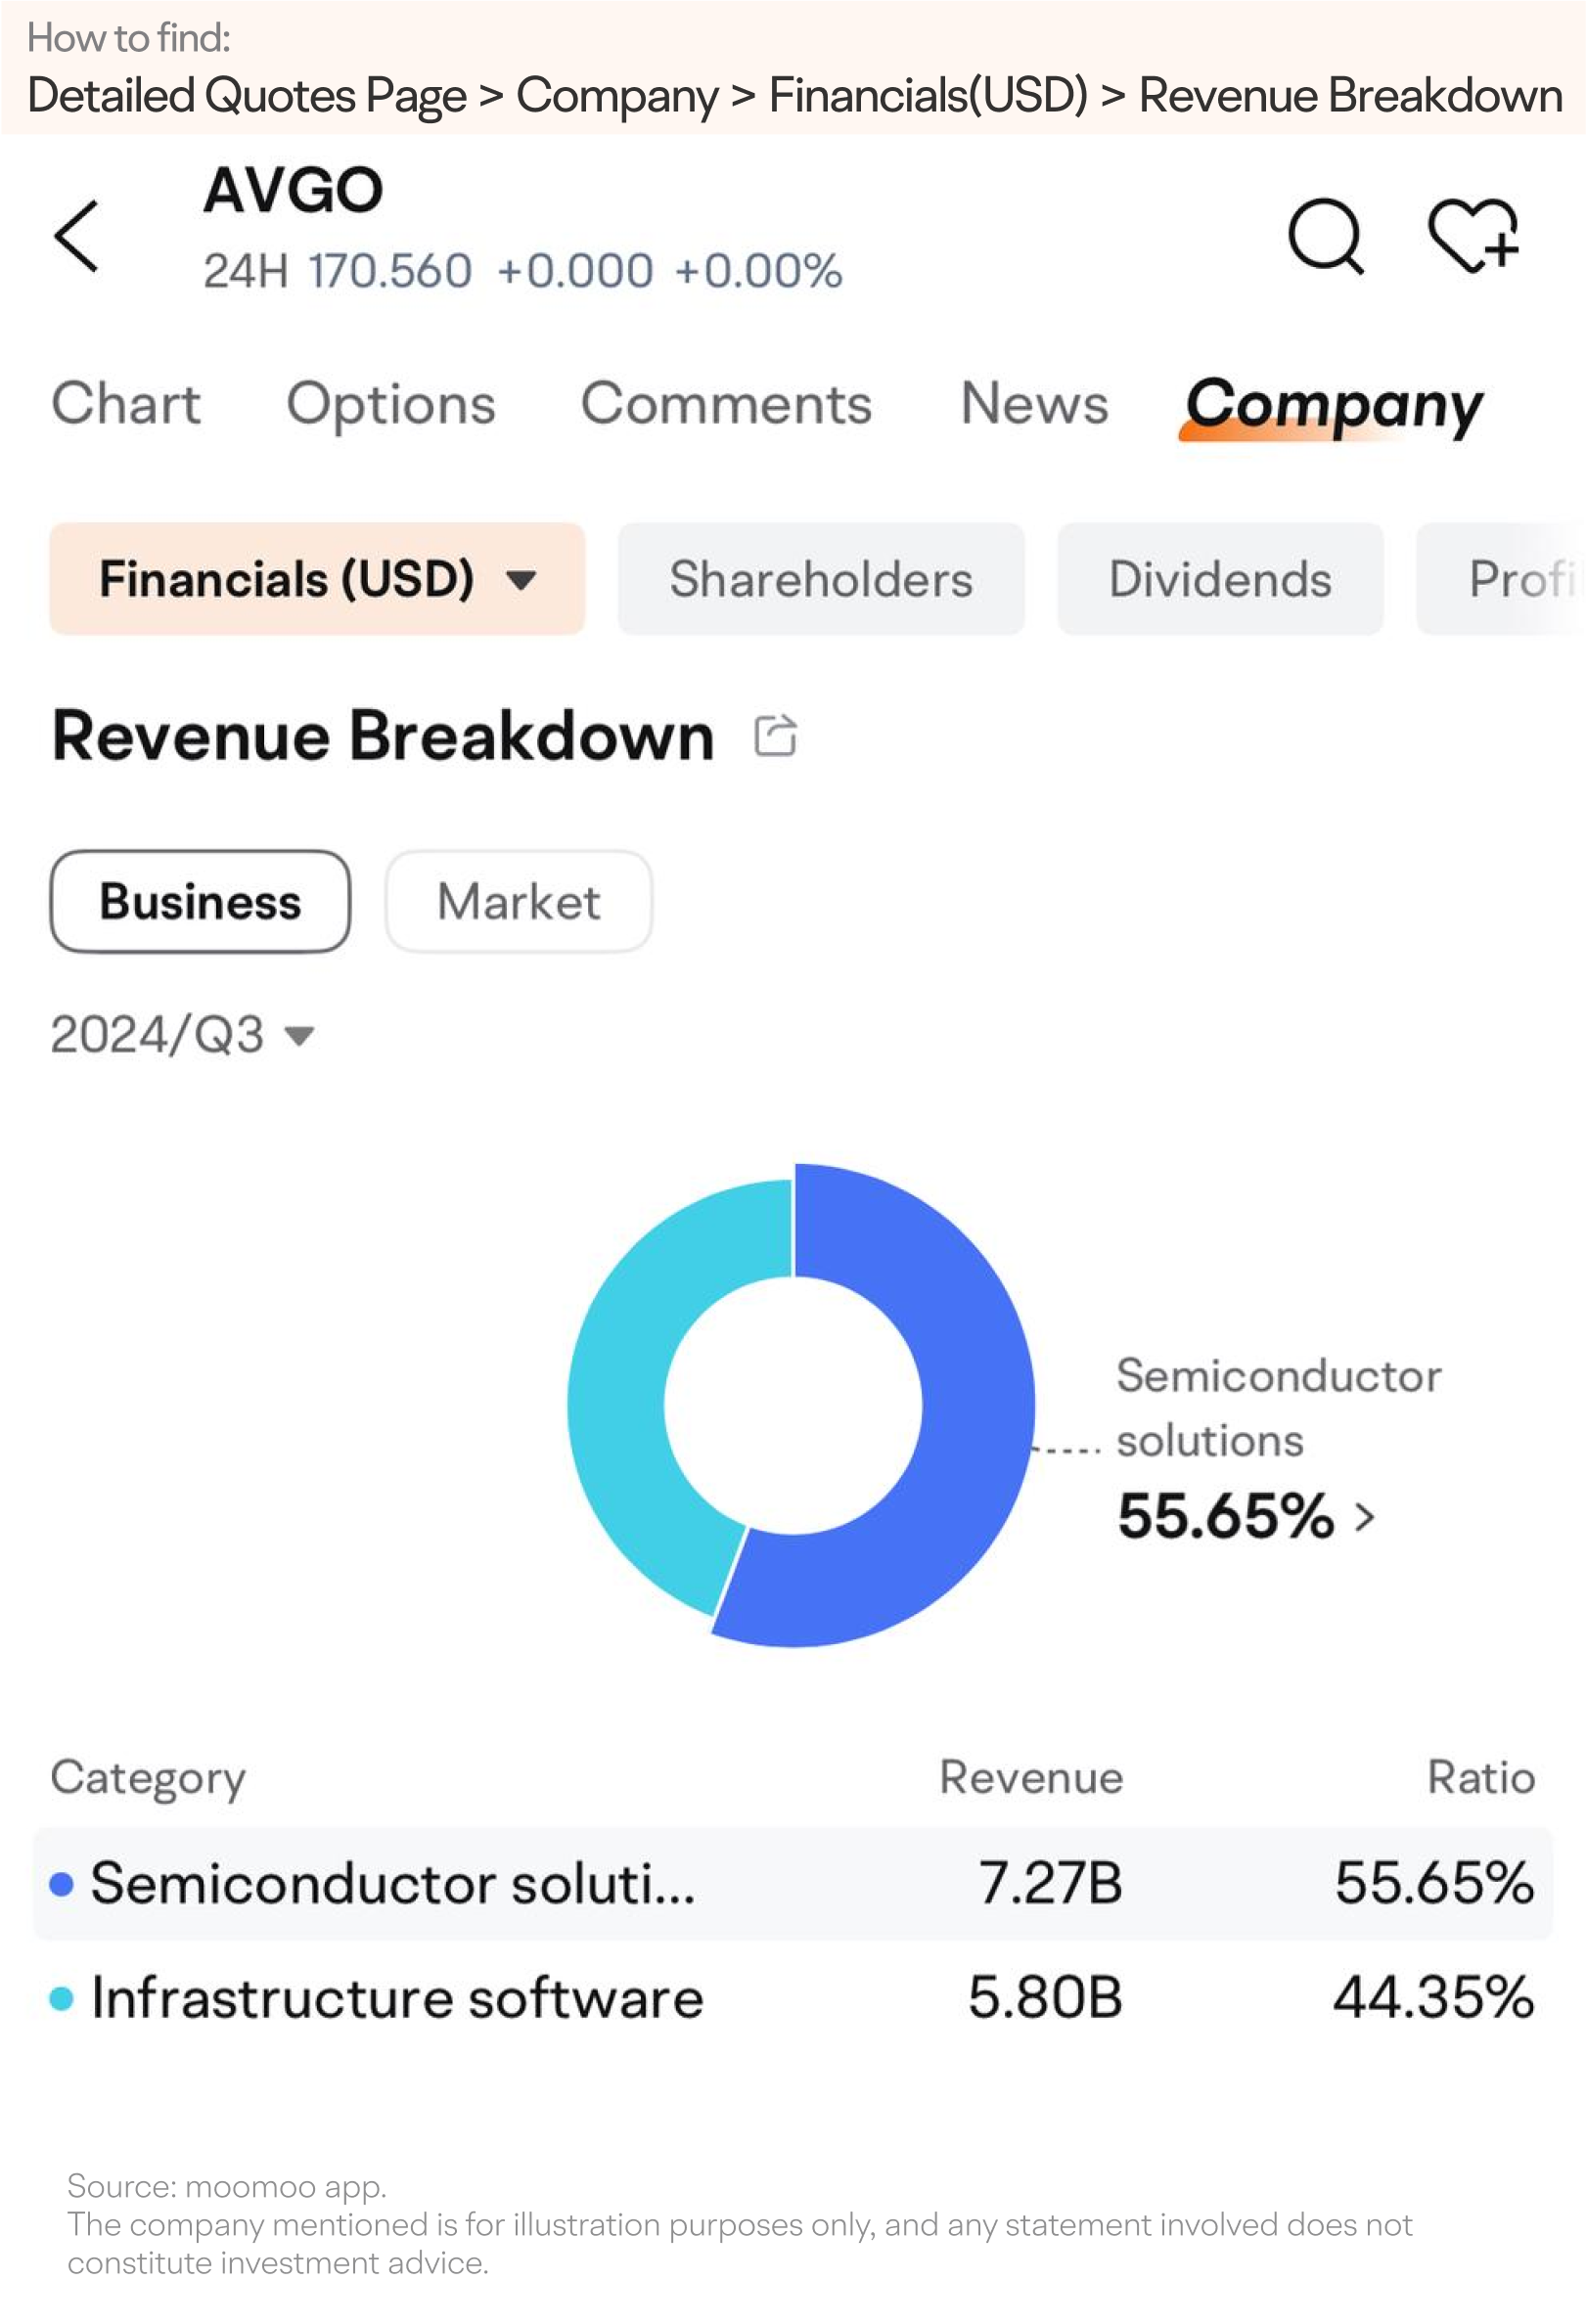
Broadcom's revenue mainly comes from two segments: Semiconductor Solutions and Infrastructure Software.
This data is available in the Financials section of the stock quotes page on moomoo.
Previously, Semiconductor Solutions accounted for nearly 80% of the total revenue. However, after acquiring VMware for $61 billion at the end of 2023, the software segment's revenue share jumped to over 40% by Q3 of the 2024 fiscal year.
Historically, Broadcom has shown steady revenue growth, increasing year over year and even quarter over quarter since 2017. However, the revenue growth rate has experienced significant fluctuations due to the cyclical nature of the semiconductor industry. From Q4 of the 2020 fiscal year, Broadcom enjoyed double-digit growth for ten consecutive quarters. Yet, starting from Q2 of 2023, the growth rate dipped for three quarters before bouncing back to over 10% in the most recent three quarters. The year-over-year growth went up to nearly 50% in Q3 2024.
So, what does the future hold for Broadcom's revenue growth? Let's break it down by segment.
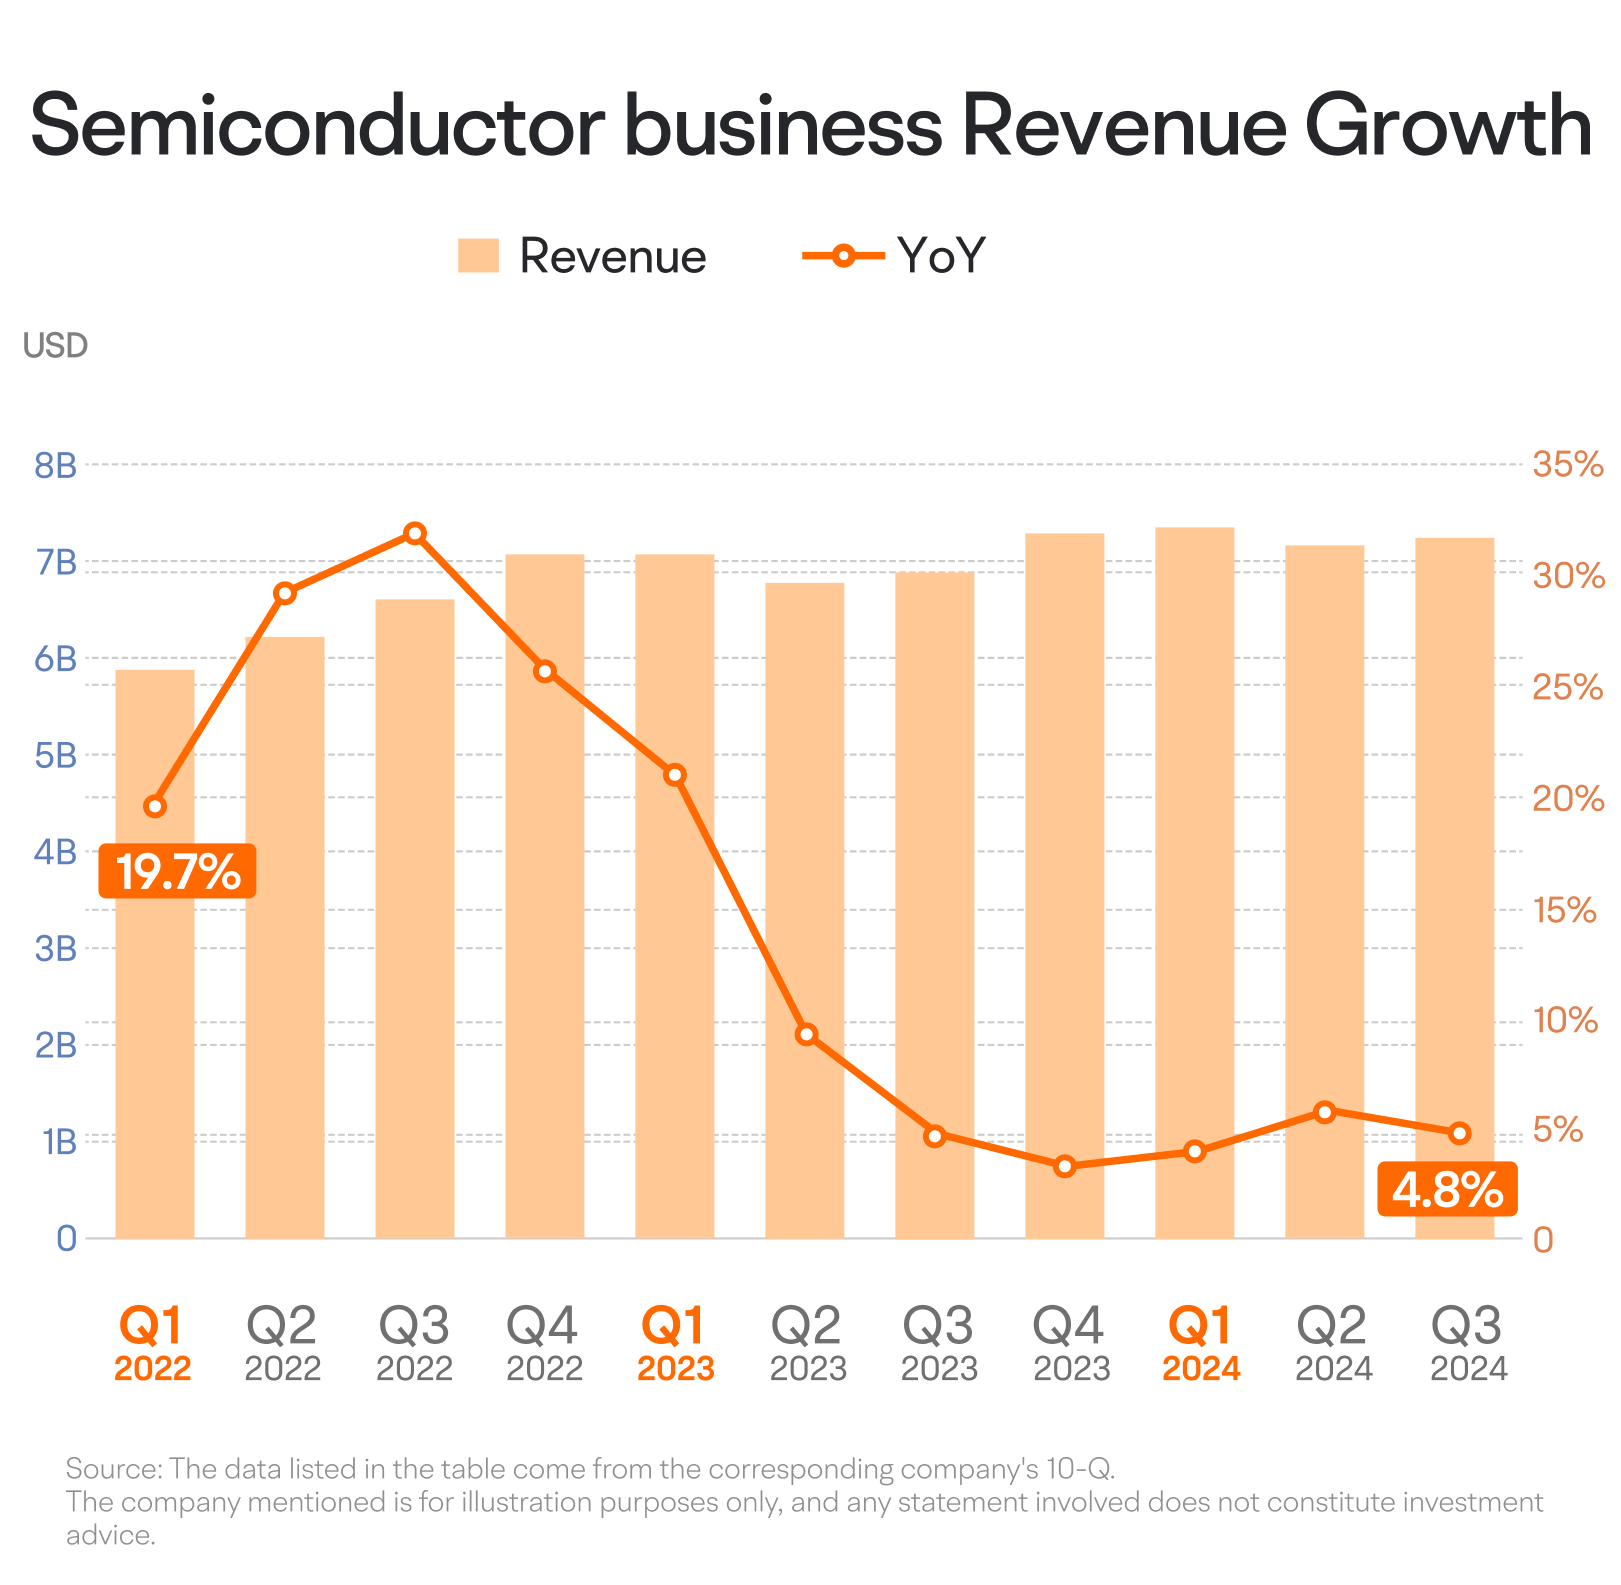
First, let's look at Broadcom's largest segment: the semiconductor business. This segment is further divided into Networking, Wireless Communication, Enterprise Storage, Broadband, and Industrial & Other in their earnings reports. The revenue growth for this segment remains steady at around 5%, primarily driven by the expansion of network operations.
But why is Networking performing so well? The answer may lie in the surge of AI development.
Training large AI models requires a significant number of high-performance chips, including NVIDIA GPUs. Connecting these chips requires Ethernet switches, routers, and other network chips, which fall squarely within Broadcom's Networking segment. Additionally, Broadcom's network chips are crucial for custom ASIC chips in the AI field. For example, Broadcom was deeply involved in the development of Google's custom AI server chip, the TPU AI accelerator.
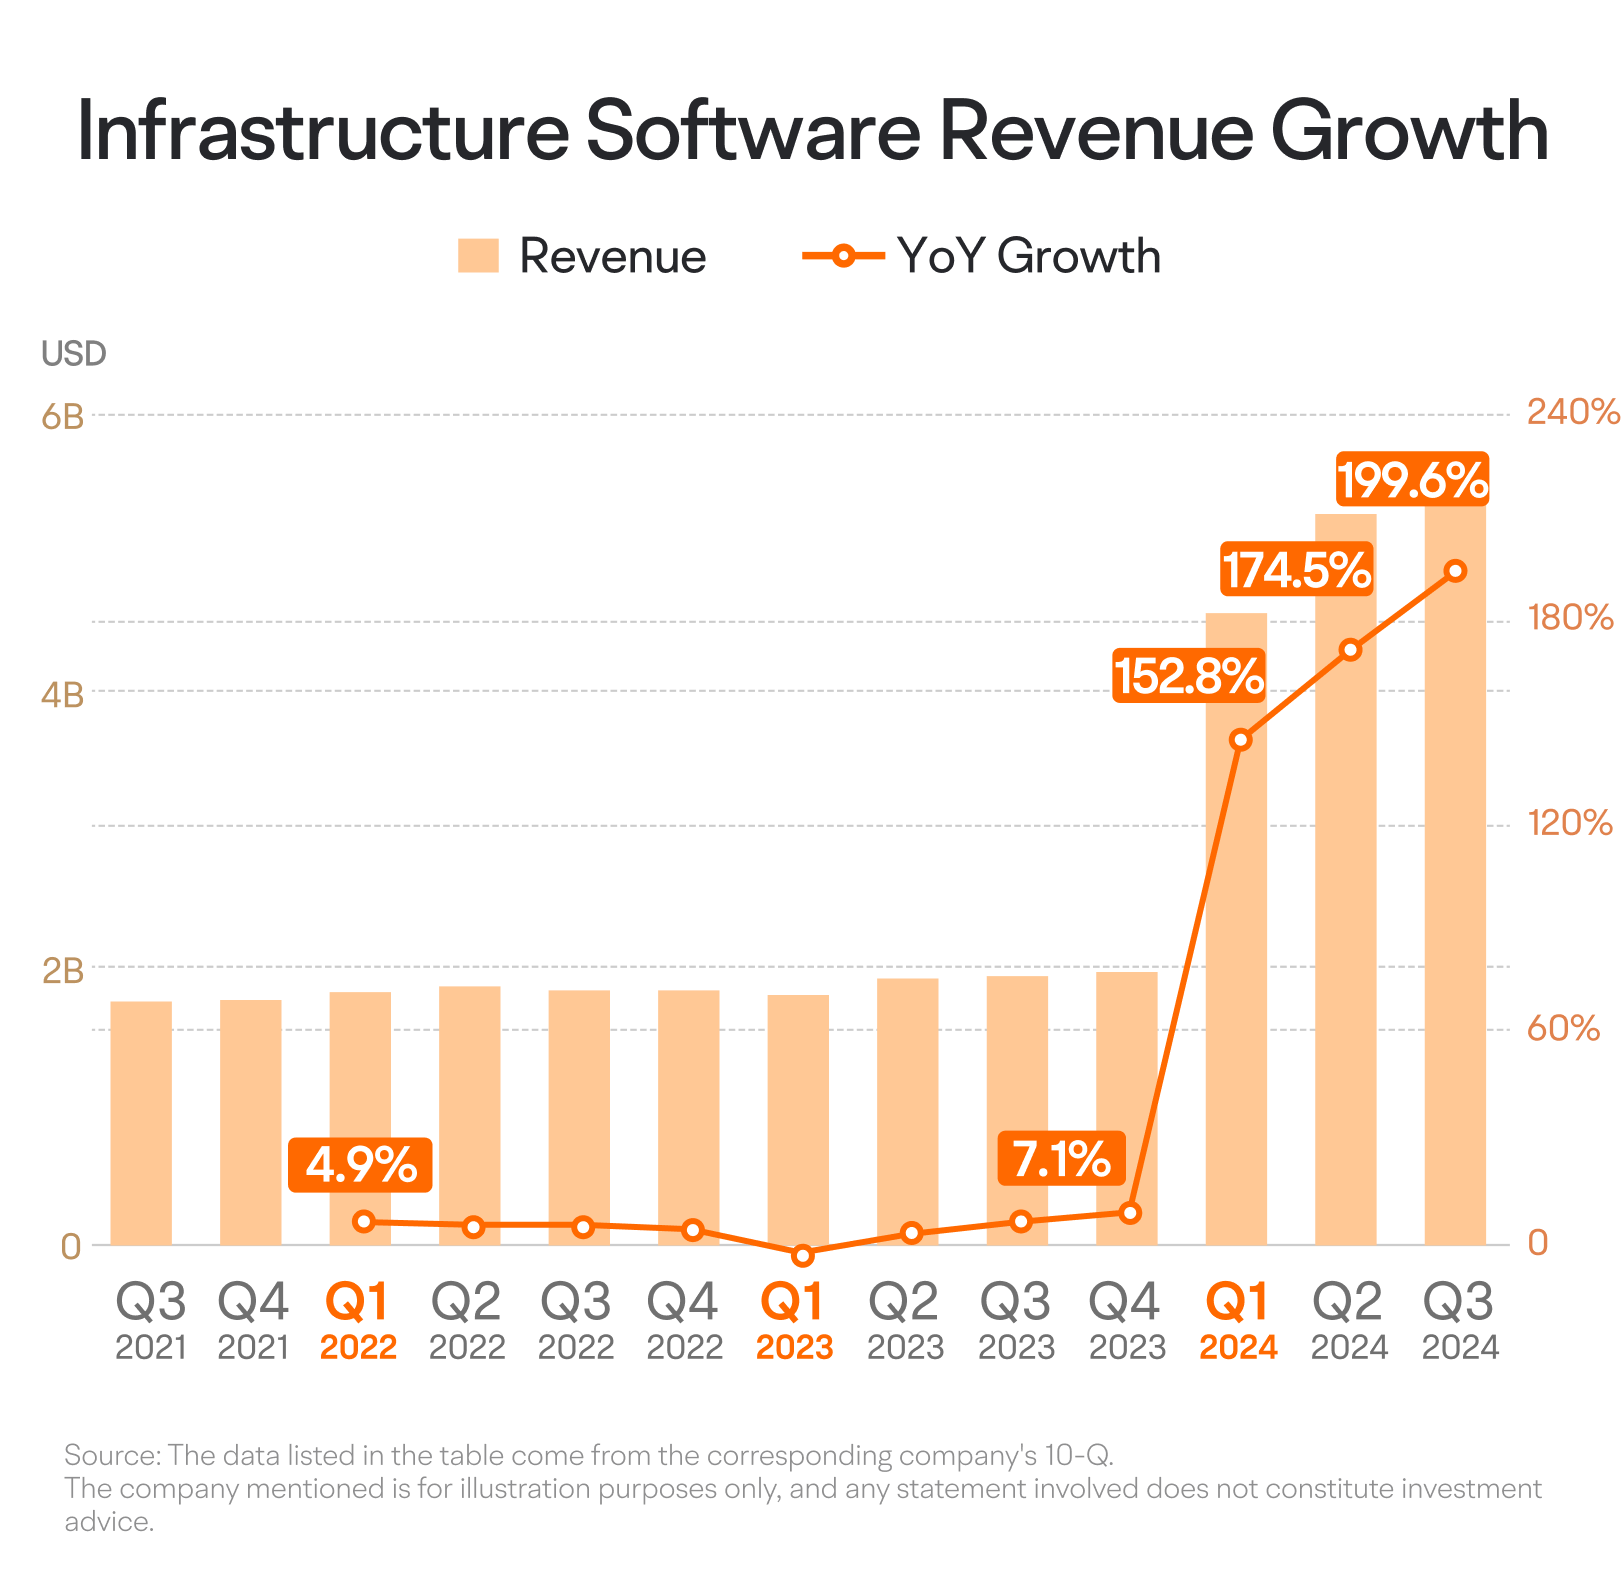
Broadcom's other major segment, Infrastructure Software, has also shown steady growth over recent quarters. Since the start of the 2024 fiscal year, this segment's revenue growth has exceeded 100%, thanks to the added revenue from the VMware acquisition last year. Even without factoring in acquisitions, Broadcom's existing Infrastructure Software business has been accelerating its growth over the past few quarters, according to their financial reports.
Looking ahead to future fiscal quarters, key areas to watch for Broadcom include whether AI development will continue to drive accelerated growth in the networking segment, if other semiconductor segments can stabilize and rebound as the industry cycle recovers, and whether the Infrastructure Software segment can maintain its steady upward revenue trend.
2. Profitability
The semiconductor industry has high technical barriers, but once a company dominates a particular field, it can achieve strong pricing power and profitability. As a leader in communication chips, Broadcom's profitability is among the highest in the semiconductor industry.
Examining various profitability metrics, Broadcom's gross margin increased from 61.9% in Q3 of fiscal 2021 to 69.4% in Q3 of fiscal 2023. During the same period, the adjusted net margin rose from 27.2% to 39.5%. Additionally, Broadcom's return on equity (ROE) reached an impressive 70% in fiscal 2023.
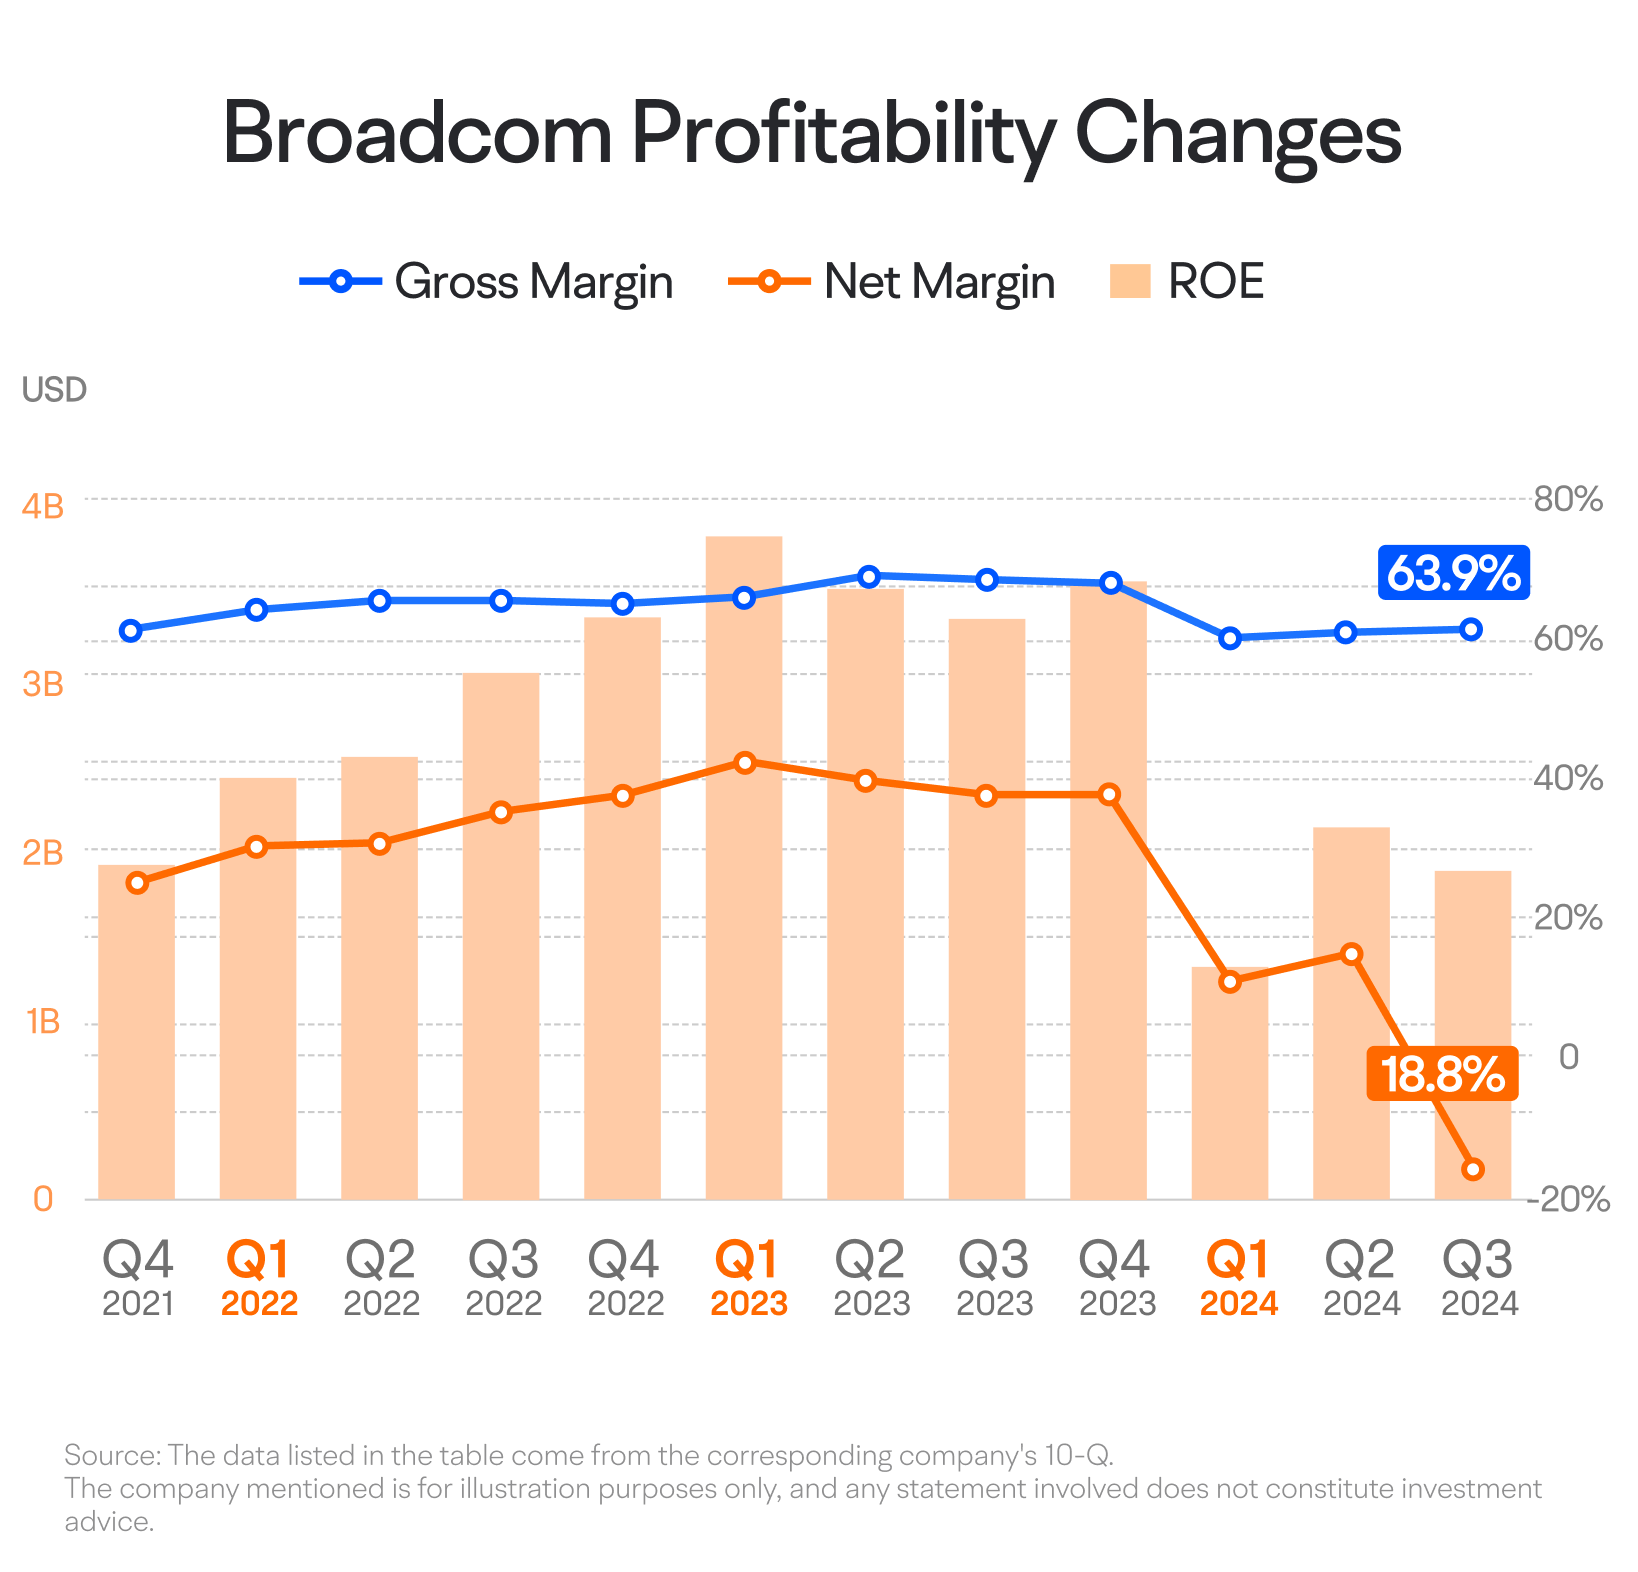
However, in recent quarters, Broadcom has experienced a significant decline in profitability. Its gross margin dropped to 62.3% in Q1 of fiscal 2024, and the net margin fell to 11.1%. Net income was approximately $1.33 billion, down 64.5% year-over-year, marking the first profit decline in over a dozen quarters.
The primary reason for this decline is the integration costs and asset amortization associated with the VMware acquisition, which have negatively impacted Broadcom's overall profitability. In Q2 2024, the effects of these acquisition-related costs began to ease, but in Q3 2024, Broadcom reported a loss due to a one-time tax provision issue. In the coming quarters, we can monitor Broadcom's profitability recovery.
3. Inventory changes
The semiconductor industry is known for its growth potential and cyclical nature. Inventory levels are a key indicator of these cycles and growth expectations. When industry demand falls, and there is an oversupply, inventory levels rise, increasing sales pressure and potentially affecting stock prices. On the flip side, when demand picks up, inventory levels quickly drop, improving sales prospects.
A useful metric for tracking inventory changes is the inventory-to-revenue ratio. A higher ratio means higher inventory levels and more sales pressure.
Broadcom has consistently kept its inventory-to-revenue ratio below 30%, one of the lowest in the industry, highlighting its strong inventory management. However, this ratio does experience some cyclical fluctuations.
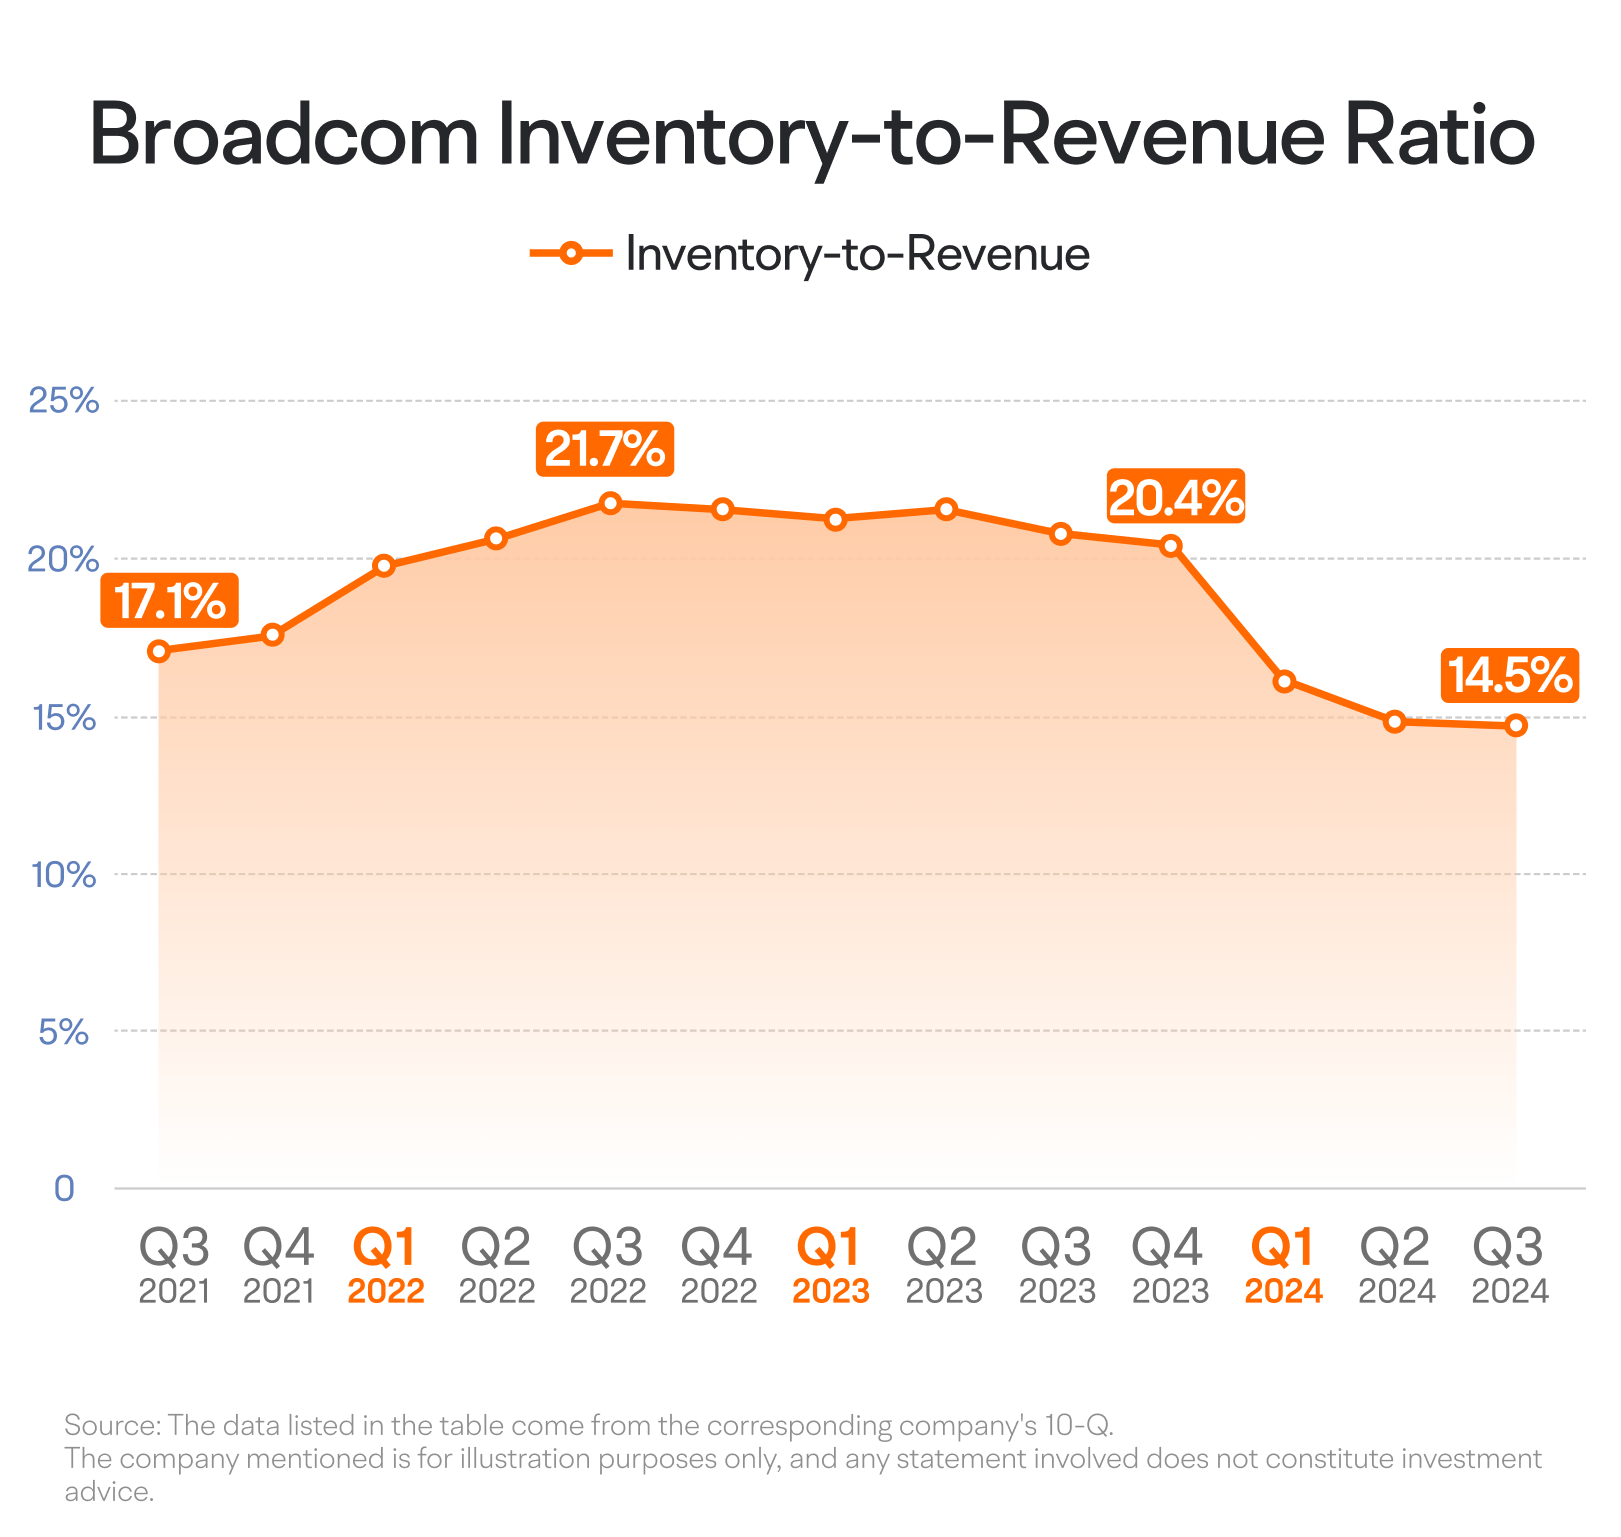
Since the first quarter of fiscal year 2021, Broadcom's inventory-to-revenue ratio has been on the rise, increasing from 14.3% in Q1 2021 to 21.7% in Q3 2022. However, starting from Q4 2023, this ratio began to decline, reaching approximately 14.8% in Q2 2024. In future financial reports, we can continue to monitor Broadcom's inventory-to-revenue ratio to see if it can maintain these historically low levels.
4. Cash flow and shareholder returns
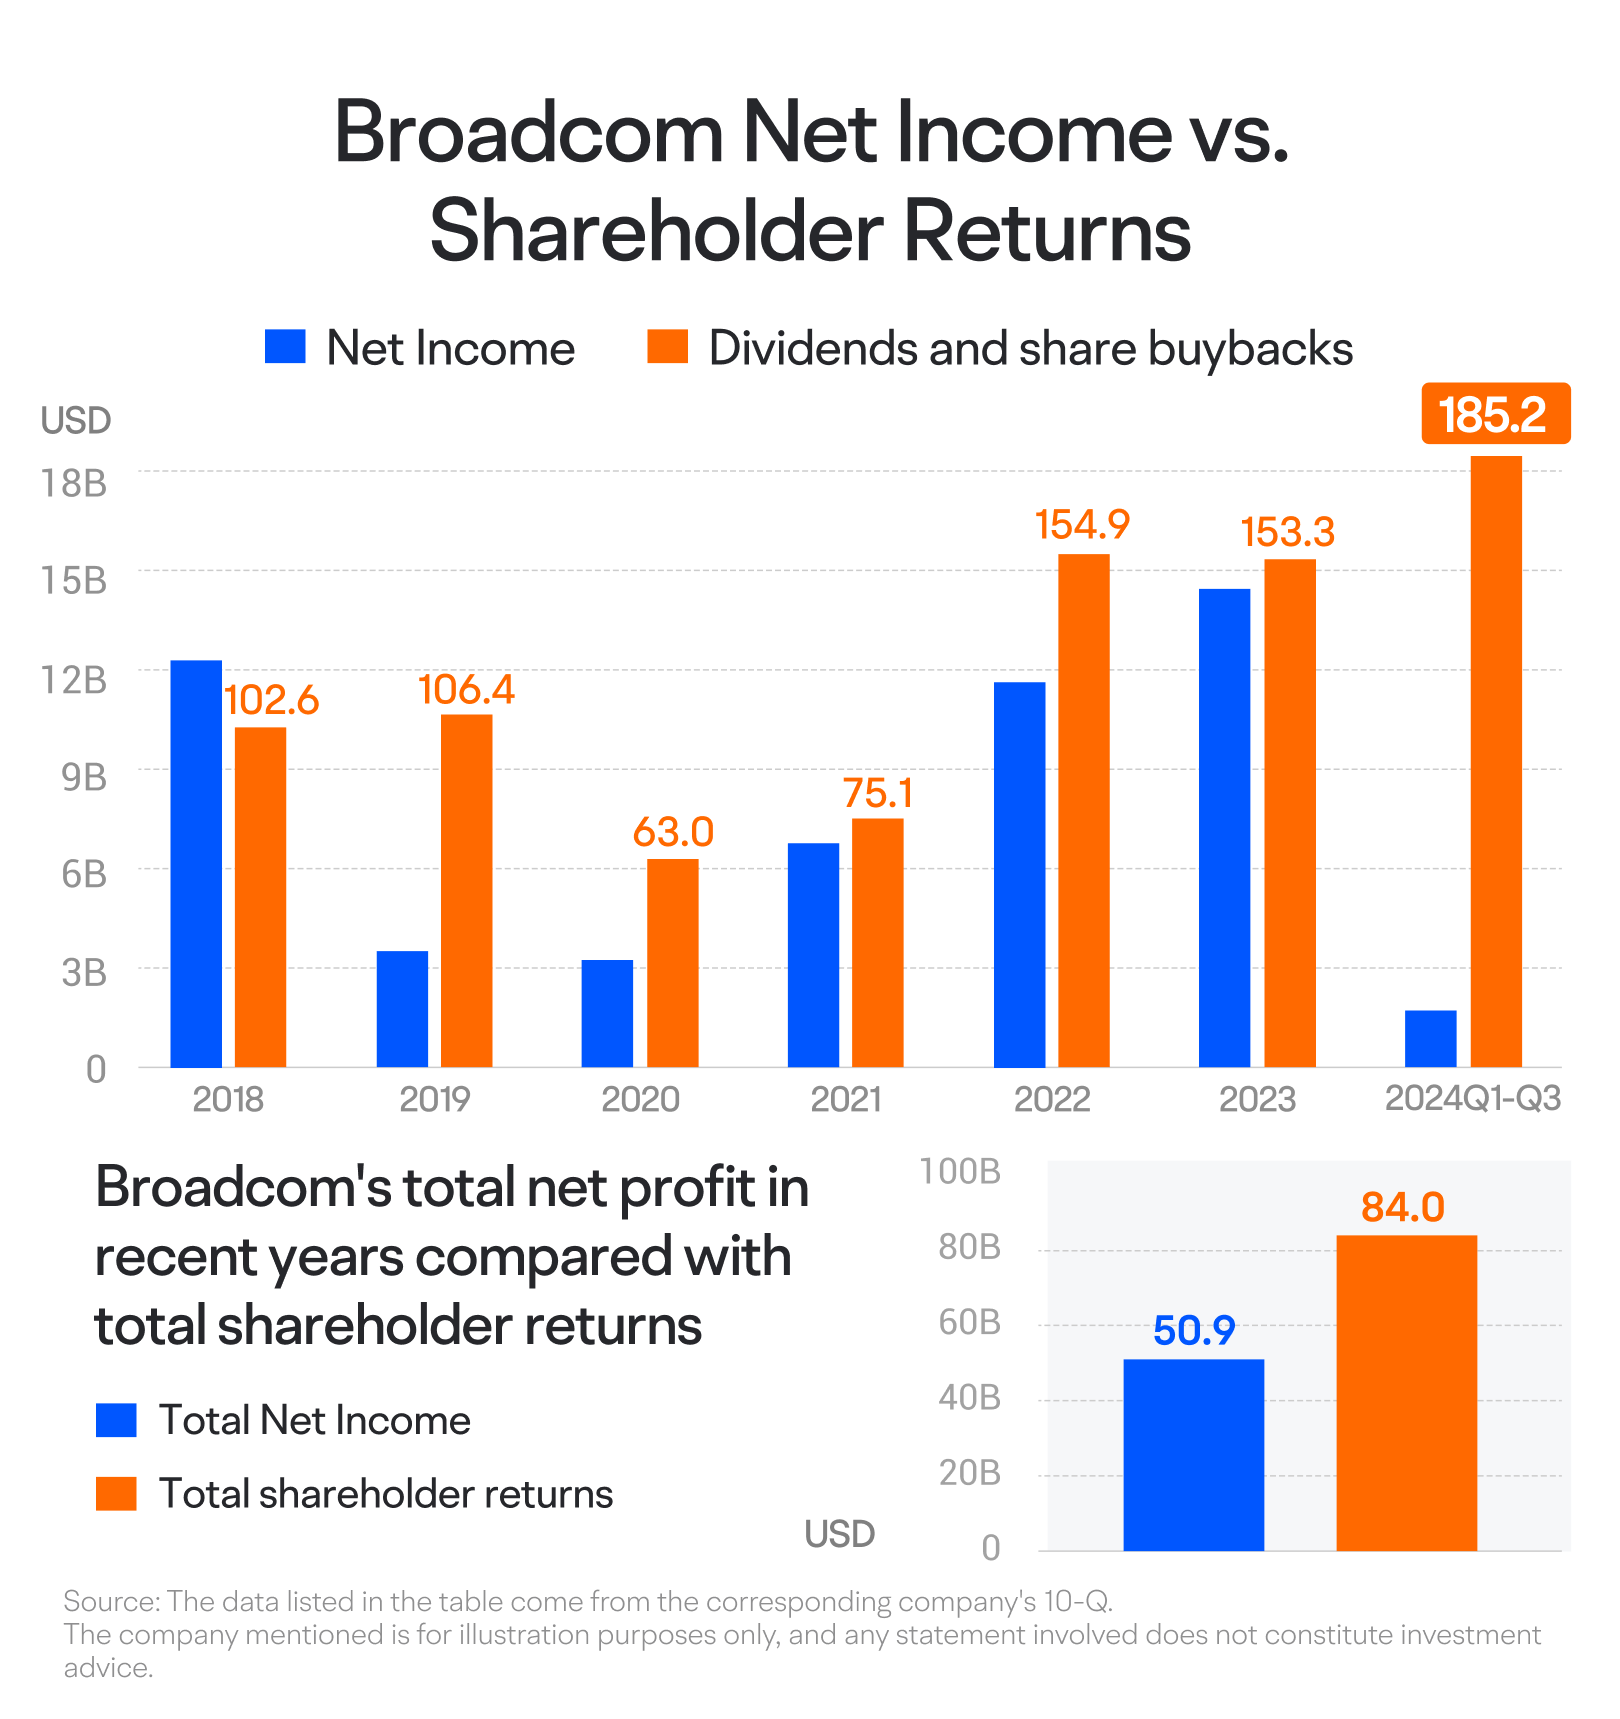
As a major player in the semiconductor industry, Broadcom wields significant influence within the supply chain, resulting in minimal cash tied up in inventory and receivables. This translates to very robust cash flow. Since fiscal year 2018, Broadcom has generated a cumulative free cash flow of $85.5 billion, far exceeding its adjusted net income of less than $50 billion for the same period.
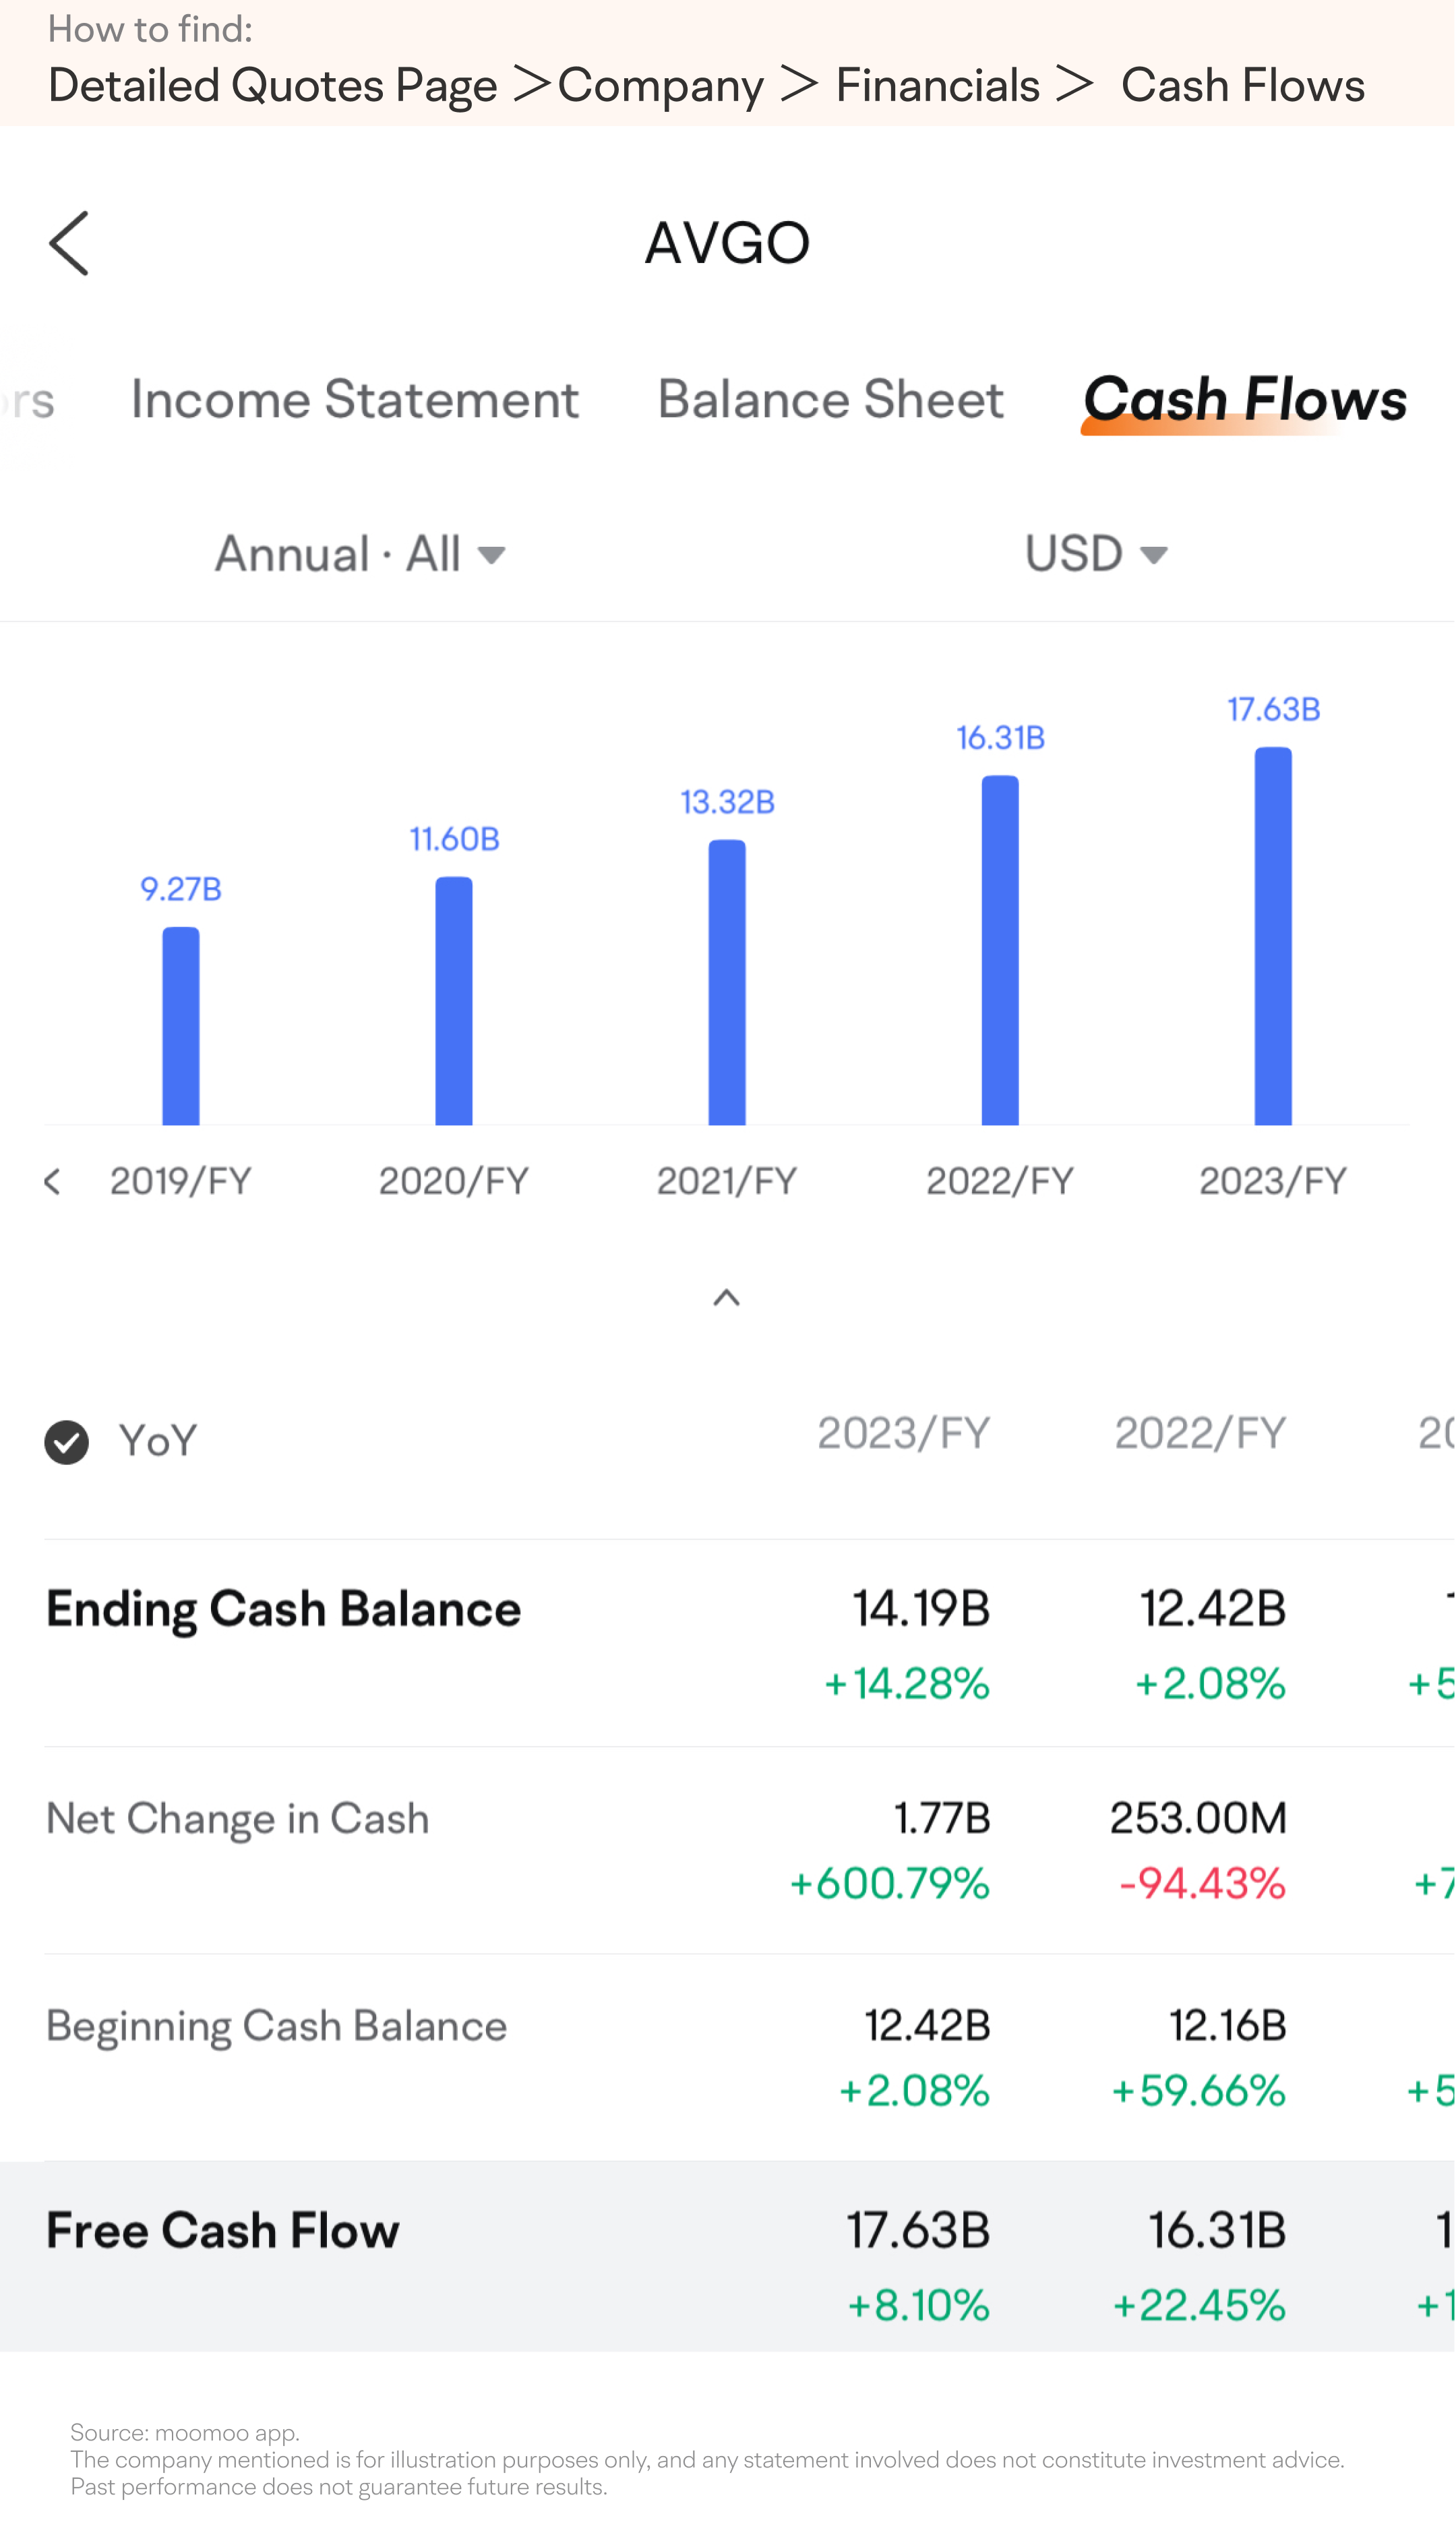
Broadcom primarily uses its cash flow for business acquisitions and returning value to shareholders. In the U.S. stock market, many companies reward shareholders through dividends and share buybacks. Dividends provide direct returns to shareholders, while buybacks can enhance the company's return on equity and earnings per share, inject additional liquidity into the market, and boost stock prices—a win-win that shareholders greatly appreciate.
From fiscal year 2018 to the first half of fiscal year 2024, Broadcom's cumulative dividends and buybacks totaled $80.2 billion, 1.6 times its adjusted net income over the same period. Notably, in the first half of fiscal year 2024 alone, dividends and buybacks reached $14.7 billion, nearly matching the total for the previous year. This demonstrates Broadcom's generosity in shareholder returns.
In future financial reports, we can continue to monitor whether Broadcom can maintain its strong performance in cash flow and shareholder returns.
Having read this far, you may now have a deeper understanding of how to interpret Broadcom's financial reports. It's noteworthy that the release of earnings reports from prominent companies may present unique trading opportunities for different types of investors.
For instance, if an investor, after analyzing past reports and considering recent developments, believes a company's latest earnings will send positive signals and boost the short-term stock price, they might consider taking a long position. This could involve buying the underlying stock or purchasing call options.
Conversely, if the investor expects the earnings to be unfavorable and potentially pressure the stock price, they might consider taking a short position, either through short selling or buying put options.
If the report's outcome is unclear but volatility is expected, they might use a straddle strategy, buying both calls and puts.
However, investors should carefully assess their risk tolerance, particularly when considering high-risk trades like short selling or options, before making any trading decisions.
Summary
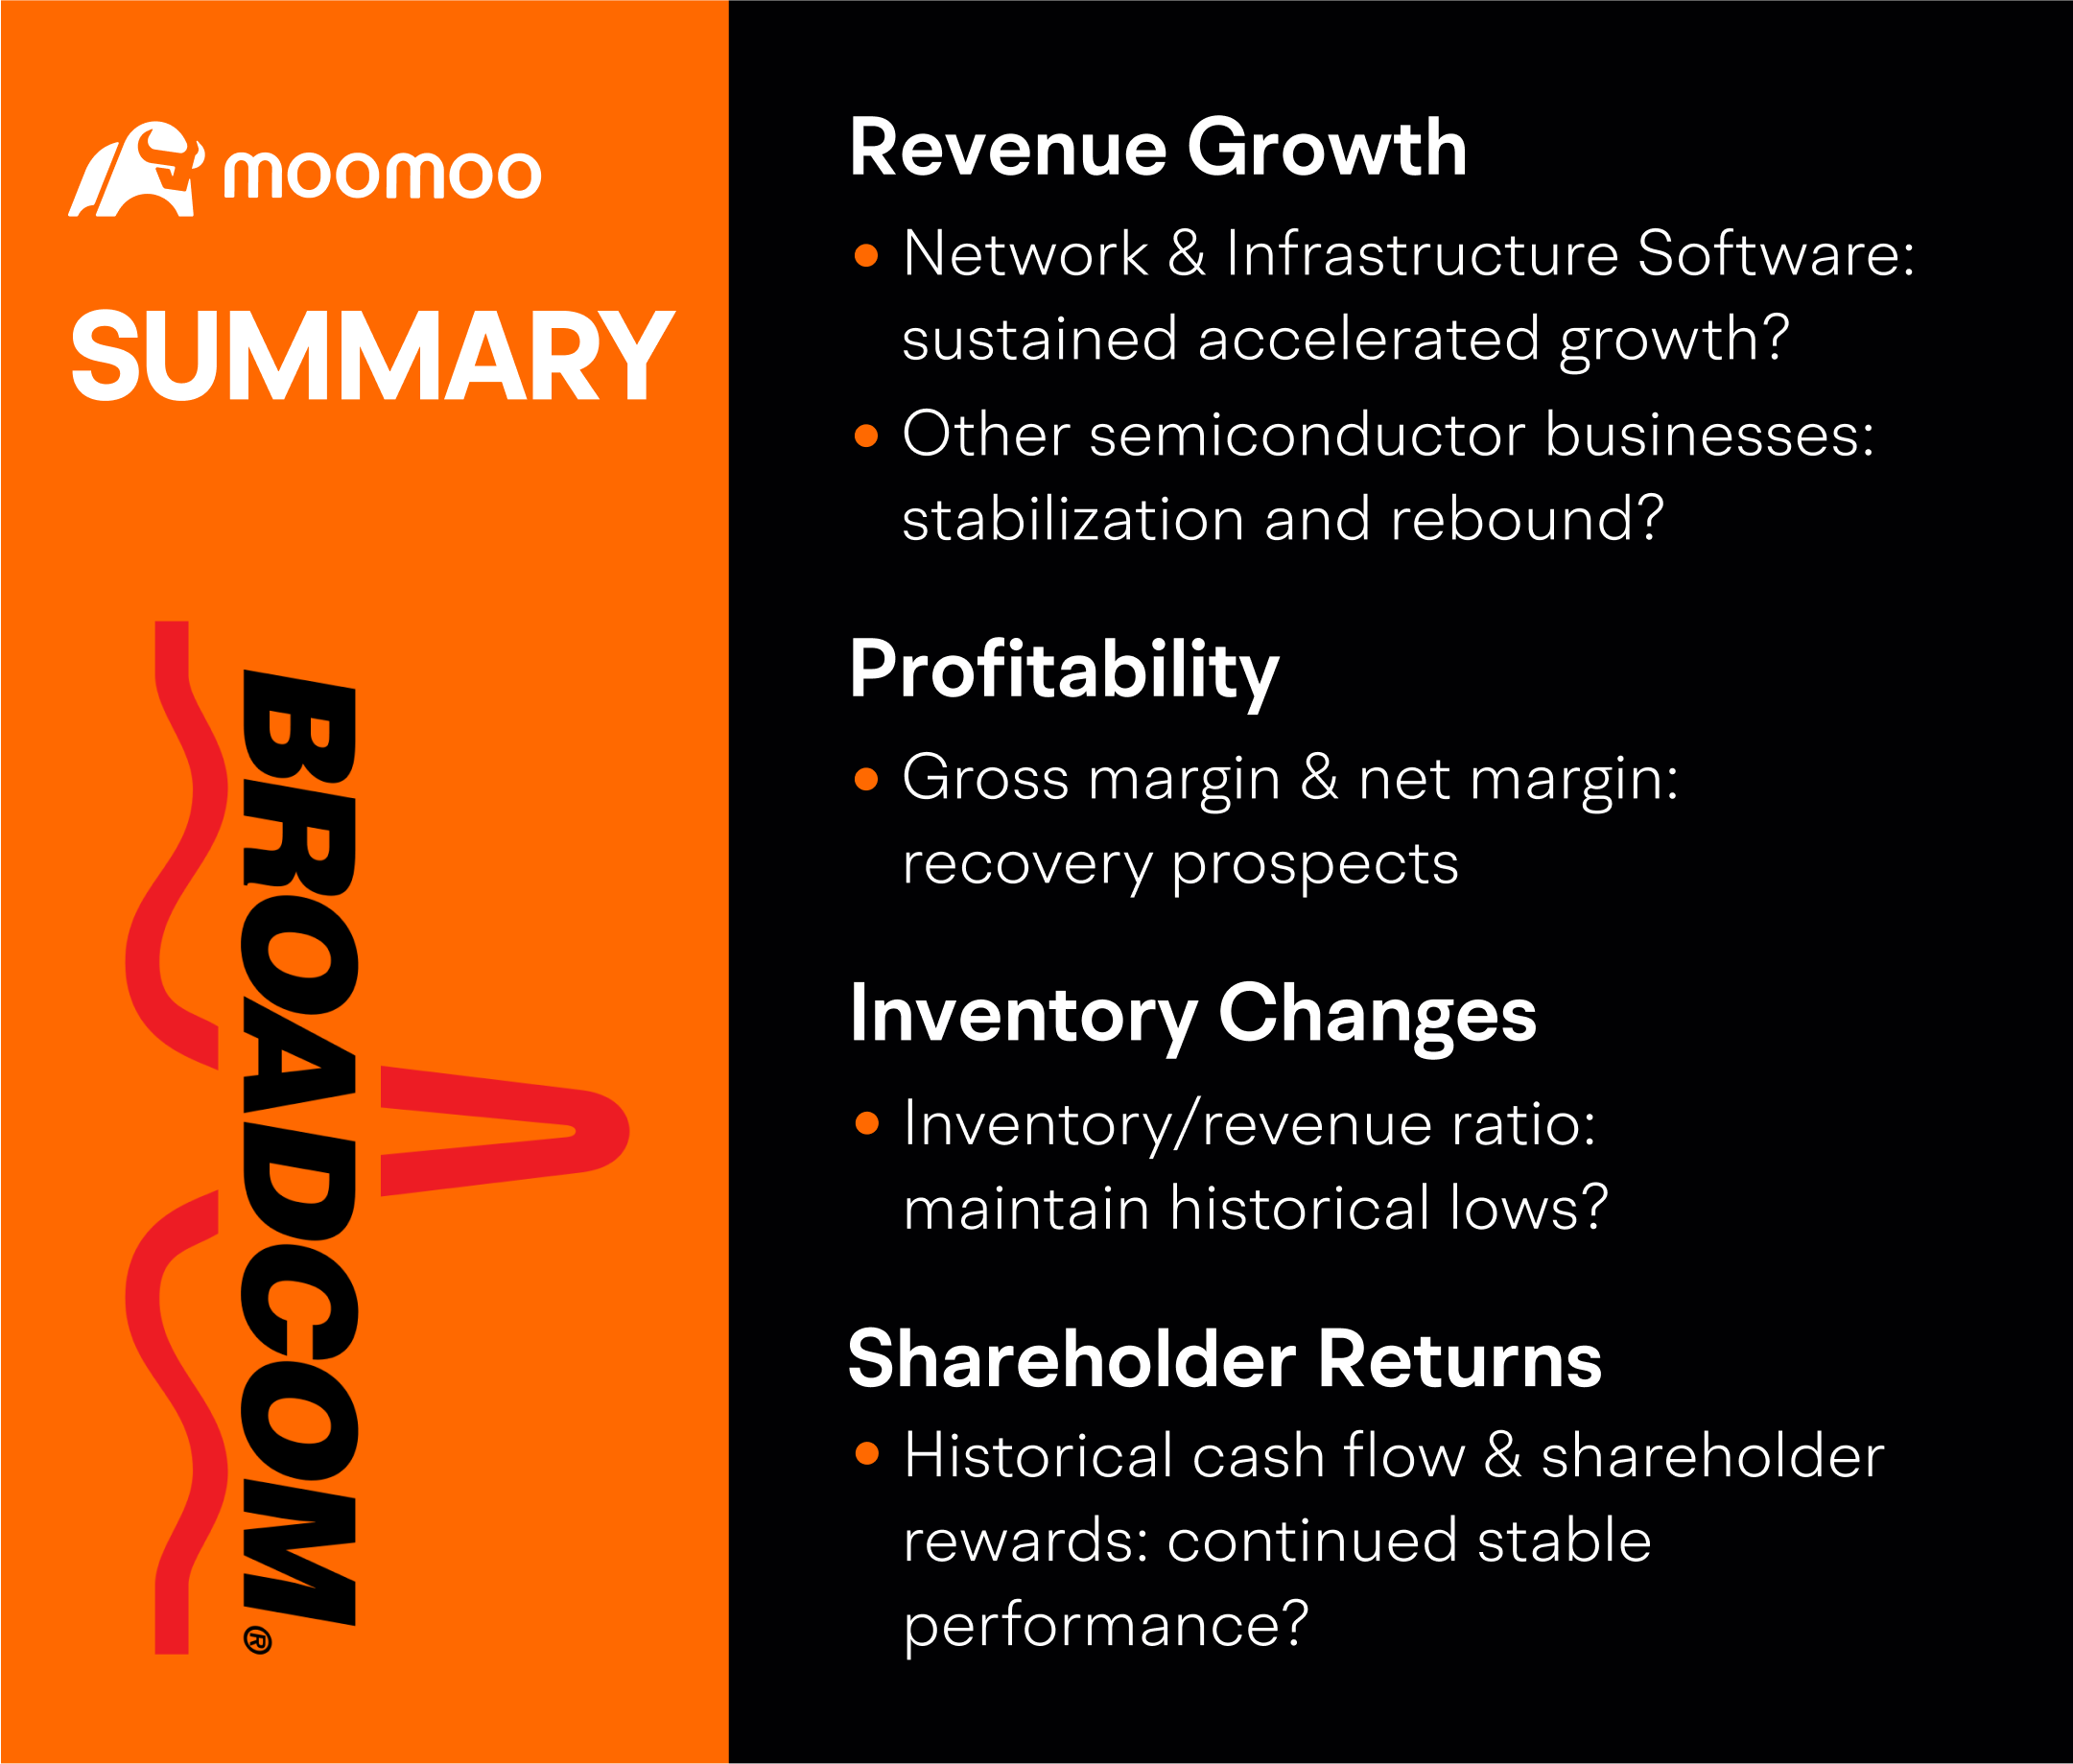
When evaluating Broadcom's performance, we should focus on several key areas: revenue growth, profitability, inventory changes, cash flow, and shareholder returns.
Revenue Growth: Monitor whether Broadcom's network and infrastructure software businesses can sustain accelerated growth. Additionally, keep an eye on the performance of Broadcom's other semiconductor businesses as the industry cycles through recovery phases.
Profitability: Broadcom is currently dealing with integration and amortization expenses following its acquisition of VMware. It will be important to observe any subsequent improvements in its gross and net margins.
Inventory Changes: Broadcom has historically maintained a low inventory-to-revenue ratio. We may continue to monitor whether it can sustain these historically low levels.
Cash Flow and Shareholder Returns: Broadcom has traditionally had strong cash flow and has been generous in returning value to shareholders. We may watch to see if this stable performance continues in the future.
This presentation is for informational and educational use only and is not a recommendation or endorsement of any particular investment or investment strategy. Investment information provided in this content is general in nature, strictly for illustrative purposes, and may not be appropriate for all investors. Read more