

Moomoo Insights
Jul 16 15:38
TSMC Earnings: AI Demand Is Stronger Than the Chip Selloff Suggests
Moomoo Insights
Sep 30 05:04
Live Take | Anthropic’s $518B Compute Bet: Who Wins From the AI Buildout?
When it comes to options trading, understanding metrics like Implied Volatility (IV) Rank & Percentile is key to informed decision-making.
These data points help traders gauge the current level of implied volatility relative to its historical range. This info can be helpful in evaluating the potential risk and reward of a trade.
Read on to learn more about implied volatility rank and percentile, why they matter in options trading, and how to calculate these figures.
Implied Volatility (IV) Rank in options trading shows how the current implied volatility of a security compares to its past levels. By measuring how the current implied volatity of an underlying security compares to its last 52 weeks of historical data, it helps traders see if the current IV is high or low compared to what it has been historically.
IV rank is represented on a scale from 0 to 100, where 0 represents the lowest IV percentage observed during the year, and 100 represents the highest IV percentage. High IV levels may signal a potential opportunity to sell options/volatility, while extremely low IV levels may indicate potential opportunities to buy options/volatility(.)
This metric helps in understanding how options are priced and what market expectations might be. By comparing the current IV to its past range, traders can gauge whether options are priced higher or lower than usual.
Learn more about implied volatility (IV)>>
Imagine a scenario where a stock has an IV rank of 50%. This means that the current implied volatility of the stock is at the midpoint compared to its historical IV range.
If the IV rank is lower, say 20%, it indicates that the current IV is relatively low compared to its historical levels, suggesting potentially lower option premiums.
Vice versa, an IV rank of 80% implies that the current IV is higher, signifying potentially higher option premiums. Traders can potentially use this information to inform their strategic decisions based on the volatility expectations for that particular stock.
IV Rank is calculated by comparing the current IV to its 52-week high and low, then expressing it as a percentage. A high IV Rank indicates that the current IV level is relatively high compared to its historical range, while a low IV Rank suggests that the current IV level is relatively low.
Calculating the Implied Volatility (IV) rank involves these key steps:
Step 1: Determine the current implied volatility percentage of the stock you are analyzing.
Step 2: Identify the lowest implied volatility percentage the stock has experienced in the past 52 weeks.
Step 3: Subtract the 52-week low implied volatility percentage from the current implied volatility percentage.
Step 4: Divide this difference by the range of implied volatility over the past 52 weeks (high IV - low IV).
The calculated IV Rank provides insight into how the current implied volatility compares to its historical range. A higher rank suggests a relatively high current IV, while a lower rank indicates a lower IV compared to past levels.

Implied volatility percentile compares the current IV to its historical values over a specific time period and expresses it as a percentile. For example, if the current IV for a stock is in the 75th percentile, it means that 75% of the time in the past, the IV was lower than its current level.
The IV percentile is calculated by determining where the current IV falls within its historical range, expressed as a percentage. A higher percentile suggests that the current IV is relatively high, while a lower percentile indicates a lower IV compared to past levels.
This metric can help traders better understand option pricing dynamics and market expectations, enabling them to make more informed decisions based on the perceived volatility of the underlying asset.
To calculate the Implied Volatility (IV) percentile, you need to compare the current IV of a security with its past IV levels.
Here's how to calculate IV percentile:
Start by finding where the current IV stands in relation to its historical range.
Count the instances where the IV was lower than the current value and divide this by the total observations.
Multiply the result by 100, then add a percentage symbol to get the IV percentile.
A higher percentile signals a higher current IV, while a lower percentile suggests a lower IV compared to previous periods.
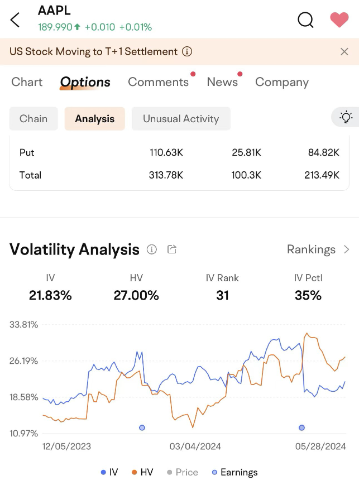
Detailed Quotes of underlying stock > Options > Analysis > Volatility Analysis.
Disclaimer: Images provided are not current and any securities are shown for illustrative purposes only and is not a recommendation.
IV rank shows where the current IV stands compared to its historical range, offering insights into its position relative to past values.
On the flip side, IV percentile calculates how often the IV has been lower than the current level. This metric aids traders in grasping the importance of the current IV within its historical framework.
While IV rank focuses on IV's position, IV percentile highlights the frequency of lower IV values. Both metrics are essential for assessing volatility trends and guiding informed trading decisions.
If you are looking to trade options more efficiently using IV rank and IV percentile, consider leveraging IV rank to evaluate if the current IV is relatively high or low compared to historical levels.
A high IV rank may signal potential "overpricing" of options, while a low rank could suggest underpricing opportunities. IV percentile, on the other hand, compares the current IV to its range over the past year. This can provide a broader perspective on whether options are relatively expensive or cheap.
Additionally, understanding IV percentile can help you recognize how frequently the current IV is at its current level or lower. This, in turn, can help you gauge the significance of the current IV values and make more informed trading choices aligned with market conditions.
While IV rank and IV percentile can be useful in making trading decisions, they should not be used as the sole indicator. Other factors such as market conditions, news events, and company earnings also play a crucial role in determining option prices. For this reason, it's essential to use these metrics as part of a holistic approach to options trading.
Additionally, IV rank and IV percentile may fluctuate over time, so it's important to regularly monitor and update your evaluation based on the current market conditions. Keeping track of these metrics can help you make more informed trading decisions.
IV rank and IV percentile, while related, are not the same. IV rank compares the current implied volatility to its historical range, indicating relative positioning. On the other hand, IV percentile calculates the percentage of time the IV has been lower than the current level, offering a unique perspective on the current IV value within its historical context.
In options trading, the interpretation of high implied volatility (IV) can vary. High IV could suggest increased uncertainty and potentially inflated option prices, which may benefit sellers seeking higher premiums.
On the flip side, high IV might imply greater risk and potential for significant price swings, appealing to traders looking for profit opportunities but also posing higher risks. Ultimately, the perception of high IV as good or bad depends on an individual trader's strategy and risk tolerance.
The 52-week implied volatility (IV) percentile measures the current IV level relative to its range over the past year. This metric provides traders with insights into how the current IV compares to its historical performance within a one-year timeframe. Understanding the 52W IV percentile helps in assessing the volatility environment and making better informed trading decisions based on a longer-term perspective.
Implied volatility reflects the market's expectation of future price fluctuations, impacting options pricing. On the other hand, historical volatility analyzes past price movements to assess how volatile an asset has been. Understanding this contrast is key in evaluating market expectations versus actual historical price behavior when making trading decisions.
Note:
Keep in mind that implied volatility values, IV Rankings, and IV Percentiles are theoretical estimates, and the actual market conditions may not always align with the theoretical information shown. Therefore, traders should exercise caution and use multiple sources of information when making investment decisions. There is no guarantee or assurance that the use of any tools or data provided on the moomoo app will result in investment success or reduce investment risk.
This presentation is for informational and educational use only and is not a recommendation or endorsement of any particular investment or investment strategy. Investment information provided in this content is general in nature, strictly for illustrative purposes, and may not be appropriate for all investors. Read more
Recommend
Moomoo Offers Extended Trading Hours for Options Trading on Oct 19
At-the-Money (ATM) - How It Works in Options Trading
Out-of-the-Money in Options Trading - How It Works & Examples

Covered Call: A Comprehensive Guide to Options Trading
Strangle Options Strategy - A Helpful Guide for Traders
Straddle vs. Strangle: Understanding the Key Differences
Triple Witching: Understanding Its Impact on the Stock Market
Underlying Asset: Definition, Types and Examples
What Are Option Premiums
Covered Calls and Covered Puts - Strategies for Options Trading
Expiration Date in Options Trading
Options Break-Even Point: Definition, Formula, and Examples
Credit Spread: Definition, Examples & How to Calculate
Bull Put Spread: Definitions, How It Works & Examples
How to Manage Your Risk in Options Trading
How to Pick the 'Right' Strike Price
Options Wheel Strategy Explained: Definition and How to Trade
Long Collar Options Strategy: Definition, How It Works & Examples
Long Call Options Strategy: Definition, Potential Benefits, and Risks
Exercise of Options: When and How to Exercise Options
Time Value: Definition, Calculation, Importance in Options Trading
Short Call Options Strategy: Guide & Examples
What Are Bitcoin ETF Options: Investment Insights & Strategies
Hedge with Options: Protect Your Portfolio in 2026
Options Chains: Definition, How to Read and Analyze Them
Options Profit Calculation: Overview, Formula & Examples
What is Theta in Options Trading: Overview and Strategies
Debit Spread: Definition, Types & Examples
Butterfly Spread: Definition and Application in Options Trading
What Is an Options Screener and How to Use?
Unusual Options Activity: Insights and Strategies for Traders
Protective Put Strategy: Definition, How It Works & Examples
What Are Stock Options: Types, How They Work and Examples
Weekly vs. Monthly Options: Choosing the Right Expiration Date
How to Practice Options Trading with Demo Trading Account
Sell to Open vs Sell to Close: Understanding the Difference
Long Put: Definition, Examples and How to Trade
Iron Condor: Understanding This Options Trading Strategy
Diagonal Spread: Definition, Types & How to Use
Implied Volatility (IV) Rank & Percentile in Options Trading
Trading Earnings with Options
Iron Butterfly: Mastering the Options Trading Strategy
Interest Rate Options: Definition & How They Work
Options Buy to Open vs Buy to Close: What's the difference?
Vertical Spread: Definition, Types, & Examples
Bear Put Spread: An Options Trading Strategy Explained
What is a Dividend Reinvestment Plan (DRIP)?
Put/Call Ratio (PCR): Definition & How to Use
How Are Options Priced? | Calculation and Examples
Naked Calls Options Strategy: Definition & How It Works
Options Vs. Futures: Understanding Their Key Differences
Extrinsic Value: Definition, Calculation, and Trading Strategies
Intrinsic Value: How It Works And How To Calculate It
Bull Call Spread - Examples and Applications in Options Trading
Index Options: Definitions, Strategies and Risks
Short Put Options: Strategies and Risks Explained
Quadruple Witching: How It Can Affect the Stock Market
What Are Options? Everything You Need to Know before Trading
Four Option Trading Strategies for Beginners
10 Options Strategies to Enhance Your Trading Portfolio
American Options vs. European Options
In-The-Money (ITM): Call and Put Options Examples
What is a Calendar Spread?
Open Interest: What it means for traders and investors
Options vs Stocks: Choosing the Right Investment Strategy
Options Strike Prices Explained: A Complete Guide for Beginners
Call vs Put Options: Your Essential Guide to the Basics
Zero Days to Expiration (0DTE) Options: Trade Mag 7 Stock Options Today
What Is An Options Contract? How Does It Work?
What is Synthetic Put? (How Does It Work)
How and When to Roll Covered Calls
Option Volume vs Open Interest: Understanding the Difference
4 Options Trading Levels
How to Trade Options for Beginners?
What Is Implied Volatility (IV)?
What Are Cash Secured Puts: How To Sell Them
What Is a Straddle Options Strategy?
What Is Ratio Spread in Options
What is a Call Option: Strategies and Tips
Taxes on Stocks: How Selling Stocks Affects Your Taxes
Option Greeks Explained - Option Greek Cheat Sheet
Put Options: Hedging Your Portfolio
Put Options: How to Use Them in Your Trading Strategy
Poor Man's Covered Call (PMCC): A Beginner's Guide
Four Option Trading Mistakes to Avoid
Trading Synthetic Options: Risks and Rewards
Call Spread vs. Put Spread: What are the differences?
What is stock options trading
What Is Margin Call and How Can You Avoid the Risks?
Options Trading Strategies: Iron Condor vs. Iron Butterfly
Moomoo Offers Extended Trading Hours for Options Trading on Oct 19
At-the-Money (ATM) - How It Works in Options Trading
Out-of-the-Money in Options Trading - How It Works & Examples
Covered Call: A Comprehensive Guide to Options Trading
Strangle Options Strategy - A Helpful Guide for Traders
Straddle vs. Strangle: Understanding the Key Differences
Triple Witching: Understanding Its Impact on the Stock Market
Underlying Asset: Definition, Types and Examples
What Are Option Premiums
Covered Calls and Covered Puts - Strategies for Options Trading
Expiration Date in Options Trading
Options Break-Even Point: Definition, Formula, and Examples
Credit Spread: Definition, Examples & How to Calculate
Bull Put Spread: Definitions, How It Works & Examples
How to Manage Your Risk in Options Trading
How to Pick the 'Right' Strike Price
Options Wheel Strategy Explained: Definition and How to Trade
Long Collar Options Strategy: Definition, How It Works & Examples
Long Call Options Strategy: Definition, Potential Benefits, and Risks
Exercise of Options: When and How to Exercise Options
Time Value: Definition, Calculation, Importance in Options Trading
Short Call Options Strategy: Guide & Examples
What Are Bitcoin ETF Options: Investment Insights & Strategies
Hedge with Options: Protect Your Portfolio in 2026
Options Chains: Definition, How to Read and Analyze Them
Options Profit Calculation: Overview, Formula & Examples
What is Theta in Options Trading: Overview and Strategies
Debit Spread: Definition, Types & Examples
Butterfly Spread: Definition and Application in Options Trading
What Is an Options Screener and How to Use?
Unusual Options Activity: Insights and Strategies for Traders
Protective Put Strategy: Definition, How It Works & Examples
What Are Stock Options: Types, How They Work and Examples
Weekly vs. Monthly Options: Choosing the Right Expiration Date
How to Practice Options Trading with Demo Trading Account
Sell to Open vs Sell to Close: Understanding the Difference
Long Put: Definition, Examples and How to Trade
Iron Condor: Understanding This Options Trading Strategy
Diagonal Spread: Definition, Types & How to Use
Implied Volatility (IV) Rank & Percentile in Options Trading
Trading Earnings with Options
Iron Butterfly: Mastering the Options Trading Strategy
Interest Rate Options: Definition & How They Work
Options Buy to Open vs Buy to Close: What's the difference?
Vertical Spread: Definition, Types, & Examples
Bear Put Spread: An Options Trading Strategy Explained
What is a Dividend Reinvestment Plan (DRIP)?
Put/Call Ratio (PCR): Definition & How to Use
How Are Options Priced? | Calculation and Examples
Naked Calls Options Strategy: Definition & How It Works
Options Vs. Futures: Understanding Their Key Differences
Extrinsic Value: Definition, Calculation, and Trading Strategies
Intrinsic Value: How It Works And How To Calculate It
Bull Call Spread - Examples and Applications in Options Trading
Index Options: Definitions, Strategies and Risks
Short Put Options: Strategies and Risks Explained
Quadruple Witching: How It Can Affect the Stock Market
What Are Options? Everything You Need to Know before Trading
Four Option Trading Strategies for Beginners
10 Options Strategies to Enhance Your Trading Portfolio
American Options vs. European Options
In-The-Money (ITM): Call and Put Options Examples
What is a Calendar Spread?
Open Interest: What it means for traders and investors
Options vs Stocks: Choosing the Right Investment Strategy
Options Strike Prices Explained: A Complete Guide for Beginners
Call vs Put Options: Your Essential Guide to the Basics
Zero Days to Expiration (0DTE) Options: Trade Mag 7 Stock Options Today
What Is An Options Contract? How Does It Work?
What is Synthetic Put? (How Does It Work)
How and When to Roll Covered Calls
Option Volume vs Open Interest: Understanding the Difference
4 Options Trading Levels
How to Trade Options for Beginners?
What Is Implied Volatility (IV)?
What Are Cash Secured Puts: How To Sell Them
What Is a Straddle Options Strategy?
What Is Ratio Spread in Options
What is a Call Option: Strategies and Tips
Taxes on Stocks: How Selling Stocks Affects Your Taxes
Option Greeks Explained - Option Greek Cheat Sheet
Put Options: Hedging Your Portfolio
Put Options: How to Use Them in Your Trading Strategy
Poor Man's Covered Call (PMCC): A Beginner's Guide
Four Option Trading Mistakes to Avoid
Trading Synthetic Options: Risks and Rewards
Call Spread vs. Put Spread: What are the differences?
What is stock options trading
What Is Margin Call and How Can You Avoid the Risks?
Options Trading Strategies: Iron Condor vs. Iron Butterfly