Moomoo Insights
Jul 16 15:38
TSMC Earnings: AI Demand Is Stronger Than the Chip Selloff Suggests
Moomoo Insights
Sep 30 05:04
Live Take | Anthropic’s $518B Compute Bet: Who Wins From the AI Buildout?
Understanding how to read options chains is important for anyone interested in options trading. An option chain provides detailed information about the various options available for a particular stock or asset, including their strike prices, expiration dates, and premiums.
For beginners, navigating an option chain can be overwhelming, but with a solid grasp of its key components, you'll be better equipped to analyze potential trades and make informed decisions. In this guide, we’ll break down an option chain's essential elements and explain how to read and interpret it step-by-step.
An option chain (also known as an options table) is a listing of all available options contracts for a specific underlying asset, such as a stock, index, or exchange-traded fund (ETF). It shows detailed information about each option contract, including various strike prices, expiration dates, and premiums for both call and put options.
An option chain is organized primarily by expiration dates and strike prices, with call options on the left side and put options on the right side. It shows important data points like bid-ask prices, trading volume, open interest, and last trade prices, which help traders make informed decisions. It’s an essential tool for those trading options, enabling them to see all the available contracts for a particular underlying asset.
The underlying asset in an option chain refers to the financial asset (such as a stock, commodity, or index) on which the options contracts are based. The options give the holder the right to buy or sell the underlying asset at a specific price (the strike price) within a certain time frame (until the expiration date).
Within the moomoo desktop trading app, users can find different options and contract types as follows. Navigate to options by clicking the "Options" tab on the left navigation bar, or through the options section of an equity page.
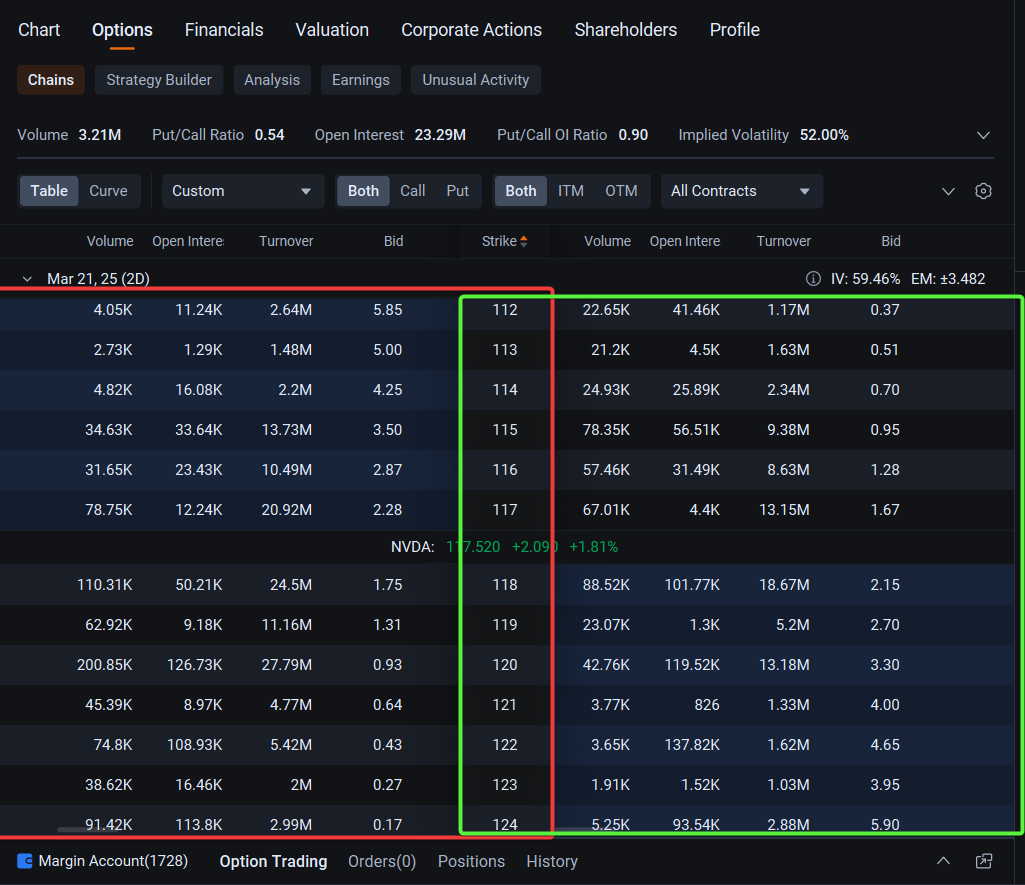
Call options, shown on the left within a red border edited into the picture, give the holder the right to buy the underlying asset at the strike price before the option expires.
Put options, listed on the right side of the option chain in green, give the holder the right to sell the underlying asset at the strike price before the option expires.
Both call and put options share the middle column, like a Venn diagram, which shows the contract strike price.
Both call and or Put options are defined by a complicated ticker, taking the form of: XXX 250317 500C.
XXX (the underlying ticker symbol) 25 03 17 (the year, month, and specific date of expiration) 500C (the underlying price point of the option contract, and a C or P for a call or put.
The strike price in an options chain refers to the price at which the underlying asset (e.g. a stock) can be bought or sold when the option is exercised. It is a key component of an options contract and plays a critical role in determining the potential profitability of the trade.
For call options, the strike price is the price at which the holder of the option can buy the underlying asset, and for put options, the strike price is the price at which the holder of the option can sell the underlying asset.
The premium is the cost to buy an option, and it can consist of both intrinsic and extrinsic value. Intrinsic value refers to to the real, tangible value of an option if it were exercised right now and represents the amount an option is in the money (ITM). Extrinsic value refers to the portion of an option's price that is not related to its intrinsic value; it is influenced by time value and implied volatility of the option.
Premium reflects the market's perception of an option's potential to be profitable and is influenced by factors like time to expiration, the price of the underlying asset, and market volatility.
The expiration date is the specific date on which the options contract expires, meaning the option holder must either exercise the option or let it expire worthless. After the expiration date, the option is no longer valid, and the right to buy or sell the underlying asset at the strike price disappears.
The bid and ask prices represent the current prices at which an option can be bought or sold. They are key components in understanding the liquidity and potential cost of entering or exiting an options position.
Open interest tells you how many options contracts are still open and have not been exercised, closed, or expired. It is a measure of market activity and liquidity. Volume reflects how many options contracts have been traded during a specific period and gives insight into short-term market activity and sentiment.
Both metrics are important in analyzing the health and liquidity of an options contract and can provide clues about market trends and potential price movements.
Implied volatility (IV) represents the market's expectations for the future volatility of the underlying asset's price. It reflects how much the market anticipates the asset’s price will fluctuate over the life of the option. Unlike historical volatility, which looks at past price movements, IV is forward-looking and helps traders gauge market sentiment and the level of uncertainty.
Moneyness refers to the relationship between the current price of the underlying asset (like a stock) and the strike price of an options contract. It determines the intrinsic value of the option and plays a key role in evaluating whether an option is likely to be exercised profitably at expiration.
Let's use Nvidia (NVDA) as an example with this screenshot from the moomoo options trading app. Here's an explanation:
Row: Displays data for different strike prices, including current price, trading activity, and open interest.
Contract: Represents 100 shares. For example, a bid of 6.25 means $625 (6.25 x 100) to buy 100 shares.
Bid and ask: Shows the market prices for buying or selling the option. The "bid" represents the highest price a buyer is willing to pay for an option contract, while the "ask" represents the lowest price a seller is willing to accept for the same contract.
Volume: Reflects today’s trading activity.
Open interest: Shows the number of outstanding contracts.
Change and % change: Indicates how the option’s price has moved today.
Analyzing an options chain involves evaluating various data points to assess the potential for making profitable trades, based on factors such as the current price of the underlying asset, strike price, expiration date, implied volatility, volume, open interest, and moneyness.
Here's a few considerations.
Consider expiration dates that align with your price target and timeframe. Further out expiration dates give more time for your trade to work out but also generally have higher premiums.
Compare premiums for similar strikes—evaluate whether you could be "overpaying," particularly if implied volatility is high.
Check liquidity by looking at open interest and volume data to allow for easier entry and exit of positions.
Review the option's delta, to understand how sensitive the option is to changes in the underlying asset's price. The delta represents the estimated change in an option's price for every $1 change in the price of the underlying asset. A delta closer to -1 means the put option is more sensitive to changes in the underlying asset's price. Consider a higher delta if you expect significant price drops.
Here's a few considerations.
Analyze put options across different strike prices to identify potential support levels (where a high volume of puts is bought), areas where the asset's price might experience a sharp drop and to identify potential imbalances and potential profit opportunities. Increasing volume and open interest in out-of-the-money (OTM) puts could suggest that traders are anticipating a significant price decline. Compare these indicators with the current price of the underlying asset to evaluate if the market expects considerable downside movement.
High open interest indicates that the option is actively traded, which generally means higher liquidity and easier market access.
If implied volatility is high, options will be more expensive. This can work to your advantage if you're anticipating a large price move but can also erode potential profits if volatility is priced too high.
If you’re buying puts, remember that time decay can reduce your option’s value. Plan to allow for enough time for the asset to move in your favor before the option expires.
By reviewing these factors, you can assess an option’s liquidity.
High open interest indicates high liquidity, making trades easier, while low open interest suggests lower liquidity.
High volume means active trading and good liquidity, whereas low volume signals lower liquidity, possibly leading to slippage. Slippage is when the price at which an order is executed differs from the price that was requested. It can occur when the market is volatile, or when there isn't enough demand for an asset.
A narrow bid-ask spread suggests high liquidity and smaller transaction costs, while a wide spread signals lower liquidity and higher execution costs.
High IV suggests more market interest, improving liquidity, while low IV may indicate lower liquidity.
ATM options typically have the highest liquidity, while ITM/OTM options may have lower liquidity but can still be liquid in volatile markets.
To contrast implied volatility (IV) in an option chain, compare the IV values of different options within the chain, particularly focusing on variations based on strike price, expiration date, and the overall market sentiment, with higher IV indicating a greater expectation of price movement and lower IV suggesting a more stable price environment.
The Greeks in options trading are advanced metrics that help traders understand how different factors affect the price of options. These functions are used to assess risk and develop strategies. Here’s an overview of how each of the key Greeks functions within an options chain:
Delta indicates how much an option's price is expected to change for every $1 movement in the price of the underlying asset, essentially showing the sensitivity of an option's price to changes in the underlying stock price.
Gamma refers to the rate of change in an option’s delta in response to a $1 movement in the price of the underlying asset, essentially measuring how much the delta (the option's sensitivity to the price of the underlying asset) will change as the asset price moves.
Theta measures how much an option's value decreases as time passes (known as time decay). With a high theta, option value decays quickly, benefiting sellers and disadvantaging buyers. For a low theta, time decay is slower, allowing the option to retain more value.
For buyers, time decay works against you, while for sellers, it works in your favor, especially as expiration nears.
Vega measures an option’s sensitivity to changes in IV. With a high vega, the option’s price is more affected by volatility changes but with a low vega, the option’s price is less sensitive to volatility.
For buyers, rising volatility increases option value, while for sellers, falling volatility decreases it.
Rho measures an option’s sensitivity to changes in interest rates. It is positive for long calls and short puts while it is negative for short calls and long puts.
For call options, a positive rho means prices increase with higher interest rates while for put options, a negative Rho means prices decrease with higher interest rates. Rho is more significant for long-term options or during interest rate changes.
Investors and traders can find an option chain in a few different places. These sources allow traders to view key data such as strike prices, expiration dates, volume, open interest, and bid-ask spreads.
Most brokers (e.g., TD Ameritrade, E*TRADE, Fidelity, Charles Schwab and moomoo) provide access to options chains within their trading platforms or mobile apps.
Websites like Yahoo Finance, MarketWatch, and Nasdaq offer options chains for individual stocks and ETFs.
Advanced trading platforms such as moomoo provide detailed options chains.
Options exchanges like CBOE (Chicago Board Options Exchange) or NASDAQ OMX, though these platforms are more technical and may require a subscription.
Option chain analysis itself is not inherently bullish or bearish, but rather provides insights into market sentiment by examining the distribution of call and put options, where high volume of call option open interest identifies a bullish sentiment; a high volume of put option open interest suggests a bearish sentiment.
When reading "OI" (open interest) in an option chain it shows how many contracts are still active for a specific strike price and expiration date. A high OI indicates significant market interest in that particular option, signifying potential liquidity and active trading around that strike price. A lower "OI" (Open Interest) in an option chain indicates that there are fewer outstanding contracts for that specific option, meaning less market activity and potentially lower liquidity, making it harder to buy or sell that option at a desired price due to a lack of interested traders.
When reading an option chain, "IV" represents the "Implied Volatility," which is a percentage figure showing the market's expectation of how much the underlying stock price will move up or down during the option's lifespan; a higher IV indicates a higher expected price fluctuation, meaning the market anticipates more volatility, while a lower IV suggests a more stable price environment.
This presentation is for informational and educational use only and is not a recommendation or endorsement of any particular investment or investment strategy. Investment information provided in this content is general in nature, strictly for illustrative purposes, and may not be appropriate for all investors. Read more
Recommend
Moomoo Offers Extended Trading Hours for Options Trading on Oct 19
At-the-Money (ATM) - How It Works in Options Trading
Out-of-the-Money in Options Trading - How It Works & Examples

Covered Call: A Comprehensive Guide to Options Trading
Strangle Options Strategy - A Helpful Guide for Traders
Straddle vs. Strangle: Understanding the Key Differences
Triple Witching: Understanding Its Impact on the Stock Market
Underlying Asset: Definition, Types and Examples
What Are Option Premiums
Covered Calls and Covered Puts - Strategies for Options Trading
Expiration Date in Options Trading
Options Break-Even Point: Definition, Formula, and Examples
Credit Spread: Definition, Examples & How to Calculate
Bull Put Spread: Definitions, How It Works & Examples
How to Manage Your Risk in Options Trading
How to Pick the 'Right' Strike Price
Options Wheel Strategy Explained: Definition and How to Trade
Long Collar Options Strategy: Definition, How It Works & Examples
Long Call Options Strategy: Definition, Potential Benefits, and Risks
Exercise of Options: When and How to Exercise Options
Time Value: Definition, Calculation, Importance in Options Trading
Short Call Options Strategy: Guide & Examples
What Are Bitcoin ETF Options: Investment Insights & Strategies
Hedge with Options: Protect Your Portfolio in 2026
Options Chains: Definition, How to Read and Analyze Them
Options Profit Calculation: Overview, Formula & Examples
What is Theta in Options Trading: Overview and Strategies
Debit Spread: Definition, Types & Examples
Butterfly Spread: Definition and Application in Options Trading
What Is an Options Screener and How to Use?
Unusual Options Activity: Insights and Strategies for Traders
Protective Put Strategy: Definition, How It Works & Examples
What Are Stock Options: Types, How They Work and Examples
Weekly vs. Monthly Options: Choosing the Right Expiration Date
How to Practice Options Trading with Demo Trading Account
Sell to Open vs Sell to Close: Understanding the Difference
Long Put: Definition, Examples and How to Trade
Iron Condor: Understanding This Options Trading Strategy
Diagonal Spread: Definition, Types & How to Use
Implied Volatility (IV) Rank & Percentile in Options Trading
Trading Earnings with Options
Iron Butterfly: Mastering the Options Trading Strategy
Interest Rate Options: Definition & How They Work
Options Buy to Open vs Buy to Close: What's the difference?
Vertical Spread: Definition, Types, & Examples
Bear Put Spread: An Options Trading Strategy Explained
What is a Dividend Reinvestment Plan (DRIP)?
Put/Call Ratio (PCR): Definition & How to Use
How Are Options Priced? | Calculation and Examples
Naked Calls Options Strategy: Definition & How It Works
Options Vs. Futures: Understanding Their Key Differences
Extrinsic Value: Definition, Calculation, and Trading Strategies
Intrinsic Value: How It Works And How To Calculate It
Bull Call Spread - Examples and Applications in Options Trading
Index Options: Definitions, Strategies and Risks
Short Put Options: Strategies and Risks Explained
Quadruple Witching: How It Can Affect the Stock Market
What Are Options? Everything You Need to Know before Trading
Four Option Trading Strategies for Beginners
10 Options Strategies to Enhance Your Trading Portfolio
American Options vs. European Options
In-The-Money (ITM): Call and Put Options Examples
What is a Calendar Spread?
Open Interest: What it means for traders and investors
Options vs Stocks: Choosing the Right Investment Strategy
Options Strike Prices Explained: A Complete Guide for Beginners
Call vs Put Options: Your Essential Guide to the Basics
Zero Days to Expiration (0DTE) Options: Trade Mag 7 Stock Options Today
What Is An Options Contract? How Does It Work?
What is Synthetic Put? (How Does It Work)
How and When to Roll Covered Calls
Option Volume vs Open Interest: Understanding the Difference
4 Options Trading Levels
How to Trade Options for Beginners?
What Is Implied Volatility (IV)?
What Are Cash Secured Puts: How To Sell Them
What Is a Straddle Options Strategy?
What Is Ratio Spread in Options
What is a Call Option: Strategies and Tips
Taxes on Stocks: How Selling Stocks Affects Your Taxes
Option Greeks Explained - Option Greek Cheat Sheet
Put Options: Hedging Your Portfolio
Put Options: How to Use Them in Your Trading Strategy
Poor Man's Covered Call (PMCC): A Beginner's Guide
Four Option Trading Mistakes to Avoid
Trading Synthetic Options: Risks and Rewards
Call Spread vs. Put Spread: What are the differences?
What is stock options trading
What Is Margin Call and How Can You Avoid the Risks?
Options Trading Strategies: Iron Condor vs. Iron Butterfly
Moomoo Offers Extended Trading Hours for Options Trading on Oct 19
At-the-Money (ATM) - How It Works in Options Trading
Out-of-the-Money in Options Trading - How It Works & Examples
Covered Call: A Comprehensive Guide to Options Trading
Strangle Options Strategy - A Helpful Guide for Traders
Straddle vs. Strangle: Understanding the Key Differences
Triple Witching: Understanding Its Impact on the Stock Market
Underlying Asset: Definition, Types and Examples
What Are Option Premiums
Covered Calls and Covered Puts - Strategies for Options Trading
Expiration Date in Options Trading
Options Break-Even Point: Definition, Formula, and Examples
Credit Spread: Definition, Examples & How to Calculate
Bull Put Spread: Definitions, How It Works & Examples
How to Manage Your Risk in Options Trading
How to Pick the 'Right' Strike Price
Options Wheel Strategy Explained: Definition and How to Trade
Long Collar Options Strategy: Definition, How It Works & Examples
Long Call Options Strategy: Definition, Potential Benefits, and Risks
Exercise of Options: When and How to Exercise Options
Time Value: Definition, Calculation, Importance in Options Trading
Short Call Options Strategy: Guide & Examples
What Are Bitcoin ETF Options: Investment Insights & Strategies
Hedge with Options: Protect Your Portfolio in 2026
Options Chains: Definition, How to Read and Analyze Them
Options Profit Calculation: Overview, Formula & Examples
What is Theta in Options Trading: Overview and Strategies
Debit Spread: Definition, Types & Examples
Butterfly Spread: Definition and Application in Options Trading
What Is an Options Screener and How to Use?
Unusual Options Activity: Insights and Strategies for Traders
Protective Put Strategy: Definition, How It Works & Examples
What Are Stock Options: Types, How They Work and Examples
Weekly vs. Monthly Options: Choosing the Right Expiration Date
How to Practice Options Trading with Demo Trading Account
Sell to Open vs Sell to Close: Understanding the Difference
Long Put: Definition, Examples and How to Trade
Iron Condor: Understanding This Options Trading Strategy
Diagonal Spread: Definition, Types & How to Use
Implied Volatility (IV) Rank & Percentile in Options Trading
Trading Earnings with Options
Iron Butterfly: Mastering the Options Trading Strategy
Interest Rate Options: Definition & How They Work
Options Buy to Open vs Buy to Close: What's the difference?
Vertical Spread: Definition, Types, & Examples
Bear Put Spread: An Options Trading Strategy Explained
What is a Dividend Reinvestment Plan (DRIP)?
Put/Call Ratio (PCR): Definition & How to Use
How Are Options Priced? | Calculation and Examples
Naked Calls Options Strategy: Definition & How It Works
Options Vs. Futures: Understanding Their Key Differences
Extrinsic Value: Definition, Calculation, and Trading Strategies
Intrinsic Value: How It Works And How To Calculate It
Bull Call Spread - Examples and Applications in Options Trading
Index Options: Definitions, Strategies and Risks
Short Put Options: Strategies and Risks Explained
Quadruple Witching: How It Can Affect the Stock Market
What Are Options? Everything You Need to Know before Trading
Four Option Trading Strategies for Beginners
10 Options Strategies to Enhance Your Trading Portfolio
American Options vs. European Options
In-The-Money (ITM): Call and Put Options Examples
What is a Calendar Spread?
Open Interest: What it means for traders and investors
Options vs Stocks: Choosing the Right Investment Strategy
Options Strike Prices Explained: A Complete Guide for Beginners
Call vs Put Options: Your Essential Guide to the Basics
Zero Days to Expiration (0DTE) Options: Trade Mag 7 Stock Options Today
What Is An Options Contract? How Does It Work?
What is Synthetic Put? (How Does It Work)
How and When to Roll Covered Calls
Option Volume vs Open Interest: Understanding the Difference
4 Options Trading Levels
How to Trade Options for Beginners?
What Is Implied Volatility (IV)?
What Are Cash Secured Puts: How To Sell Them
What Is a Straddle Options Strategy?
What Is Ratio Spread in Options
What is a Call Option: Strategies and Tips
Taxes on Stocks: How Selling Stocks Affects Your Taxes
Option Greeks Explained - Option Greek Cheat Sheet
Put Options: Hedging Your Portfolio
Put Options: How to Use Them in Your Trading Strategy
Poor Man's Covered Call (PMCC): A Beginner's Guide
Four Option Trading Mistakes to Avoid
Trading Synthetic Options: Risks and Rewards
Call Spread vs. Put Spread: What are the differences?
What is stock options trading
What Is Margin Call and How Can You Avoid the Risks?
Options Trading Strategies: Iron Condor vs. Iron Butterfly