
Moomoo Insights
Jul 16 15:38
TSMC Earnings: AI Demand Is Stronger Than the Chip Selloff Suggests
Moomoo Insights
Sep 30 05:04
Live Take | Anthropic’s $518B Compute Bet: Who Wins From the AI Buildout?
The purpose of trend analysis, which is a component of technical analysis, is to attempt to forecast future changes in stock prices by examining previously gathered trend data. Long-term market sentiment can be predicted using trend analysis, which looks at past data, including price changes and transaction volume.
The analysis of trends is performed by computing them using numerical data. This data is commonly comprised of past information. It may take the shape of conventional data, such as a firm's success as determined by its publicly available financial statement, or data that includes the number of job ads made by a rival over the previous five years. When numerical data is added to a chart, three distinct patterns can be seen.
A positive trend, also known as an uptrend or an upward trend, indicates that the values of your pieces of data are growing. This might have a variety of interpretations, depending on the kind of variable you are investigating and the goal you are trying to accomplish.
If you're a bread manufacturer and you've noticed that the cost of wheat has been creeping upward, you're in the same boat as other manufacturers. Depending on how you use this information, you can draw various conclusions, such as a rise in expenses for your company or the need to charge higher rates to the ultimate customer.
Similarly, a trader monitoring the stock price of Company X might choose to acquire shares if they detect that the price has been trending higher. The movement of a stock's price in the upward direction is often indicative of a good situation, which may assist you in determining whether or not the stock would be a suitable purchase.
The opposite of an upward trend is a declining value, which is what you would expect to see if your variable were declining. For instance, if a company's profits suddenly take a significant dive, this may necessitate investors to proceed with extreme care when purchasing the company's shares because of the inherent risk of the stock's falling price. This is also true in situations where other economic or financial factors are moving negatively.
Researchers looking into financial assets may use the asset's historical data for trend analysis. This price moving indicates a negative market in a downward trend. There is a possibility that the prices would continue to fall, which would result in a loss.
Lastly, the horizontal line represents a state of doing nothing. To put it another way, the prices and other relevant measures are neither increasing nor decreasing; rather, they remain the same.
In reality, a flat trend may show an increase for one time, followed by a trend reversal, before settling into a broad, stable direction. It is risky to base investment choices on horizontal trends since it is impossible to predict what the future holds. To quantify the risks involved, an in-depth income and cost study about the different sales locations needs to be carried out before you determine whether or not to proceed with the plan.
Traders who focus on trends endeavor to identify profitable opportunities within them and capitalize on them. Trading with trends may be done in many ways, and each technique uses a particular set of technical indicators.
Moving Averages: Using these tactics, a trader would initiate long positions when a short-term moving average passes above a long-term moving average, and would look to exit a long position when a short-term moving average crosses under a long-term moving average.
Momentum Indicators: According to these methods, long positions are entered when security moves strongly, and exited when the security loses momentum. The relative strength index, also known as RSI, is one indicator that is frequently utilized in these strategies.
Trendlines & Chart Patterns: Taking long positions and placing a stop-loss order below critical trendline support levels are both elements of these trading methods. Long positions are taken when an asset is exhibiting a higher-trending price movement. If the stock begins to move in the other direction, the trade is closed out at a profit.
Indicators can help make sense of complex price data, suggest trading opportunities in an existing trend, or flag impending trend reversals. In addition to being applicable across all available time frames, these systems also have adaptable parameters that may be fine-tuned to meet the needs of individual traders.
The mentioned applications of each indication aren't the only ones possible. If you like an indication, you should do more study on it, and most importantly, you should try it out before you use it to make real trades.
There are 15 technical indicators on the moomoo trading app with a comprehensive analysis of stocks, like the Stochastic Oscillator Indicator (KDJ), Moving Average Convergence Divergence (MACD), Relative Strength Index (RSI), and more. Traders and investors can easily identify the trends with the interpretation of these technical indicators.
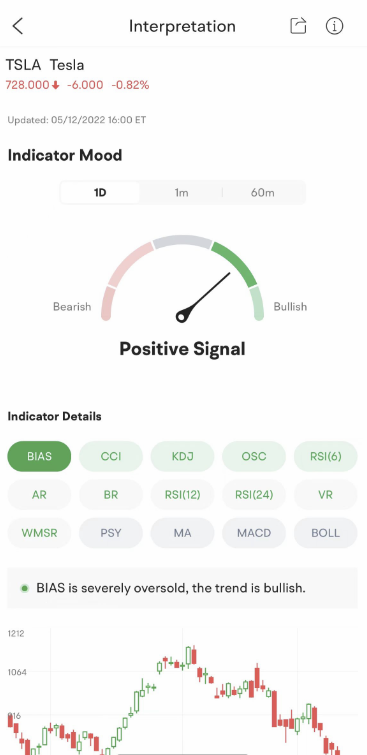
Images provided are not current and any securities are shown for illustrative purposes only.
One of the most important challenges in trend forecasting is locating turning times. When seen in perspective, turning points are straightforward to recognize. However, when examined in the present, it may be difficult to determine whether or not they represent simple aberrations or the beginning of new trends.
Estimates made over a longer period of time need more data, which may not always be accessible. In particular for a newly established company or product range. In any case, the deeper one looks into the future, the greater the chance of making errors since the passage of time always introduces new factors.
Therefore, it is essential to review your data from trend analysis and act only if you are certain in your marketplace reading.
In addition to its effectiveness as a clear instrument for analyzing investment performance, trend analysis has many additional advantages.
A company's relative strength over competitors in the same industry may be gauged by comparing its performance during the same time period with that of other companies in the same industry.
The examination of trends may be used for various numerical data types, such as conventional data (such as income or expenditures) and alternative data (website traffic, customer complaints, POS transactions, and many more).
According to the information, you should be able to utilize these long-term trends to find patterns that can be acted upon. Afterward, these patterns might be used to make predictions.
Using trend analysis, you may check for discrepancies in your interim financial statements and determine whether any corrections need to be made before the statements are made public.
Using trend analysis, you can investigate the whole stock market in search of indications of prospective trend shifts, either for the better or the worse.
Generally, shareholders and company owners may benefit from doing trend research. In light of the abundance of data that is now available, the value of data-driven choices cannot be separated from the importance of trend analysis, particularly when using alternative data.
Using alternative data enables you to do a more in-depth study, giving you an edge over a portion of your competition that is not using external data effectively. A study of trends driven by data is a wonderful method to identify better business prospects and a terrific way to anticipate future occurrences, which can improve your investing intelligence.
This presentation is for informational and educational use only and is not a recommendation or endorsement of any particular investment or investment strategy. Investment information provided in this content is general in nature, strictly for illustrative purposes, and may not be appropriate for all investors. Read more
Recommend
How to Trade During High Volatility (VIX > 25)
How to Day Trade Without $25,000
How to Start Day Trading for Beginners

Swing Trading Basics: Strategies & How It Works
How to Practice Day Trading (Day Trading Simulator Guide)
Intraday Trading Basics: How to Start & Benefits
ETF Tax Refund Guide: Understand Your Investment Returns
Stock Trading: A Beginner's Guide
How to Start Investing: A Beginner's Guide
How to Invest in Gold: Learn the Basics
Ethereum ETFs: How To Trade Spot Ethereum ETFs
What Is Copy Trading
What to Consider When Shifting from Paper Trading to Actual Trading
Investing During Earnings Season
How Stock Charting Tools Can Help You
What is Thematic Investing?
What Is Social Trading
6 ETF Concerns That Investors Shouldn’t Overlook
What Is Mirror Trading?
Company Earnings and Earnings per Share What Investors Need to Know
How to Use Paper Trading to Test and Help Refine Your Trading Strategy?
How to Practice Trading Without Risking Money?
Tax Trading Strategies in a Bear Market
What Are Market Orders?
Using Volume Oscillators to Confirm Price Movements
Price-to-Earnings (P/E) Ratio
What Is Working Capital?
What Is SWOT Analysis?
Choosing a Stock Simulator to Practice Stock Trading
What Is Revenue?
What Is A Recession?
Psychological Condition of the Market
What Is Beta in the Stock Market?
On-Balance Volume (OBV): What Is It?
What Is the Money Flow Index (MFI)?
Spot Market: What Is It?
What Does It Mean to Have a Certificate of Deposit (CD)?
What Is a Bellwether?
What Is the Spot Rate?
What Is a Volatility Smile?
What Is Historical Volatility (HV)?
What is Buying on Margin?
What Is Barbell Strategy?
How to Analyse Short Sale Volume in Trading
Trading Stocks Short: Overview
What is short selling?
Will ESG Investing Be The Future Of Investing?
How to Invest in the Hong Kong Stock Exchange - What Investors Should Know
Level 2 Market Data: How Advanced Traders Can Identify Value
Swing Trading vs. Day Trading: What's the Difference?
What Is a Day Order?
What Is the National Best Bid and Offer (NBBO) in US Equities?
What is Short Covering?
How to Find A Stock's Number of Shorted Shares?
What Is Trend Analysis?
TOP 10 Day Trading Strategies for Beginners
VWAP Trading Strategy - Volume Weighted Average Price
What is Maintenance Margin?
What Is Market Depth?
What Is Short Interest?
What Is a Trailing Stop and How to Use It?
Stock Split: Stock Trading Strategies for Advanced Traders
Scalping Stock Trading: How Does It Work?
Trading as a Side Hustle: How to get started
How to Pick Stocks: Invest Smarter with Stock Screener
Is Swing Trading More Profitable than Long-Term Trading?
Trade In A Bear Market With Short Sales
How to Trade During High Volatility (VIX > 25)
How to Day Trade Without $25,000
How to Start Day Trading for Beginners
Swing Trading Basics: Strategies & How It Works
How to Practice Day Trading (Day Trading Simulator Guide)
Intraday Trading Basics: How to Start & Benefits
ETF Tax Refund Guide: Understand Your Investment Returns
Stock Trading: A Beginner's Guide
How to Start Investing: A Beginner's Guide
How to Invest in Gold: Learn the Basics
Ethereum ETFs: How To Trade Spot Ethereum ETFs
What Is Copy Trading
What to Consider When Shifting from Paper Trading to Actual Trading
Investing During Earnings Season
How Stock Charting Tools Can Help You
What is Thematic Investing?
What Is Social Trading
6 ETF Concerns That Investors Shouldn’t Overlook
What Is Mirror Trading?
Company Earnings and Earnings per Share What Investors Need to Know
How to Use Paper Trading to Test and Help Refine Your Trading Strategy?
How to Practice Trading Without Risking Money?
Tax Trading Strategies in a Bear Market
What Are Market Orders?
Using Volume Oscillators to Confirm Price Movements
Price-to-Earnings (P/E) Ratio
What Is Working Capital?
What Is SWOT Analysis?
Choosing a Stock Simulator to Practice Stock Trading
What Is Revenue?
What Is A Recession?
Psychological Condition of the Market
What Is Beta in the Stock Market?
On-Balance Volume (OBV): What Is It?
What Is the Money Flow Index (MFI)?
Spot Market: What Is It?
What Does It Mean to Have a Certificate of Deposit (CD)?
What Is a Bellwether?
What Is the Spot Rate?
What Is a Volatility Smile?
What Is Historical Volatility (HV)?
What is Buying on Margin?
What Is Barbell Strategy?
How to Analyse Short Sale Volume in Trading
Trading Stocks Short: Overview
What is short selling?
Will ESG Investing Be The Future Of Investing?
How to Invest in the Hong Kong Stock Exchange - What Investors Should Know
Level 2 Market Data: How Advanced Traders Can Identify Value
Swing Trading vs. Day Trading: What's the Difference?
What Is a Day Order?
What Is the National Best Bid and Offer (NBBO) in US Equities?
What is Short Covering?
How to Find A Stock's Number of Shorted Shares?
What Is Trend Analysis?
TOP 10 Day Trading Strategies for Beginners
VWAP Trading Strategy - Volume Weighted Average Price
What is Maintenance Margin?
What Is Market Depth?
What Is Short Interest?
What Is a Trailing Stop and How to Use It?
Stock Split: Stock Trading Strategies for Advanced Traders
Scalping Stock Trading: How Does It Work?
Trading as a Side Hustle: How to get started
How to Pick Stocks: Invest Smarter with Stock Screener
Is Swing Trading More Profitable than Long-Term Trading?
Trade In A Bear Market With Short Sales

