
Moomoo Insights
Jul 16 15:38
TSMC Earnings: AI Demand Is Stronger Than the Chip Selloff Suggests
Moomoo Insights
Sep 30 05:04
Live Take | Anthropic’s $518B Compute Bet: Who Wins From the AI Buildout?
An example of a technical oscillator is the Money Flow Index (MFI), which considers both price and volume information to determine if an asset is now overbought or oversold. It is also feasible to use it to identify divergences, alerting traders to a price trend shift. The oscillator has a range that goes from 0 to 100.
The Money Flow Index, in contrast to more traditional oscillators such as the Relative Strength Index (RSI), takes into account price and volume information rather than relying solely on price data. Because of this, some market observers refer to the MFI as the volume-weighted RSI.
Raw Money Flow is considered positive and contributes to Positive Money Flow if there is an increase from one period to the subsequent price. If the price decline over time causes a negative Raw Money Flow, that amount is added to the negative Negative Money Flow.
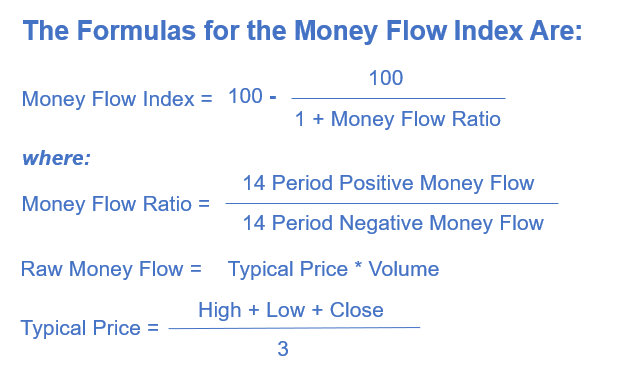
In order to determine the Money Flow Index, there are a few processes that need to be taken. You should use a worksheet if you are doing it by hand.
1. Calculate the price considered "typical" for each of the previous 14 periods.
2. Put a checkmark next to each period in which the average price was either greater or lower than the previous period. A positive or negative raw cash flow may be deduced from this.
3. The raw money flow may be calculated by multiplying the usual price by the volume for that time period. You may use either negative or positive values, depending on whether the period was an increase or a decrease (see step above).
4. To determine the money flow ratio, compile a list of all the positive money flows that have occurred throughout the previous 14 periods. Then, divide this total by the total number of negative money flows that have occurred throughout the previous 14 periods.
5. Perform the Money Flow Index (MFI) calculation by using the ratio discovered in step four.
6. Continue to do the computations as the end of each new period approaches, but this time use the data just from the last 14 periods.
When there is a divergence, it's one of the important ways to utilize the Money Flow Index. When the oscillator moves in the opposite direction of the price, this phenomenon is known as a divergence. This indicates that the current price trend may be about to turn around and go in the other direction.
For instance, if the Money Flow Index is very high and drops below 80 while the underlying security continues to rise, this might hint at a downward price reversal. On the other hand, a very low MFI value that goes above a reading of 20 as the underlying asset continues to sell off is a price reversal indication to the upside.
In addition, traders keep an eye out for greater divergences by monitoring the price and MFI using numerous waves. For instance, a share of the stock reaches its high of $10, then falls to $8, and then recovers to $12. At $10 and $12, respectively, the price has reached two consecutive all-time highs. Assuming the price hits $12 if MFI makes a lower high at that point, the indicator is not validating the new high. This can be an indication that the price will go down.
Potential trading opportunities might be indicated by observing the overbought and oversold levels. It is unusual for a move to occur below 10 or over 90. Traders keep an eye out for the MFI to go back above 10 to indicate a long trade, and they keep an eye out for the MFI to dip below 90 to indicate a short trade.
It may also be beneficial to make further swings away from overbought or oversold conditions. For instance, if the price of an asset is trending upwards, a dip below 20 (or even 30) and then a rise back above it might suggest that a pullback is coming to an end and that the price uptrend is about to resume. The opposite is true for a downward trend. A short-term rally may boost the MFI up to 70 or 80.
The MFI has the potential to produce erroneous indications. This occurs when the indicator exhibits behavior that suggests a good chance for trading is available. However, the price does not move in the anticipated direction, resulting in a loss transaction. For example, a divergence may not always result in a reversal in price.
It's also conceivable that the indication won't give you a heads-up about anything crucial. For instance, even while there is a chance that divergence may lead to a price reversal part of the time, there is no guarantee that this will always be the case. Because of this, it is strongly suggested that traders use many methods of analysis and risk management rather than relying on a single indication to make their decisions.
In Australia, financial products and services available through the moomoo app are provided by Futu Securities (Australia) Ltd, an Australian Financial Services Licensee (AFSL No. 224663) regulated by the Australian Securities and Investment Commission (ASIC). Please read and understand our Financial Services Guide, Terms and Conditions, Privacy Policy and other disclosure documents which are available on our websites https://www.futuau.com and https://www.moomoo.com/au. Moomoo Technologies Inc., Moomoo Financial Inc., Moomoo Financial Singapore Pte. Ltd. and Futu Securities (Australia) Ltd are affiliated companies.
This presentation is for informational and educational use only and is not a recommendation or endorsement of any particular investment or investment strategy. Investment information provided in this content is general in nature, strictly for illustrative purposes, and may not be appropriate for all investors. Read more
Recommend
How to Trade During High Volatility (VIX > 25)
How to Day Trade Without $25,000
How to Start Day Trading for Beginners

Swing Trading Basics: Strategies & How It Works
How to Practice Day Trading (Day Trading Simulator Guide)
Intraday Trading Basics: How to Start & Benefits
ETF Tax Refund Guide: Understand Your Investment Returns
Stock Trading: A Beginner's Guide
How to Start Investing: A Beginner's Guide
How to Invest in Gold: Learn the Basics
Ethereum ETFs: How To Trade Spot Ethereum ETFs
What Is Copy Trading
What to Consider When Shifting from Paper Trading to Actual Trading
Investing During Earnings Season
How Stock Charting Tools Can Help You
What is Thematic Investing?
What Is Social Trading
6 ETF Concerns That Investors Shouldn’t Overlook
What Is Mirror Trading?
Company Earnings and Earnings per Share What Investors Need to Know
How to Use Paper Trading to Test and Help Refine Your Trading Strategy?
How to Practice Trading Without Risking Money?
Tax Trading Strategies in a Bear Market
What Are Market Orders?
Using Volume Oscillators to Confirm Price Movements
Price-to-Earnings (P/E) Ratio
What Is Working Capital?
What Is SWOT Analysis?
Choosing a Stock Simulator to Practice Stock Trading
What Is Revenue?
What Is A Recession?
Psychological Condition of the Market
What Is Beta in the Stock Market?
On-Balance Volume (OBV): What Is It?
What Is the Money Flow Index (MFI)?
Spot Market: What Is It?
What Does It Mean to Have a Certificate of Deposit (CD)?
What Is a Bellwether?
What Is the Spot Rate?
What Is a Volatility Smile?
What Is Historical Volatility (HV)?
What is Buying on Margin?
What Is Barbell Strategy?
How to Analyse Short Sale Volume in Trading
Trading Stocks Short: Overview
What is short selling?
Will ESG Investing Be The Future Of Investing?
How to Invest in the Hong Kong Stock Exchange - What Investors Should Know
Level 2 Market Data: How Advanced Traders Can Identify Value
Swing Trading vs. Day Trading: What's the Difference?
What Is a Day Order?
What Is the National Best Bid and Offer (NBBO) in US Equities?
What is Short Covering?
How to Find A Stock's Number of Shorted Shares?
What Is Trend Analysis?
TOP 10 Day Trading Strategies for Beginners
VWAP Trading Strategy - Volume Weighted Average Price
What is Maintenance Margin?
What Is Market Depth?
What Is Short Interest?
What Is a Trailing Stop and How to Use It?
Stock Split: Stock Trading Strategies for Advanced Traders
Scalping Stock Trading: How Does It Work?
Trading as a Side Hustle: How to get started
How to Pick Stocks: Invest Smarter with Stock Screener
Is Swing Trading More Profitable than Long-Term Trading?
Trade In A Bear Market With Short Sales
How to Trade During High Volatility (VIX > 25)
How to Day Trade Without $25,000
How to Start Day Trading for Beginners
Swing Trading Basics: Strategies & How It Works
How to Practice Day Trading (Day Trading Simulator Guide)
Intraday Trading Basics: How to Start & Benefits
ETF Tax Refund Guide: Understand Your Investment Returns
Stock Trading: A Beginner's Guide
How to Start Investing: A Beginner's Guide
How to Invest in Gold: Learn the Basics
Ethereum ETFs: How To Trade Spot Ethereum ETFs
What Is Copy Trading
What to Consider When Shifting from Paper Trading to Actual Trading
Investing During Earnings Season
How Stock Charting Tools Can Help You
What is Thematic Investing?
What Is Social Trading
6 ETF Concerns That Investors Shouldn’t Overlook
What Is Mirror Trading?
Company Earnings and Earnings per Share What Investors Need to Know
How to Use Paper Trading to Test and Help Refine Your Trading Strategy?
How to Practice Trading Without Risking Money?
Tax Trading Strategies in a Bear Market
What Are Market Orders?
Using Volume Oscillators to Confirm Price Movements
Price-to-Earnings (P/E) Ratio
What Is Working Capital?
What Is SWOT Analysis?
Choosing a Stock Simulator to Practice Stock Trading
What Is Revenue?
What Is A Recession?
Psychological Condition of the Market
What Is Beta in the Stock Market?
On-Balance Volume (OBV): What Is It?
What Is the Money Flow Index (MFI)?
Spot Market: What Is It?
What Does It Mean to Have a Certificate of Deposit (CD)?
What Is a Bellwether?
What Is the Spot Rate?
What Is a Volatility Smile?
What Is Historical Volatility (HV)?
What is Buying on Margin?
What Is Barbell Strategy?
How to Analyse Short Sale Volume in Trading
Trading Stocks Short: Overview
What is short selling?
Will ESG Investing Be The Future Of Investing?
How to Invest in the Hong Kong Stock Exchange - What Investors Should Know
Level 2 Market Data: How Advanced Traders Can Identify Value
Swing Trading vs. Day Trading: What's the Difference?
What Is a Day Order?
What Is the National Best Bid and Offer (NBBO) in US Equities?
What is Short Covering?
How to Find A Stock's Number of Shorted Shares?
What Is Trend Analysis?
TOP 10 Day Trading Strategies for Beginners
VWAP Trading Strategy - Volume Weighted Average Price
What is Maintenance Margin?
What Is Market Depth?
What Is Short Interest?
What Is a Trailing Stop and How to Use It?
Stock Split: Stock Trading Strategies for Advanced Traders
Scalping Stock Trading: How Does It Work?
Trading as a Side Hustle: How to get started
How to Pick Stocks: Invest Smarter with Stock Screener
Is Swing Trading More Profitable than Long-Term Trading?
Trade In A Bear Market With Short Sales

