Moomoo Insights
Jul 16 15:38
TSMC Earnings: AI Demand Is Stronger Than the Chip Selloff Suggests
Moomoo Insights
Sep 30 05:04
Live Take | Anthropic’s $518B Compute Bet: Who Wins From the AI Buildout?
A volatility smile refers to patterns and graphs that form by plotting the implied volatility and strike price for an option group with an expiration date and underlying asset. The reason behind naming it a volatility smile is its resemblance to a smiling mouth. When an option's underlying asset is further out-of-the-money (OTM) or in-the-money (ITM) than it is at-the-money (ATM), implied volatility increases. Not all options fall under the scope of the volatility smile.
Fundamentals of Volatility Smile
Volatility smiles result from changes in implied volatility due to the movement of underlying assets more towards ITM or OTM. It would further lead to greater implied volatility. For ATM options, implied volatility would be the lowest.
Although the Black-Scholes model is the primary method for measurement of price options and other derivatives, it doesn't predict the volatility smile. Instead, this model predicts a flat implied volatility curve against varying strike prices. Moreover, it forecasts the same implied volatility for all options with the same underlying assets expiring on the same date. However, the reality is different.
Following the 1987 stock market crash, volatility smiles began to appear in option pricing. They weren't previously present in American markets, indicating a market structure more consistent with what the Black-Scholes model predicts. Following 1987, traders understood that severe outcomes could appear and that markets have a substantial skew. The pricing of options required to consider the potential for dramatic events. That's why implied volatility rises or falls with an increase in OTM or ITM. [1]
Moreover, a volatility smile indicates a higher demand for OTM and ITM than ATM. The erratic Prices are driven by demand, which impacts implied volatility. The aforementioned factor may partially cause this. Extreme incidents can result in significant price changes in options. Implied volatility takes into account the potential for substantial shifts.
When comparing options with the same underlying asset and expiration date but different strike prices, volatility smiles can be observed. There can be a U-shape if the implied volatility is shown for the various strike prices. However, the U-shape sometimes has a different shape than seen in the graph below.
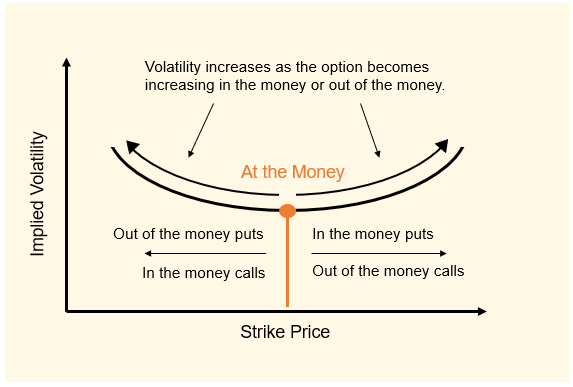
Consider an options chain that consists of implied volatility with different strike prices. A U-shaped option indicates that options with the same OTM and ITM have the same implied volatility. More OTM or ITM represents the higher implied volatility. On the other hand, ATM options represent the lowest implied volatilities.
It was also possible to plot the implied volatility of a single option over time and the underlying asset's value. The implied volatility may resemble a U shape as the price moves in or out of the money.
This may be helpful if you're looking for an option with reduced implied volatility. You could potentially pick an option near the money in this scenario. Select a further ITM or OTM option if you want more implied volatility. But remember that the implied volatility will change when the underlying asset moves closer to or further away from the strike price. As a result, regular realignment is essential to maintain a portfolio of options with certain implied volatility.
Alignment of all options with volatility smile is optional. Verify that the option's implied volatility genuinely adheres to the smile model before employing the volatility smile for trading decisions.
Finding out whether the option being traded genuinely corresponds with a volatility smile is crucial. One model that aligns with the option is the volatility smile. However, the model that aligns more with the forward or reverse skew/smirk is implied volatility.
Additionally, the volatility smile (if applicable) may have a vague U-shape due to other market factors like supply and demand (or smirk). It could have a basic and choppy U-shape, with certain options exhibiting more or less implied volatility than the model's prediction,
The volatility smile indicates all the options for traders to get more or less implied volatility. However, many other factors affect the options trading decision-making process.
[1]https://pages.stern.nyu.edu/~dbackus/GE_asset_pricing/BCDG%2087%20crash%20Jan%2010.PDF
This presentation is for informational and educational use only and is not a recommendation or endorsement of any particular investment or investment strategy. Investment information provided in this content is general in nature, strictly for illustrative purposes, and may not be appropriate for all investors. Read more
Recommend
How to Trade During High Volatility (VIX > 25)
How to Day Trade Without $25,000
How to Start Day Trading for Beginners

Swing Trading Basics: Strategies & How It Works
How to Practice Day Trading (Day Trading Simulator Guide)
Intraday Trading Basics: How to Start & Benefits
ETF Tax Refund Guide: Understand Your Investment Returns
Stock Trading: A Beginner's Guide
How to Start Investing: A Beginner's Guide
How to Invest in Gold: Learn the Basics
Ethereum ETFs: How To Trade Spot Ethereum ETFs
What Is Copy Trading
What to Consider When Shifting from Paper Trading to Actual Trading
Investing During Earnings Season
How Stock Charting Tools Can Help You
What is Thematic Investing?
What Is Social Trading
6 ETF Concerns That Investors Shouldn’t Overlook
What Is Mirror Trading?
Company Earnings and Earnings per Share What Investors Need to Know
How to Use Paper Trading to Test and Help Refine Your Trading Strategy?
How to Practice Trading Without Risking Money?
Tax Trading Strategies in a Bear Market
What Are Market Orders?
Using Volume Oscillators to Confirm Price Movements
Price-to-Earnings (P/E) Ratio
What Is Working Capital?
What Is SWOT Analysis?
Choosing a Stock Simulator to Practice Stock Trading
What Is Revenue?
What Is A Recession?
Psychological Condition of the Market
What Is Beta in the Stock Market?
On-Balance Volume (OBV): What Is It?
What Is the Money Flow Index (MFI)?
Spot Market: What Is It?
What Does It Mean to Have a Certificate of Deposit (CD)?
What Is a Bellwether?
What Is the Spot Rate?
What Is a Volatility Smile?
What Is Historical Volatility (HV)?
What is Buying on Margin?
What Is Barbell Strategy?
How to Analyse Short Sale Volume in Trading
Trading Stocks Short: Overview
What is short selling?
Will ESG Investing Be The Future Of Investing?
How to Invest in the Hong Kong Stock Exchange - What Investors Should Know
Level 2 Market Data: How Advanced Traders Can Identify Value
Swing Trading vs. Day Trading: What's the Difference?
What Is a Day Order?
What Is the National Best Bid and Offer (NBBO) in US Equities?
What is Short Covering?
How to Find A Stock's Number of Shorted Shares?
What Is Trend Analysis?
TOP 10 Day Trading Strategies for Beginners
VWAP Trading Strategy - Volume Weighted Average Price
What is Maintenance Margin?
What Is Market Depth?
What Is Short Interest?
What Is a Trailing Stop and How to Use It?
Stock Split: Stock Trading Strategies for Advanced Traders
Scalping Stock Trading: How Does It Work?
Trading as a Side Hustle: How to get started
How to Pick Stocks: Invest Smarter with Stock Screener
Is Swing Trading More Profitable than Long-Term Trading?
Trade In A Bear Market With Short Sales
How to Trade During High Volatility (VIX > 25)
How to Day Trade Without $25,000
How to Start Day Trading for Beginners
Swing Trading Basics: Strategies & How It Works
How to Practice Day Trading (Day Trading Simulator Guide)
Intraday Trading Basics: How to Start & Benefits
ETF Tax Refund Guide: Understand Your Investment Returns
Stock Trading: A Beginner's Guide
How to Start Investing: A Beginner's Guide
How to Invest in Gold: Learn the Basics
Ethereum ETFs: How To Trade Spot Ethereum ETFs
What Is Copy Trading
What to Consider When Shifting from Paper Trading to Actual Trading
Investing During Earnings Season
How Stock Charting Tools Can Help You
What is Thematic Investing?
What Is Social Trading
6 ETF Concerns That Investors Shouldn’t Overlook
What Is Mirror Trading?
Company Earnings and Earnings per Share What Investors Need to Know
How to Use Paper Trading to Test and Help Refine Your Trading Strategy?
How to Practice Trading Without Risking Money?
Tax Trading Strategies in a Bear Market
What Are Market Orders?
Using Volume Oscillators to Confirm Price Movements
Price-to-Earnings (P/E) Ratio
What Is Working Capital?
What Is SWOT Analysis?
Choosing a Stock Simulator to Practice Stock Trading
What Is Revenue?
What Is A Recession?
Psychological Condition of the Market
What Is Beta in the Stock Market?
On-Balance Volume (OBV): What Is It?
What Is the Money Flow Index (MFI)?
Spot Market: What Is It?
What Does It Mean to Have a Certificate of Deposit (CD)?
What Is a Bellwether?
What Is the Spot Rate?
What Is a Volatility Smile?
What Is Historical Volatility (HV)?
What is Buying on Margin?
What Is Barbell Strategy?
How to Analyse Short Sale Volume in Trading
Trading Stocks Short: Overview
What is short selling?
Will ESG Investing Be The Future Of Investing?
How to Invest in the Hong Kong Stock Exchange - What Investors Should Know
Level 2 Market Data: How Advanced Traders Can Identify Value
Swing Trading vs. Day Trading: What's the Difference?
What Is a Day Order?
What Is the National Best Bid and Offer (NBBO) in US Equities?
What is Short Covering?
How to Find A Stock's Number of Shorted Shares?
What Is Trend Analysis?
TOP 10 Day Trading Strategies for Beginners
VWAP Trading Strategy - Volume Weighted Average Price
What is Maintenance Margin?
What Is Market Depth?
What Is Short Interest?
What Is a Trailing Stop and How to Use It?
Stock Split: Stock Trading Strategies for Advanced Traders
Scalping Stock Trading: How Does It Work?
Trading as a Side Hustle: How to get started
How to Pick Stocks: Invest Smarter with Stock Screener
Is Swing Trading More Profitable than Long-Term Trading?
Trade In A Bear Market With Short Sales