
Moomoo Insights
Jul 16 15:38
TSMC Earnings: AI Demand Is Stronger Than the Chip Selloff Suggests
Moomoo Insights
Sep 30 05:04
Live Take | Anthropic’s $518B Compute Bet: Who Wins From the AI Buildout?
The on-balance volume (OBV) indicator is a type of technical trading momentum that analyzes the flow of volume to forecast stock price changes. In his book published in 1963 titled Granville's New Key to Stock Market Profits, Joseph Granville is credited with being the inventor of the OBV measure. [1]
Granville believed that volume was the driving force behind markets; thus, he developed OBV to predict when significant market movements would occur based on changes in the volume. According to his book, OBV's forecasts feel like "a spring being coiled tightly." He thought that the stock price would either spike upwards or fall down in the long run if the volume continued to climb without a dramatic change in the price.
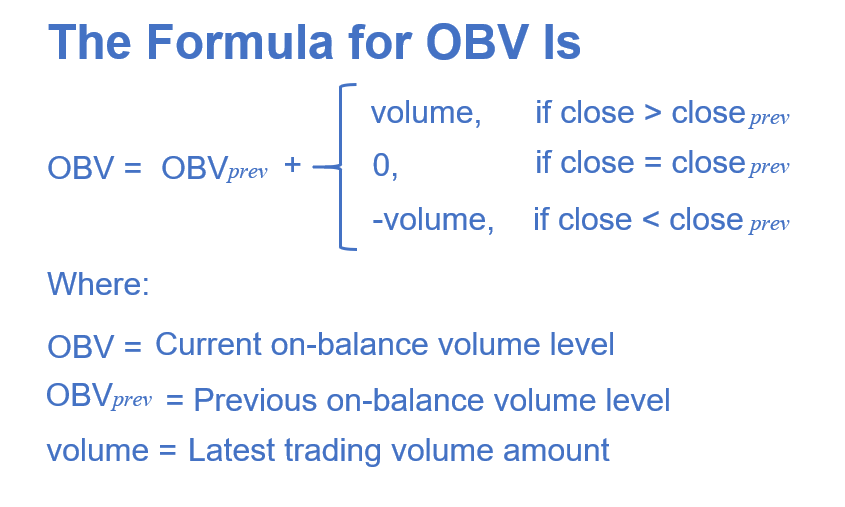
The on-balance volume offers a cumulative total of a stock's trading activity and shows whether this volume is moving into or out of certain securities or currency pairs. Volume may also indicate if an asset's trading activity increases or decreases over time. The OBV is a measure that combines all of the volumes (positive and negative). When determining the OBV, three different rules are taken into consideration. They are as follows:
1. If the price at which trading ended today is greater than the price at which trading ended yesterday, then: Current OBV = Previous OBV + today's volume
2. If the price at which trading ended today is lower than the price at which trading ended yesterday, then: Current OBV = Previous OBV - today's volume
3. If the price at the close of business today is the same as the price at the close of business yesterday, then: Current OBV = Previous OBV.
The concept that underpins OBV is predicated on the distinction between "the smart money" in the form of investment firms and "less sophisticated retail investors" in the form of individual investors. There is a potential that the volume may grow even if the price stays reasonably stable as pension and mutual fund funds continue to purchase into an issue that regular investors are dumping. At some point, the increase in volume will cause the price to rise. When this happens, larger investors start selling, while smaller investors start purchasing.
Even if OBV is shown on a price chart and assessed quantitatively, the exact quantitative value of OBV is irrelevant. Since the actual number value of OBV is arbitrary and relies on the start date, the indication is cumulative. However, the time period stays set by a specific beginning point. This means that the true number value of OBV cannot be determined with precision. Instead, traders and analysts focus on the characteristics of OBV changes over time; the OBV line's slope bears the whole weight of analysis.
Analysts use the OBV volume as a proxy for tracking the activities of major institutional investors. They look for chances to purchase against inaccurate prevalent trends by interpreting discrepancies between volume and price as a proxy for the dynamic between "smart money" and the unfocused masses. It is very uncommon for big investors to push up the price of a commodity before selling it, hoping to profit from the subsequent stampede of retail investors.
To some extent, OBV's predictive power is limited by the fact that it is a leading indicator rather than a lagging one; the signals it generates can only point to future developments rather than provide insight into the past. As a consequence of this, it often generates erroneous signals. It is thus possible to counteract this using leading indication. You can verify a breakout in the price if the OBV indicator also makes a breakout simultaneously. This is done by adding a moving average line to the OBV and looking for breakouts in the OBV line.
When employing the OBV, another warning is that a sudden and significant increase in volume on a single day might throw off the indication for a considerable time. For instance, an unexpected earnings release is included in or deleted from an index, or big institutional block transactions might cause the indicator to spike or fall. However, the surge in volume may not indicate a trend in the underlying market.
[1]https://www.google.com/books/edition/Granville_s_New_Key_to_Stock_Market_Prof/21ukDwAAQBAJ?hl=en&gbpv=0
This presentation is for informational and educational use only and is not a recommendation or endorsement of any particular investment or investment strategy. Investment information provided in this content is general in nature, strictly for illustrative purposes, and may not be appropriate for all investors. Read more
Recommend
How to Trade During High Volatility (VIX > 25)
How to Day Trade Without $25,000
How to Start Day Trading for Beginners

Swing Trading Basics: Strategies & How It Works
How to Practice Day Trading (Day Trading Simulator Guide)
Intraday Trading Basics: How to Start & Benefits
ETF Tax Refund Guide: Understand Your Investment Returns
Stock Trading: A Beginner's Guide
How to Start Investing: A Beginner's Guide
How to Invest in Gold: Learn the Basics
Ethereum ETFs: How To Trade Spot Ethereum ETFs
What Is Copy Trading
What to Consider When Shifting from Paper Trading to Actual Trading
Investing During Earnings Season
How Stock Charting Tools Can Help You
What is Thematic Investing?
What Is Social Trading
6 ETF Concerns That Investors Shouldn’t Overlook
What Is Mirror Trading?
Company Earnings and Earnings per Share What Investors Need to Know
How to Use Paper Trading to Test and Help Refine Your Trading Strategy?
How to Practice Trading Without Risking Money?
Tax Trading Strategies in a Bear Market
What Are Market Orders?
Using Volume Oscillators to Confirm Price Movements
Price-to-Earnings (P/E) Ratio
What Is Working Capital?
What Is SWOT Analysis?
Choosing a Stock Simulator to Practice Stock Trading
What Is Revenue?
What Is A Recession?
Psychological Condition of the Market
What Is Beta in the Stock Market?
On-Balance Volume (OBV): What Is It?
What Is the Money Flow Index (MFI)?
Spot Market: What Is It?
What Does It Mean to Have a Certificate of Deposit (CD)?
What Is a Bellwether?
What Is the Spot Rate?
What Is a Volatility Smile?
What Is Historical Volatility (HV)?
What is Buying on Margin?
What Is Barbell Strategy?
How to Analyse Short Sale Volume in Trading
Trading Stocks Short: Overview
What is short selling?
Will ESG Investing Be The Future Of Investing?
How to Invest in the Hong Kong Stock Exchange - What Investors Should Know
Level 2 Market Data: How Advanced Traders Can Identify Value
Swing Trading vs. Day Trading: What's the Difference?
What Is a Day Order?
What Is the National Best Bid and Offer (NBBO) in US Equities?
What is Short Covering?
How to Find A Stock's Number of Shorted Shares?
What Is Trend Analysis?
TOP 10 Day Trading Strategies for Beginners
VWAP Trading Strategy - Volume Weighted Average Price
What is Maintenance Margin?
What Is Market Depth?
What Is Short Interest?
What Is a Trailing Stop and How to Use It?
Stock Split: Stock Trading Strategies for Advanced Traders
Scalping Stock Trading: How Does It Work?
Trading as a Side Hustle: How to get started
How to Pick Stocks: Invest Smarter with Stock Screener
Is Swing Trading More Profitable than Long-Term Trading?
Trade In A Bear Market With Short Sales
How to Trade During High Volatility (VIX > 25)
How to Day Trade Without $25,000
How to Start Day Trading for Beginners
Swing Trading Basics: Strategies & How It Works
How to Practice Day Trading (Day Trading Simulator Guide)
Intraday Trading Basics: How to Start & Benefits
ETF Tax Refund Guide: Understand Your Investment Returns
Stock Trading: A Beginner's Guide
How to Start Investing: A Beginner's Guide
How to Invest in Gold: Learn the Basics
Ethereum ETFs: How To Trade Spot Ethereum ETFs
What Is Copy Trading
What to Consider When Shifting from Paper Trading to Actual Trading
Investing During Earnings Season
How Stock Charting Tools Can Help You
What is Thematic Investing?
What Is Social Trading
6 ETF Concerns That Investors Shouldn’t Overlook
What Is Mirror Trading?
Company Earnings and Earnings per Share What Investors Need to Know
How to Use Paper Trading to Test and Help Refine Your Trading Strategy?
How to Practice Trading Without Risking Money?
Tax Trading Strategies in a Bear Market
What Are Market Orders?
Using Volume Oscillators to Confirm Price Movements
Price-to-Earnings (P/E) Ratio
What Is Working Capital?
What Is SWOT Analysis?
Choosing a Stock Simulator to Practice Stock Trading
What Is Revenue?
What Is A Recession?
Psychological Condition of the Market
What Is Beta in the Stock Market?
On-Balance Volume (OBV): What Is It?
What Is the Money Flow Index (MFI)?
Spot Market: What Is It?
What Does It Mean to Have a Certificate of Deposit (CD)?
What Is a Bellwether?
What Is the Spot Rate?
What Is a Volatility Smile?
What Is Historical Volatility (HV)?
What is Buying on Margin?
What Is Barbell Strategy?
How to Analyse Short Sale Volume in Trading
Trading Stocks Short: Overview
What is short selling?
Will ESG Investing Be The Future Of Investing?
How to Invest in the Hong Kong Stock Exchange - What Investors Should Know
Level 2 Market Data: How Advanced Traders Can Identify Value
Swing Trading vs. Day Trading: What's the Difference?
What Is a Day Order?
What Is the National Best Bid and Offer (NBBO) in US Equities?
What is Short Covering?
How to Find A Stock's Number of Shorted Shares?
What Is Trend Analysis?
TOP 10 Day Trading Strategies for Beginners
VWAP Trading Strategy - Volume Weighted Average Price
What is Maintenance Margin?
What Is Market Depth?
What Is Short Interest?
What Is a Trailing Stop and How to Use It?
Stock Split: Stock Trading Strategies for Advanced Traders
Scalping Stock Trading: How Does It Work?
Trading as a Side Hustle: How to get started
How to Pick Stocks: Invest Smarter with Stock Screener
Is Swing Trading More Profitable than Long-Term Trading?
Trade In A Bear Market With Short Sales

