Moomoo Insights
Jul 16 15:38
TSMC Earnings: AI Demand Is Stronger Than the Chip Selloff Suggests
Moomoo Insights
Sep 30 05:04
Live Take | Anthropic’s $518B Compute Bet: Who Wins From the AI Buildout?
The total amount of outstanding shorted shares is "short interest." Traders usually engage in short selling, which involves selling security by borrowing shares of stock to profit from the expectation that the asset's value would decrease. Investors will sell the borrowed shares when they find purchasers at the going market price.
The level of interest in selling short is sometimes used to indicate the current market mood. A rise in the number of short positions investors hold sometimes signals that investors have gotten more pessimistic. A drop in short positions indicates that traders are becoming more optimistic.
A number or a percentage is often used to describe the amount of short interest. The Financial Industry Regulatory Authority (FINRA) mandates that financial institutions disclose short interest holdings in all client and propriety accounts twice per month for all equity securities. [1]
Main Points
The number of shares of a corporation presently sold short but have not been covered by buyers is referred to as the "short interest."
Although the number representation of short interest is helpful, it is more often stated as a percentage.
A rise in the number of short positions held by investors is sometimes seen as an indication that investors have gotten more bearish, whilst a drop in the number of short positions implies that investors have become more bullish.
The number of short sales in a marketplace can contribute to a better understanding not only of the future direction of a particular company but also of the bullish sentiment or bearishness with which investors see the market as a whole. The measurement and reporting of short interest, as well as the monthly publication of related data by stock exchanges, provides investors with a tool that may be used as a short-selling benchmark.
Compared to the previous month, a significant rise or fall in the number of shares borrowed to sell short for a particular company might provide insight into investor sentiment. If the short interest for a stock doubles from 10% to 20%, it may be a warning indicator that investors are becoming more pessimistic about the company's prospects since the number of investors who anticipate a decline in the stock price has also doubled.
The days to cover ratio is calculated by dividing the number of shorted shares by the average daily trading volume and provides another useful measure of short interest. The short interest ratio estimates the number of trading days necessary for the whole quantity of shares of a company that have been sold short to be covered or repurchased on the market.
If there are one million shares available for short sale and the usual daily volume of trade is 100,000 shares, it will take the short sellers at least ten trading days, on average, to cover their position if there are one million shares available for the short sale.
If there is a growing level of short interest in a company, this does not necessarily suggest that the stock price will go down; rather, it indicates that many investors are wagering that the stock price will go down. In order to determine the short interest or short float for a company, an investor has to divide the shares that have been sold short by the float, or the total number of shares available to the public for purchase.
If there are 10,000,000 shares outstanding and 100,000 are sold short, then 10% of the stock is in short supply.
Short interest may be used as an indication of investor confidence in a particular value or the marketplace. Some optimistic investors perceive strong short interest as a potential. Short interest can also be used as a sign of market confidence in a company's earnings report. There are several restrictions associated with using short interest as an indicator. The statistics on short interest that the NYSE supplies monthly are not up to date and may not accurately represent the current state of the market. [2] In addition, a substantial amount of stock may be sold short over a prolonged period without the market experiencing a "short squeeze" or a price drop.
Although it is a valuable instrument, short interest shouldn't be the primary factor when making an investment choice. There is no guarantee that a sudden shift in short interest, or even a dramatic one, would cause a noticeable shift in price. A share of a stock's price might see either a significant increase over a prolonged time or a significant decrease. Since most exchanges only report short interest once a month, traders are working with data that is a few weeks old at best and maybe drastically off from what the market sees.
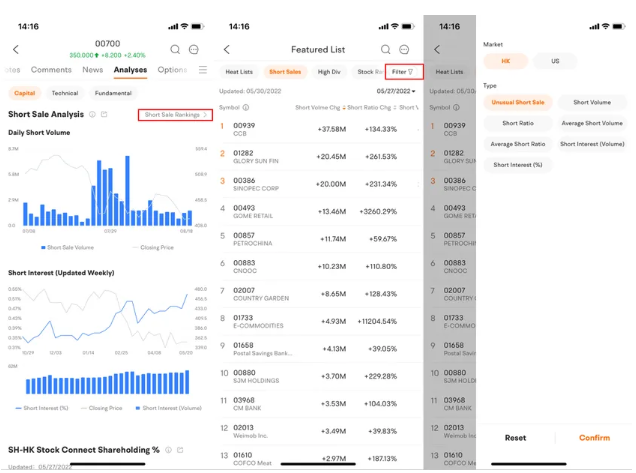
Moomoo trading app provides the short sell analysis to help investors to identify the long and short sentiment. Investors who like to short sale can find stocks with a high short-selling ratio and investment opportunities.
[1] FINRA. "Short Interest Reporting."
[2] New York Stock Exchange. "Report Center."
This presentation is for informational and educational use only and is not a recommendation or endorsement of any particular investment or investment strategy. Investment information provided in this content is general in nature, strictly for illustrative purposes, and may not be appropriate for all investors. Read more
Recommend
How to Trade During High Volatility (VIX > 25)
How to Day Trade Without $25,000
How to Start Day Trading for Beginners

Swing Trading Basics: Strategies & How It Works
How to Practice Day Trading (Day Trading Simulator Guide)
Intraday Trading Basics: How to Start & Benefits
ETF Tax Refund Guide: Understand Your Investment Returns
Stock Trading: A Beginner's Guide
How to Start Investing: A Beginner's Guide
How to Invest in Gold: Learn the Basics
Ethereum ETFs: How To Trade Spot Ethereum ETFs
What Is Copy Trading
What to Consider When Shifting from Paper Trading to Actual Trading
Investing During Earnings Season
How Stock Charting Tools Can Help You
What is Thematic Investing?
What Is Social Trading
6 ETF Concerns That Investors Shouldn’t Overlook
What Is Mirror Trading?
Company Earnings and Earnings per Share What Investors Need to Know
How to Use Paper Trading to Test and Help Refine Your Trading Strategy?
How to Practice Trading Without Risking Money?
Tax Trading Strategies in a Bear Market
What Are Market Orders?
Using Volume Oscillators to Confirm Price Movements
Price-to-Earnings (P/E) Ratio
What Is Working Capital?
What Is SWOT Analysis?
Choosing a Stock Simulator to Practice Stock Trading
What Is Revenue?
What Is A Recession?
Psychological Condition of the Market
What Is Beta in the Stock Market?
On-Balance Volume (OBV): What Is It?
What Is the Money Flow Index (MFI)?
Spot Market: What Is It?
What Does It Mean to Have a Certificate of Deposit (CD)?
What Is a Bellwether?
What Is the Spot Rate?
What Is a Volatility Smile?
What Is Historical Volatility (HV)?
What is Buying on Margin?
What Is Barbell Strategy?
How to Analyse Short Sale Volume in Trading
Trading Stocks Short: Overview
What is short selling?
Will ESG Investing Be The Future Of Investing?
How to Invest in the Hong Kong Stock Exchange - What Investors Should Know
Level 2 Market Data: How Advanced Traders Can Identify Value
Swing Trading vs. Day Trading: What's the Difference?
What Is a Day Order?
What Is the National Best Bid and Offer (NBBO) in US Equities?
What is Short Covering?
How to Find A Stock's Number of Shorted Shares?
What Is Trend Analysis?
TOP 10 Day Trading Strategies for Beginners
VWAP Trading Strategy - Volume Weighted Average Price
What is Maintenance Margin?
What Is Market Depth?
What Is Short Interest?
What Is a Trailing Stop and How to Use It?
Stock Split: Stock Trading Strategies for Advanced Traders
Scalping Stock Trading: How Does It Work?
Trading as a Side Hustle: How to get started
How to Pick Stocks: Invest Smarter with Stock Screener
Is Swing Trading More Profitable than Long-Term Trading?
Trade In A Bear Market With Short Sales
How to Trade During High Volatility (VIX > 25)
How to Day Trade Without $25,000
How to Start Day Trading for Beginners
Swing Trading Basics: Strategies & How It Works
How to Practice Day Trading (Day Trading Simulator Guide)
Intraday Trading Basics: How to Start & Benefits
ETF Tax Refund Guide: Understand Your Investment Returns
Stock Trading: A Beginner's Guide
How to Start Investing: A Beginner's Guide
How to Invest in Gold: Learn the Basics
Ethereum ETFs: How To Trade Spot Ethereum ETFs
What Is Copy Trading
What to Consider When Shifting from Paper Trading to Actual Trading
Investing During Earnings Season
How Stock Charting Tools Can Help You
What is Thematic Investing?
What Is Social Trading
6 ETF Concerns That Investors Shouldn’t Overlook
What Is Mirror Trading?
Company Earnings and Earnings per Share What Investors Need to Know
How to Use Paper Trading to Test and Help Refine Your Trading Strategy?
How to Practice Trading Without Risking Money?
Tax Trading Strategies in a Bear Market
What Are Market Orders?
Using Volume Oscillators to Confirm Price Movements
Price-to-Earnings (P/E) Ratio
What Is Working Capital?
What Is SWOT Analysis?
Choosing a Stock Simulator to Practice Stock Trading
What Is Revenue?
What Is A Recession?
Psychological Condition of the Market
What Is Beta in the Stock Market?
On-Balance Volume (OBV): What Is It?
What Is the Money Flow Index (MFI)?
Spot Market: What Is It?
What Does It Mean to Have a Certificate of Deposit (CD)?
What Is a Bellwether?
What Is the Spot Rate?
What Is a Volatility Smile?
What Is Historical Volatility (HV)?
What is Buying on Margin?
What Is Barbell Strategy?
How to Analyse Short Sale Volume in Trading
Trading Stocks Short: Overview
What is short selling?
Will ESG Investing Be The Future Of Investing?
How to Invest in the Hong Kong Stock Exchange - What Investors Should Know
Level 2 Market Data: How Advanced Traders Can Identify Value
Swing Trading vs. Day Trading: What's the Difference?
What Is a Day Order?
What Is the National Best Bid and Offer (NBBO) in US Equities?
What is Short Covering?
How to Find A Stock's Number of Shorted Shares?
What Is Trend Analysis?
TOP 10 Day Trading Strategies for Beginners
VWAP Trading Strategy - Volume Weighted Average Price
What is Maintenance Margin?
What Is Market Depth?
What Is Short Interest?
What Is a Trailing Stop and How to Use It?
Stock Split: Stock Trading Strategies for Advanced Traders
Scalping Stock Trading: How Does It Work?
Trading as a Side Hustle: How to get started
How to Pick Stocks: Invest Smarter with Stock Screener
Is Swing Trading More Profitable than Long-Term Trading?
Trade In A Bear Market With Short Sales