
Moomoo Insights
Jul 16 15:38
TSMC Earnings: AI Demand Is Stronger Than the Chip Selloff Suggests
Moomoo Insights
Sep 30 05:04
Live Take | Anthropic’s $518B Compute Bet: Who Wins From the AI Buildout?
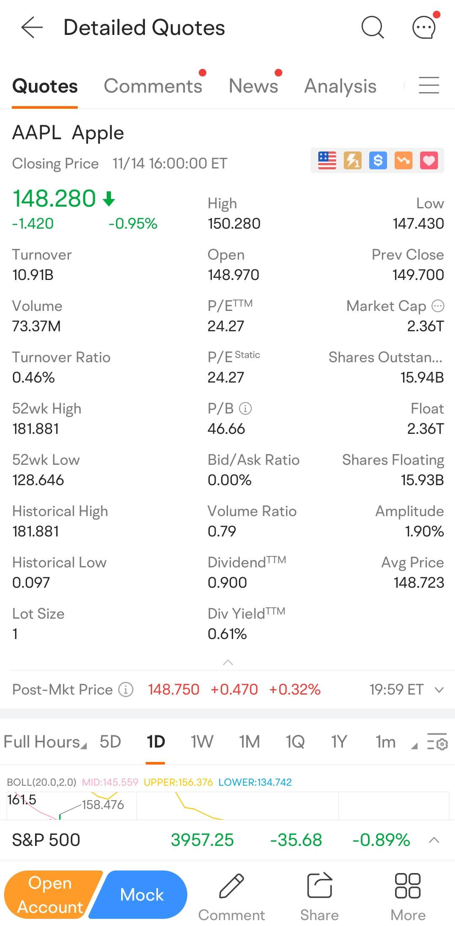
The price-to-earnings ratio indicates the company's value and helps compare the current share price and earnings per share. It is also known as earnings multiple and price multiple.
Analysts and investors use P/E ratios to assess the comparative value of a company's shares in an apples-to-apples comparison. P/E can be assessed based on the forward basis or trailing basis.
To calculate the P/E ratio, divide the current stock price by the earnings per share to find the P/E value. You can find the current stock price by entering a stock's ticker symbol into any finance website.

There're two main varieties of earnings per share (EPS). TTM is a Wall Street acronym for "Trailing 12 Months". It indicates how the company has performed in the previous 12 months. The 2nd type of EPS could be seen in an organization's earning report. It indicates the future estimated earnings of the company. These various EPS versions are the foundation for the trailing and forward P/E ratios.
One of the most popular methods for analysts and investors to estimate a stock's relative value is the price-to-earnings ratio (P/E). A stock's P/E ratio can be used to assess whether it is undervalued or overvalued. The P/E ratio of a firm can also be compared to other stocks in the same sector or a broader market, such as the S&P 500 Index.
Occasionally, analysts interested in long-term valuation patterns will consider the P/E 10 or P/E 30 metrics. The P/E 10 averages the last 10 years of earnings, and P/E 30 estimates the last 30 years of earnings. These longer-term measurements can account for fluctuations in the business cycle, which is why they are frequently used to determine the overall value of stock indices, such as the S&P 500.
The two most common types of P/E ratios are:
● Trailing P/E
● Forward P/E
Another variation of the P/E also exists that takes the last two actual quarters and adds them to determine the next two quarters.
Forward P/E doesn't use trailing figures. Instead, it uses future earnings guidance known as the estimated price to earnings. It helps compare the current and future earnings to clearly describe unmodified earnings.
However, the forward P/E metric has many limitations. For instance, companies may miscalculate the earnings to beat the estimated P/E. On the other hand, overestimation is also a problem. Additionally, estimates from external experts could differ from those made by the corporation, which could be confusing.
The trailing P/E can be obtained by dividing the current share price by total EPS earnings in the past 12 months. It depends on past performance. The reason behind its popularity is its objectivity and accurate earning assumption. However, trailing also has some limitations, such as not predicting future behavior from past performance.
Investors shouldn't rely on the previous earning power. Instead, they should focus on the future earning power to make final decisions. Another problem is the constant nature of the EPS number on the fluctuation of stock prices. For instance, trailing P/E is less reflective of the changes if a major company event causes it.
The trailing P/E ratio will fluctuate along with the price of a company's shares because earnings are only reported once a quarter, but stocks are traded continuously. Therefore, some investors prefer forward P/E. A lower P/E ratio than a trailing P/E ratio indicates that earnings are expected to increase. On the other hand, a higher forward P/E value than the current P/E ratio indicates that earnings are expected to decrease.
One of the most popular stock research methods investors and analysts use to determine stock valuation is the price-to-earnings ratio or P/E. The P/E ratio can demonstrate how a firm's valuation compares to its industry group or a benchmark like the S&P 500 Index, in addition to indicating if a company's stock price is undervalued or overvalued.
The price-to-earnings ratio tells investors how much money they need to put into a firm to get $1 of earnings from that company. Since P/E indicates the amount investors are willing to pay for 1 dollar, it is also known as price multiple. For instance, if a company is trading at a P/E multiple of 20x, it indicates that investors can pay up to $20 per dollar earning.
The P/E ratio aids investors in estimating a stock's market value in relation to its earnings. In a nutshell, the P/E ratio uses past and future earnings to estimate how much the market is willing to pay for a particular stock. A high P/E may indicate a stock's price is excessively high in relation to its earnings. On the other hand, a low P/E can suggest that the current stock price is undervalued compared to earnings.
Investors can use the P/E ratio to determine whether a company's stock is overvalued or undervalued relative to its earnings. The ratio measures how much the market can pay for the company's existing activities and its potential for future growth. For instance, if a company trades at a higher P/E, the market will be willing to pay high based on the higher growth potential and potential future earnings.
Like many other indicators, P/E also has some limitations. It is important to understand these limitations because investors often consider only one metric enough to make investment decisions.
Calculating a company's P/E might be difficult for unprofitable businesses with no earnings or negative earnings per share. The best way to handle this is up for debate. The majority claim that the P/E doesn't exist (N/A or unavailable) until a company becomes profitable for comparison purposes. Some claim a negative P/E, while others assign a P/E of 0.
Comparison of the P/E ratios of different companies indicates another major limitation. Growth rates and valuations of companies vary based on the way and timeframe of making money.
As a result, P/E should only be used when comparing companies in the same industry. It may be able to help investors to determine the superior investment, but this conclusion may not always be reliable.
Moomoo trading app will provide investors with a comprehensive overview of individual stocks, like price-to-earnings (P/E), price-to-book (P/B), market cap, volume, and more. Sign up and download the moomoo app today to get free access to the latest stock market quotes.
This presentation is for informational and educational use only and is not a recommendation or endorsement of any particular investment or investment strategy. Investment information provided in this content is general in nature, strictly for illustrative purposes, and may not be appropriate for all investors. Read more
Recommend
How to Trade During High Volatility (VIX > 25)
How to Day Trade Without $25,000
How to Start Day Trading for Beginners

Swing Trading Basics: Strategies & How It Works
How to Practice Day Trading (Day Trading Simulator Guide)
Intraday Trading Basics: How to Start & Benefits
ETF Tax Refund Guide: Understand Your Investment Returns
Stock Trading: A Beginner's Guide
How to Start Investing: A Beginner's Guide
How to Invest in Gold: Learn the Basics
Ethereum ETFs: How To Trade Spot Ethereum ETFs
What Is Copy Trading
What to Consider When Shifting from Paper Trading to Actual Trading
Investing During Earnings Season
How Stock Charting Tools Can Help You
What is Thematic Investing?
What Is Social Trading
6 ETF Concerns That Investors Shouldn’t Overlook
What Is Mirror Trading?
Company Earnings and Earnings per Share What Investors Need to Know
How to Use Paper Trading to Test and Help Refine Your Trading Strategy?
How to Practice Trading Without Risking Money?
Tax Trading Strategies in a Bear Market
What Are Market Orders?
Using Volume Oscillators to Confirm Price Movements
Price-to-Earnings (P/E) Ratio
What Is Working Capital?
What Is SWOT Analysis?
Choosing a Stock Simulator to Practice Stock Trading
What Is Revenue?
What Is A Recession?
Psychological Condition of the Market
What Is Beta in the Stock Market?
On-Balance Volume (OBV): What Is It?
What Is the Money Flow Index (MFI)?
Spot Market: What Is It?
What Does It Mean to Have a Certificate of Deposit (CD)?
What Is a Bellwether?
What Is the Spot Rate?
What Is a Volatility Smile?
What Is Historical Volatility (HV)?
What is Buying on Margin?
What Is Barbell Strategy?
How to Analyse Short Sale Volume in Trading
Trading Stocks Short: Overview
What is short selling?
Will ESG Investing Be The Future Of Investing?
How to Invest in the Hong Kong Stock Exchange - What Investors Should Know
Level 2 Market Data: How Advanced Traders Can Identify Value
Swing Trading vs. Day Trading: What's the Difference?
What Is a Day Order?
What Is the National Best Bid and Offer (NBBO) in US Equities?
What is Short Covering?
How to Find A Stock's Number of Shorted Shares?
What Is Trend Analysis?
TOP 10 Day Trading Strategies for Beginners
VWAP Trading Strategy - Volume Weighted Average Price
What is Maintenance Margin?
What Is Market Depth?
What Is Short Interest?
What Is a Trailing Stop and How to Use It?
Stock Split: Stock Trading Strategies for Advanced Traders
Scalping Stock Trading: How Does It Work?
Trading as a Side Hustle: How to get started
How to Pick Stocks: Invest Smarter with Stock Screener
Is Swing Trading More Profitable than Long-Term Trading?
Trade In A Bear Market With Short Sales
How to Trade During High Volatility (VIX > 25)
How to Day Trade Without $25,000
How to Start Day Trading for Beginners
Swing Trading Basics: Strategies & How It Works
How to Practice Day Trading (Day Trading Simulator Guide)
Intraday Trading Basics: How to Start & Benefits
ETF Tax Refund Guide: Understand Your Investment Returns
Stock Trading: A Beginner's Guide
How to Start Investing: A Beginner's Guide
How to Invest in Gold: Learn the Basics
Ethereum ETFs: How To Trade Spot Ethereum ETFs
What Is Copy Trading
What to Consider When Shifting from Paper Trading to Actual Trading
Investing During Earnings Season
How Stock Charting Tools Can Help You
What is Thematic Investing?
What Is Social Trading
6 ETF Concerns That Investors Shouldn’t Overlook
What Is Mirror Trading?
Company Earnings and Earnings per Share What Investors Need to Know
How to Use Paper Trading to Test and Help Refine Your Trading Strategy?
How to Practice Trading Without Risking Money?
Tax Trading Strategies in a Bear Market
What Are Market Orders?
Using Volume Oscillators to Confirm Price Movements
Price-to-Earnings (P/E) Ratio
What Is Working Capital?
What Is SWOT Analysis?
Choosing a Stock Simulator to Practice Stock Trading
What Is Revenue?
What Is A Recession?
Psychological Condition of the Market
What Is Beta in the Stock Market?
On-Balance Volume (OBV): What Is It?
What Is the Money Flow Index (MFI)?
Spot Market: What Is It?
What Does It Mean to Have a Certificate of Deposit (CD)?
What Is a Bellwether?
What Is the Spot Rate?
What Is a Volatility Smile?
What Is Historical Volatility (HV)?
What is Buying on Margin?
What Is Barbell Strategy?
How to Analyse Short Sale Volume in Trading
Trading Stocks Short: Overview
What is short selling?
Will ESG Investing Be The Future Of Investing?
How to Invest in the Hong Kong Stock Exchange - What Investors Should Know
Level 2 Market Data: How Advanced Traders Can Identify Value
Swing Trading vs. Day Trading: What's the Difference?
What Is a Day Order?
What Is the National Best Bid and Offer (NBBO) in US Equities?
What is Short Covering?
How to Find A Stock's Number of Shorted Shares?
What Is Trend Analysis?
TOP 10 Day Trading Strategies for Beginners
VWAP Trading Strategy - Volume Weighted Average Price
What is Maintenance Margin?
What Is Market Depth?
What Is Short Interest?
What Is a Trailing Stop and How to Use It?
Stock Split: Stock Trading Strategies for Advanced Traders
Scalping Stock Trading: How Does It Work?
Trading as a Side Hustle: How to get started
How to Pick Stocks: Invest Smarter with Stock Screener
Is Swing Trading More Profitable than Long-Term Trading?
Trade In A Bear Market With Short Sales

