

Moomoo Insights
Jul 16 15:38
TSMC Earnings: AI Demand Is Stronger Than the Chip Selloff Suggests
Moomoo Insights
Sep 30 05:04
Live Take | Anthropic’s $518B Compute Bet: Who Wins From the AI Buildout?
When the volume of trading is low, but the profits and losses are considerable, market experts tend to speculate about a potential change in the market's direction. The conventional wisdom in this province is that a marketplace move is not valid if there is no high trade volume. This article will examine how to interpret volume and the principles behind doing so.
Volume is an indicator that chartists keep a close eye on the metric to evaluate if a movement in the marketplace, a sector, or a particular issue has conviction. To calculate the answer, just sum up the total number of shares exchanged during the time period. This indication can be very easy to comprehend. This basic mathematics does not call for any weightings or complicated mathematical calculations. It displays passion or a lack thereof for a certain problem and has nothing to do with the price.
Technical analysts need to check whether price and volume momentum measures consistently verify a market turnaround or trend reversal. If someone starts to disagree on the direction of the trend, it's a warning sign that the trend is likely to reverse. When we examine volume from the momentum perspective, we can see a noticeable quantity of buying and selling activity going on.
By analyzing the relationship between two moving averages, a volume oscillator can calculate volume. The volume oscillator indicator determines a fast and slow volume-moving average. Afterward, a histogram is generated from the difference between the two-time series (fast volume moving average minus slow volume moving average). In most cases, a period of 14 days is used to calculate the fast volume moving average. The standard time period for the slow volume moving average is 28 days. Analysts sometimes disagree on whether or not these time spans can be applied to real-world situations; some believe that 14 and 28 days are insufficiently conservative, while others contend that these figures do not represent sufficient conservatism.
The histogram oscillates above and below a zero line in the same way that an oscillator does. The volume of trades in a market might give information about how strong or weak a price trend is. The positive numbers for this indication are plotted above the zero line, while the negative values for this indicator are shown below the line. If the value is positive, this indicates that there is sufficient market support to keep pushing price activity in the direction of the trend that has been established. A negative rating indicates insufficient support, indicating that prices may become stationary or even go in the other direction.
A market that is gaining momentum should increase the volume oscillator. When there's an overbought issue, the oscillator will move in the other direction. Volume should decrease if the market falls or ranges sideways.
Remember that volume increases during a sell-off, which is something to bear in mind whenever price fluctuations are discussed. It is essential to remember that falling volume in conjunction with rising prices could be bearish. This is a key factor to keep in mind. Because of this, one would anticipate seeing an oversold volume chart after the market has reached its highest point. A bearish trend is shown with the falling prices and increasing volume, which is another key element.
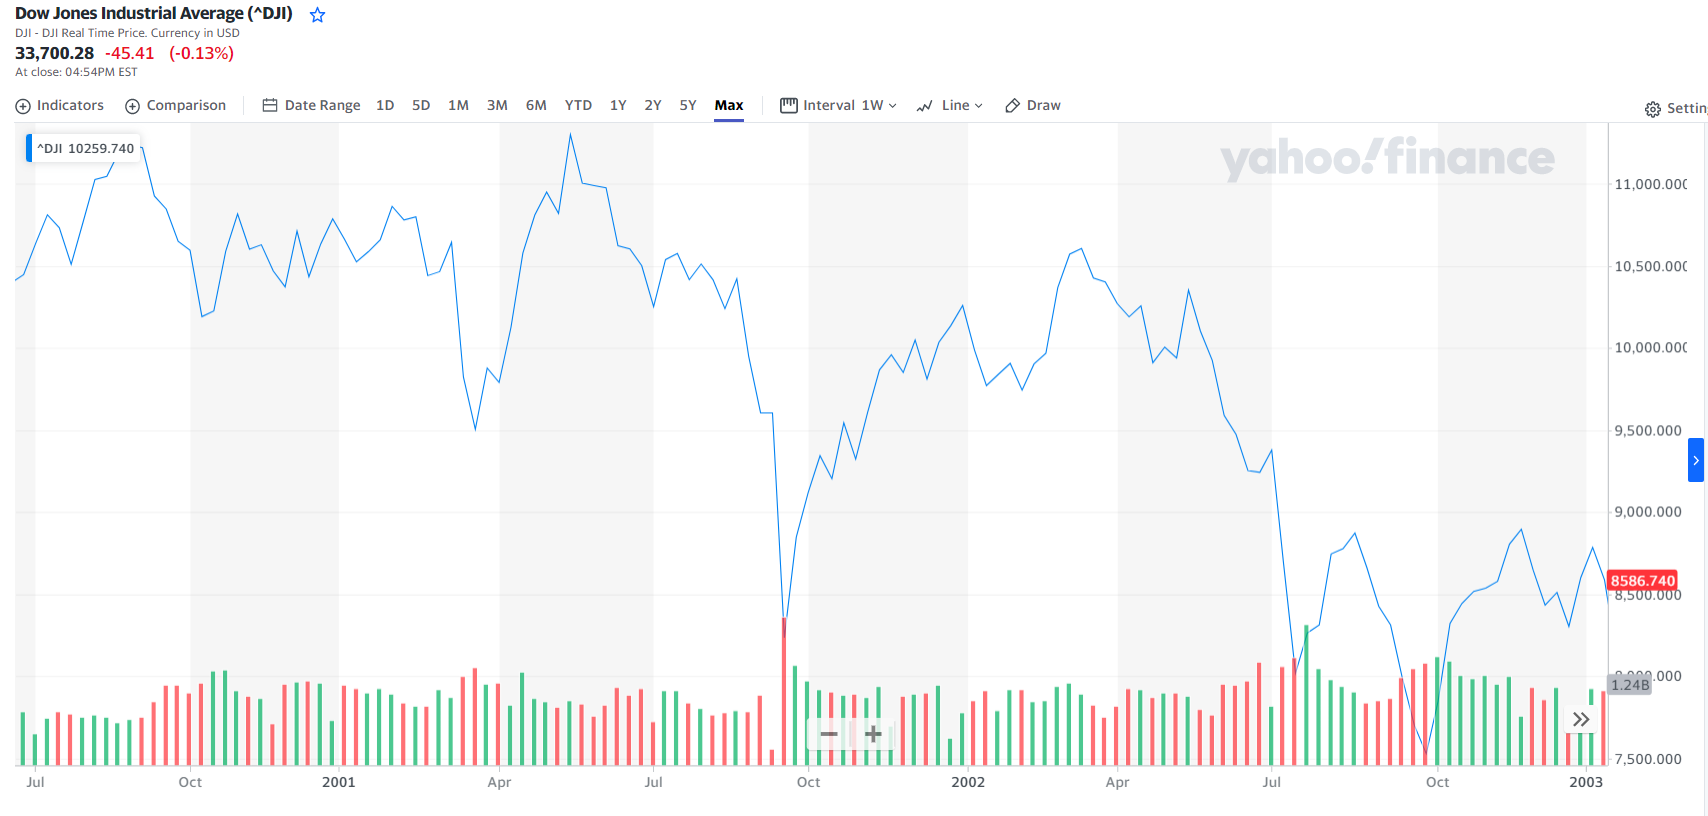
The volume oscillator indicates two large spikes in the Dow Jones Industrial Average's chart between August 2001 and August 2002, followed by large drops. The first is a consequence of the actions taken in the wake of September 11 and the following shift in investor confidence on September 21. The second reason is a decline over the summer and a rebound of more than 1,500 points during the previous weeks. [1]
Images provided are not current and any securities are shown for illustrative purposes only.
If we look at the first scenario, we can see that the volume shot up significantly when the market crashed at the reopening of the markets on September 17, 2001. After the market bounced on September 21, the following period of increasing prices was accompanied by relatively low volume on the Dow. The primary reason for the low volumes was that investors were still in shock; only the investors with the steeliest nerves returned to the market. [1]
This is only one of several strategies that can assist you in determining the general changes in the marketplace. No method can be relied upon one hundred percent of the time; therefore, regardless of your confidence, you should always keep in mind that the money is yours and invest it wisely.
Moomoo app's AI Monitor can help traders and investors to monitor stock movements in individual markets. It can also be helpful to monitor selected stock movements, index movements, and sector movements, allowing users to turn on and off the indicators they are interested in. Sign up and download the moomoo app today to experience the AI Monitor function.
Images provided are not current and any securities are shown for illustrative purposes only.
This presentation is for informational and educational use only and is not a recommendation or endorsement of any particular investment or investment strategy. Investment information provided in this content is general in nature, strictly for illustrative purposes, and may not be appropriate for all investors. Read more
Recommend
How to Trade During High Volatility (VIX > 25)
How to Day Trade Without $25,000
How to Start Day Trading for Beginners

Swing Trading Basics: Strategies & How It Works
How to Practice Day Trading (Day Trading Simulator Guide)
Intraday Trading Basics: How to Start & Benefits
ETF Tax Refund Guide: Understand Your Investment Returns
Stock Trading: A Beginner's Guide
How to Start Investing: A Beginner's Guide
How to Invest in Gold: Learn the Basics
Ethereum ETFs: How To Trade Spot Ethereum ETFs
What Is Copy Trading
What to Consider When Shifting from Paper Trading to Actual Trading
Investing During Earnings Season
How Stock Charting Tools Can Help You
What is Thematic Investing?
What Is Social Trading
6 ETF Concerns That Investors Shouldn’t Overlook
What Is Mirror Trading?
Company Earnings and Earnings per Share What Investors Need to Know
How to Use Paper Trading to Test and Help Refine Your Trading Strategy?
How to Practice Trading Without Risking Money?
Tax Trading Strategies in a Bear Market
What Are Market Orders?
Using Volume Oscillators to Confirm Price Movements
Price-to-Earnings (P/E) Ratio
What Is Working Capital?
What Is SWOT Analysis?
Choosing a Stock Simulator to Practice Stock Trading
What Is Revenue?
What Is A Recession?
Psychological Condition of the Market
What Is Beta in the Stock Market?
On-Balance Volume (OBV): What Is It?
What Is the Money Flow Index (MFI)?
Spot Market: What Is It?
What Does It Mean to Have a Certificate of Deposit (CD)?
What Is a Bellwether?
What Is the Spot Rate?
What Is a Volatility Smile?
What Is Historical Volatility (HV)?
What is Buying on Margin?
What Is Barbell Strategy?
How to Analyse Short Sale Volume in Trading
Trading Stocks Short: Overview
What is short selling?
Will ESG Investing Be The Future Of Investing?
How to Invest in the Hong Kong Stock Exchange - What Investors Should Know
Level 2 Market Data: How Advanced Traders Can Identify Value
Swing Trading vs. Day Trading: What's the Difference?
What Is a Day Order?
What Is the National Best Bid and Offer (NBBO) in US Equities?
What is Short Covering?
How to Find A Stock's Number of Shorted Shares?
What Is Trend Analysis?
TOP 10 Day Trading Strategies for Beginners
VWAP Trading Strategy - Volume Weighted Average Price
What is Maintenance Margin?
What Is Market Depth?
What Is Short Interest?
What Is a Trailing Stop and How to Use It?
Stock Split: Stock Trading Strategies for Advanced Traders
Scalping Stock Trading: How Does It Work?
Trading as a Side Hustle: How to get started
How to Pick Stocks: Invest Smarter with Stock Screener
Is Swing Trading More Profitable than Long-Term Trading?
Trade In A Bear Market With Short Sales
How to Trade During High Volatility (VIX > 25)
How to Day Trade Without $25,000
How to Start Day Trading for Beginners
Swing Trading Basics: Strategies & How It Works
How to Practice Day Trading (Day Trading Simulator Guide)
Intraday Trading Basics: How to Start & Benefits
ETF Tax Refund Guide: Understand Your Investment Returns
Stock Trading: A Beginner's Guide
How to Start Investing: A Beginner's Guide
How to Invest in Gold: Learn the Basics
Ethereum ETFs: How To Trade Spot Ethereum ETFs
What Is Copy Trading
What to Consider When Shifting from Paper Trading to Actual Trading
Investing During Earnings Season
How Stock Charting Tools Can Help You
What is Thematic Investing?
What Is Social Trading
6 ETF Concerns That Investors Shouldn’t Overlook
What Is Mirror Trading?
Company Earnings and Earnings per Share What Investors Need to Know
How to Use Paper Trading to Test and Help Refine Your Trading Strategy?
How to Practice Trading Without Risking Money?
Tax Trading Strategies in a Bear Market
What Are Market Orders?
Using Volume Oscillators to Confirm Price Movements
Price-to-Earnings (P/E) Ratio
What Is Working Capital?
What Is SWOT Analysis?
Choosing a Stock Simulator to Practice Stock Trading
What Is Revenue?
What Is A Recession?
Psychological Condition of the Market
What Is Beta in the Stock Market?
On-Balance Volume (OBV): What Is It?
What Is the Money Flow Index (MFI)?
Spot Market: What Is It?
What Does It Mean to Have a Certificate of Deposit (CD)?
What Is a Bellwether?
What Is the Spot Rate?
What Is a Volatility Smile?
What Is Historical Volatility (HV)?
What is Buying on Margin?
What Is Barbell Strategy?
How to Analyse Short Sale Volume in Trading
Trading Stocks Short: Overview
What is short selling?
Will ESG Investing Be The Future Of Investing?
How to Invest in the Hong Kong Stock Exchange - What Investors Should Know
Level 2 Market Data: How Advanced Traders Can Identify Value
Swing Trading vs. Day Trading: What's the Difference?
What Is a Day Order?
What Is the National Best Bid and Offer (NBBO) in US Equities?
What is Short Covering?
How to Find A Stock's Number of Shorted Shares?
What Is Trend Analysis?
TOP 10 Day Trading Strategies for Beginners
VWAP Trading Strategy - Volume Weighted Average Price
What is Maintenance Margin?
What Is Market Depth?
What Is Short Interest?
What Is a Trailing Stop and How to Use It?
Stock Split: Stock Trading Strategies for Advanced Traders
Scalping Stock Trading: How Does It Work?
Trading as a Side Hustle: How to get started
How to Pick Stocks: Invest Smarter with Stock Screener
Is Swing Trading More Profitable than Long-Term Trading?
Trade In A Bear Market With Short Sales

