
Moomoo Insights
Jul 16 15:38
TSMC Earnings: AI Demand Is Stronger Than the Chip Selloff Suggests
Moomoo Insights
Sep 30 05:04
Live Take | Anthropic’s $518B Compute Bet: Who Wins From the AI Buildout?
An economic bellwether is an indicator of future developments. A bellwether is a firm that investors pay particular attention to because changes in its financial performance can indicate changes in the broader economy. If a firm's stock is seen as hinting towards an upward or negative trend in a sector, then that stock may also be considered a bellwether for that sector. One such corporation is FedEx, which acts as a bellwether for the shipping industry. It seems to reason that an increase in consumer spending would result from an announcement by FedEx about a significant rise in the number of packages delivered during a certain quarter. More products are being created to fulfill the growing number of wholesale orders, more wholesale orders are being delivered to retailers, and retailers are purchasing more products to keep up with the growing customer demand.
When it comes to the economy, a bellwether is a leading indicator that may provide insight into broader phenomena.
A bellwether firm is widely monitored because its highs and lows are believed to indicate a shift in trend for the industry it operates in or for the economy as a whole.
A stock considered to be a bellwether is used to anticipate how the market as a whole or a particular segment of it will perform.
Companies that are regarded as leading indicators are often leaders in their respective fields and are sometimes referred to as blue chips.
Even though bellwether stocks may be able to indicate future trends, this does not mean that they are always the greatest investments in their respective industries.
Since the success of FedEx and a number of other publicly traded firms is highly connected with a general trend, experts believe that the performance of these companies may provide insight into the direction in which the economic and financial markets are moving. Blue chips, which often include leading companies, are a type of company that serves as a bellwether for the economy.
When evaluating the condition of the marketplace or the economy as a whole, bellwether stocks are often referenced. Although the position of a company as a bellwether may change over time, in the equity markets, the bellwethers of a sector are frequently the largest and most well-established businesses in that sector.
Most companies that qualify as bellwethers already have established themselves as lucrative and reliable market participants within an industry with well-established client bases and strong brand loyalty. Some show remarkable resilience in the face of economic downturns.
These companies also serve as the basis for most of the main market indexes; large-cap bellwethers such as the Boeing Company and Johnson & Johnson dominate the Dow Jones Industrials and the S&P 500, respectively.
There is no assurance buying bellwether stocks will provide the highest returns, but they may be a good indicator of where the market is headed. Once a corporation has achieved bellwether status, its days of experiencing the highest growth rate are often in the past, and its massive scale makes substantial expansion impossible.
However, investors may choose to utilize bellwether companies as indications while investing their money in emerging firms that have potential for growth still in front of them.
Bellwether stocks, also referred to as barometer stocks are good benchmarks for assessing the general trend of a sector, such as whether it will have a bull or bear market. Bellwethers provide some insight into the direction the market is heading, which is especially helpful in investing, where a great deal of unpredictability must be accounted for. On the other hand, it is important to emphasize that bellwethers are not always accurate predictors of the future since correlation does not necessarily imply causation.
The general health of a company's finances may significantly impact the markets, particularly when it comes to bellwether stocks, also known as blue-chip stocks. However, such and other bellwether stocks often belong to well-established, secure, and financially sound companies. But it also indicates that its growth days slow down. If you just look at bellwether stocks, you can get an inaccurate picture of this potential's value. Newer and more developing firms might show higher growth and be good investments.
● Provide indications of future behavior with the use of previous information.
● Provide leading signs of when market circumstances are changing
●Are generally simple pulse checks
Cons
● Not necessarily a reliable indicator when comparing organizations or sectors of various sizes.
● There is no assurance that one outcome will be reached based on bellwethers.
● There is a risk of putting too much emphasis on a single indicator.
moomoo trading app provides a collection of position reports from institutional investors such as Warren Buffett, and High Tide Capital, providing investors with quick access to information. Investors could easily find the list of stocks held by these institutions along with historical position trends and intra-day trading information. Sign up and download moomoo app now to track institutional holdings.
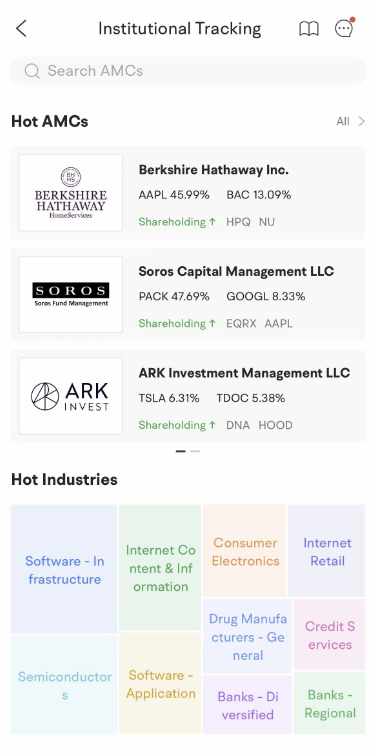
Images provided are not current and any securities are shown for illustrative purposes only.
No matter how you interpret the actions of a bellwether company, it is important to keep a careful eye on such businesses, particularly if historical evidence supports the conduct of those businesses. Bellwether stocks are stocks known to give a beneficial initial pulse check on wider economic trends for investors who are following the market.
This presentation is for informational and educational use only and is not a recommendation or endorsement of any particular investment or investment strategy. Investment information provided in this content is general in nature, strictly for illustrative purposes, and may not be appropriate for all investors. Read more
Recommend
How to Trade During High Volatility (VIX > 25)
How to Day Trade Without $25,000
How to Start Day Trading for Beginners

Swing Trading Basics: Strategies & How It Works
How to Practice Day Trading (Day Trading Simulator Guide)
Intraday Trading Basics: How to Start & Benefits
ETF Tax Refund Guide: Understand Your Investment Returns
Stock Trading: A Beginner's Guide
How to Start Investing: A Beginner's Guide
How to Invest in Gold: Learn the Basics
Ethereum ETFs: How To Trade Spot Ethereum ETFs
What Is Copy Trading
What to Consider When Shifting from Paper Trading to Actual Trading
Investing During Earnings Season
How Stock Charting Tools Can Help You
What is Thematic Investing?
What Is Social Trading
6 ETF Concerns That Investors Shouldn’t Overlook
What Is Mirror Trading?
Company Earnings and Earnings per Share What Investors Need to Know
How to Use Paper Trading to Test and Help Refine Your Trading Strategy?
How to Practice Trading Without Risking Money?
Tax Trading Strategies in a Bear Market
What Are Market Orders?
Using Volume Oscillators to Confirm Price Movements
Price-to-Earnings (P/E) Ratio
What Is Working Capital?
What Is SWOT Analysis?
Choosing a Stock Simulator to Practice Stock Trading
What Is Revenue?
What Is A Recession?
Psychological Condition of the Market
What Is Beta in the Stock Market?
On-Balance Volume (OBV): What Is It?
What Is the Money Flow Index (MFI)?
Spot Market: What Is It?
What Does It Mean to Have a Certificate of Deposit (CD)?
What Is a Bellwether?
What Is the Spot Rate?
What Is a Volatility Smile?
What Is Historical Volatility (HV)?
What is Buying on Margin?
What Is Barbell Strategy?
How to Analyse Short Sale Volume in Trading
Trading Stocks Short: Overview
What is short selling?
Will ESG Investing Be The Future Of Investing?
How to Invest in the Hong Kong Stock Exchange - What Investors Should Know
Level 2 Market Data: How Advanced Traders Can Identify Value
Swing Trading vs. Day Trading: What's the Difference?
What Is a Day Order?
What Is the National Best Bid and Offer (NBBO) in US Equities?
What is Short Covering?
How to Find A Stock's Number of Shorted Shares?
What Is Trend Analysis?
TOP 10 Day Trading Strategies for Beginners
VWAP Trading Strategy - Volume Weighted Average Price
What is Maintenance Margin?
What Is Market Depth?
What Is Short Interest?
What Is a Trailing Stop and How to Use It?
Stock Split: Stock Trading Strategies for Advanced Traders
Scalping Stock Trading: How Does It Work?
Trading as a Side Hustle: How to get started
How to Pick Stocks: Invest Smarter with Stock Screener
Is Swing Trading More Profitable than Long-Term Trading?
Trade In A Bear Market With Short Sales
How to Trade During High Volatility (VIX > 25)
How to Day Trade Without $25,000
How to Start Day Trading for Beginners
Swing Trading Basics: Strategies & How It Works
How to Practice Day Trading (Day Trading Simulator Guide)
Intraday Trading Basics: How to Start & Benefits
ETF Tax Refund Guide: Understand Your Investment Returns
Stock Trading: A Beginner's Guide
How to Start Investing: A Beginner's Guide
How to Invest in Gold: Learn the Basics
Ethereum ETFs: How To Trade Spot Ethereum ETFs
What Is Copy Trading
What to Consider When Shifting from Paper Trading to Actual Trading
Investing During Earnings Season
How Stock Charting Tools Can Help You
What is Thematic Investing?
What Is Social Trading
6 ETF Concerns That Investors Shouldn’t Overlook
What Is Mirror Trading?
Company Earnings and Earnings per Share What Investors Need to Know
How to Use Paper Trading to Test and Help Refine Your Trading Strategy?
How to Practice Trading Without Risking Money?
Tax Trading Strategies in a Bear Market
What Are Market Orders?
Using Volume Oscillators to Confirm Price Movements
Price-to-Earnings (P/E) Ratio
What Is Working Capital?
What Is SWOT Analysis?
Choosing a Stock Simulator to Practice Stock Trading
What Is Revenue?
What Is A Recession?
Psychological Condition of the Market
What Is Beta in the Stock Market?
On-Balance Volume (OBV): What Is It?
What Is the Money Flow Index (MFI)?
Spot Market: What Is It?
What Does It Mean to Have a Certificate of Deposit (CD)?
What Is a Bellwether?
What Is the Spot Rate?
What Is a Volatility Smile?
What Is Historical Volatility (HV)?
What is Buying on Margin?
What Is Barbell Strategy?
How to Analyse Short Sale Volume in Trading
Trading Stocks Short: Overview
What is short selling?
Will ESG Investing Be The Future Of Investing?
How to Invest in the Hong Kong Stock Exchange - What Investors Should Know
Level 2 Market Data: How Advanced Traders Can Identify Value
Swing Trading vs. Day Trading: What's the Difference?
What Is a Day Order?
What Is the National Best Bid and Offer (NBBO) in US Equities?
What is Short Covering?
How to Find A Stock's Number of Shorted Shares?
What Is Trend Analysis?
TOP 10 Day Trading Strategies for Beginners
VWAP Trading Strategy - Volume Weighted Average Price
What is Maintenance Margin?
What Is Market Depth?
What Is Short Interest?
What Is a Trailing Stop and How to Use It?
Stock Split: Stock Trading Strategies for Advanced Traders
Scalping Stock Trading: How Does It Work?
Trading as a Side Hustle: How to get started
How to Pick Stocks: Invest Smarter with Stock Screener
Is Swing Trading More Profitable than Long-Term Trading?
Trade In A Bear Market With Short Sales

