
Moomoo Insights
Jul 16 15:38
TSMC Earnings: AI Demand Is Stronger Than the Chip Selloff Suggests
Moomoo Insights
Sep 30 05:04
Live Take | Anthropic’s $518B Compute Bet: Who Wins From the AI Buildout?
With the concept of earnings, making progress in the stock market is more accessible. This figure, often cited, has captured the attention of many investors. But what, precisely, does it mean when we talk about earnings? Why do they get such a great deal of attention? This article will cover all of these topics and more.
Simply said, a company's profits are the same as its earnings. Simply calculate a company's profits by taking the money it generates from selling a product or service and any other revenue generated and deducting the total amount it spent to manufacture that good or service along with any other expenses. Earnings are usually defined as the amount of money a firm produces after deducting its operating expenses, even if the specifics of accounting get relatively complex. One of the reasons for the misunderstanding around profits is that it has so many synonyms. Earnings, profit, net income, and the bottom line are all interchangeable terms that refer to the same thing.
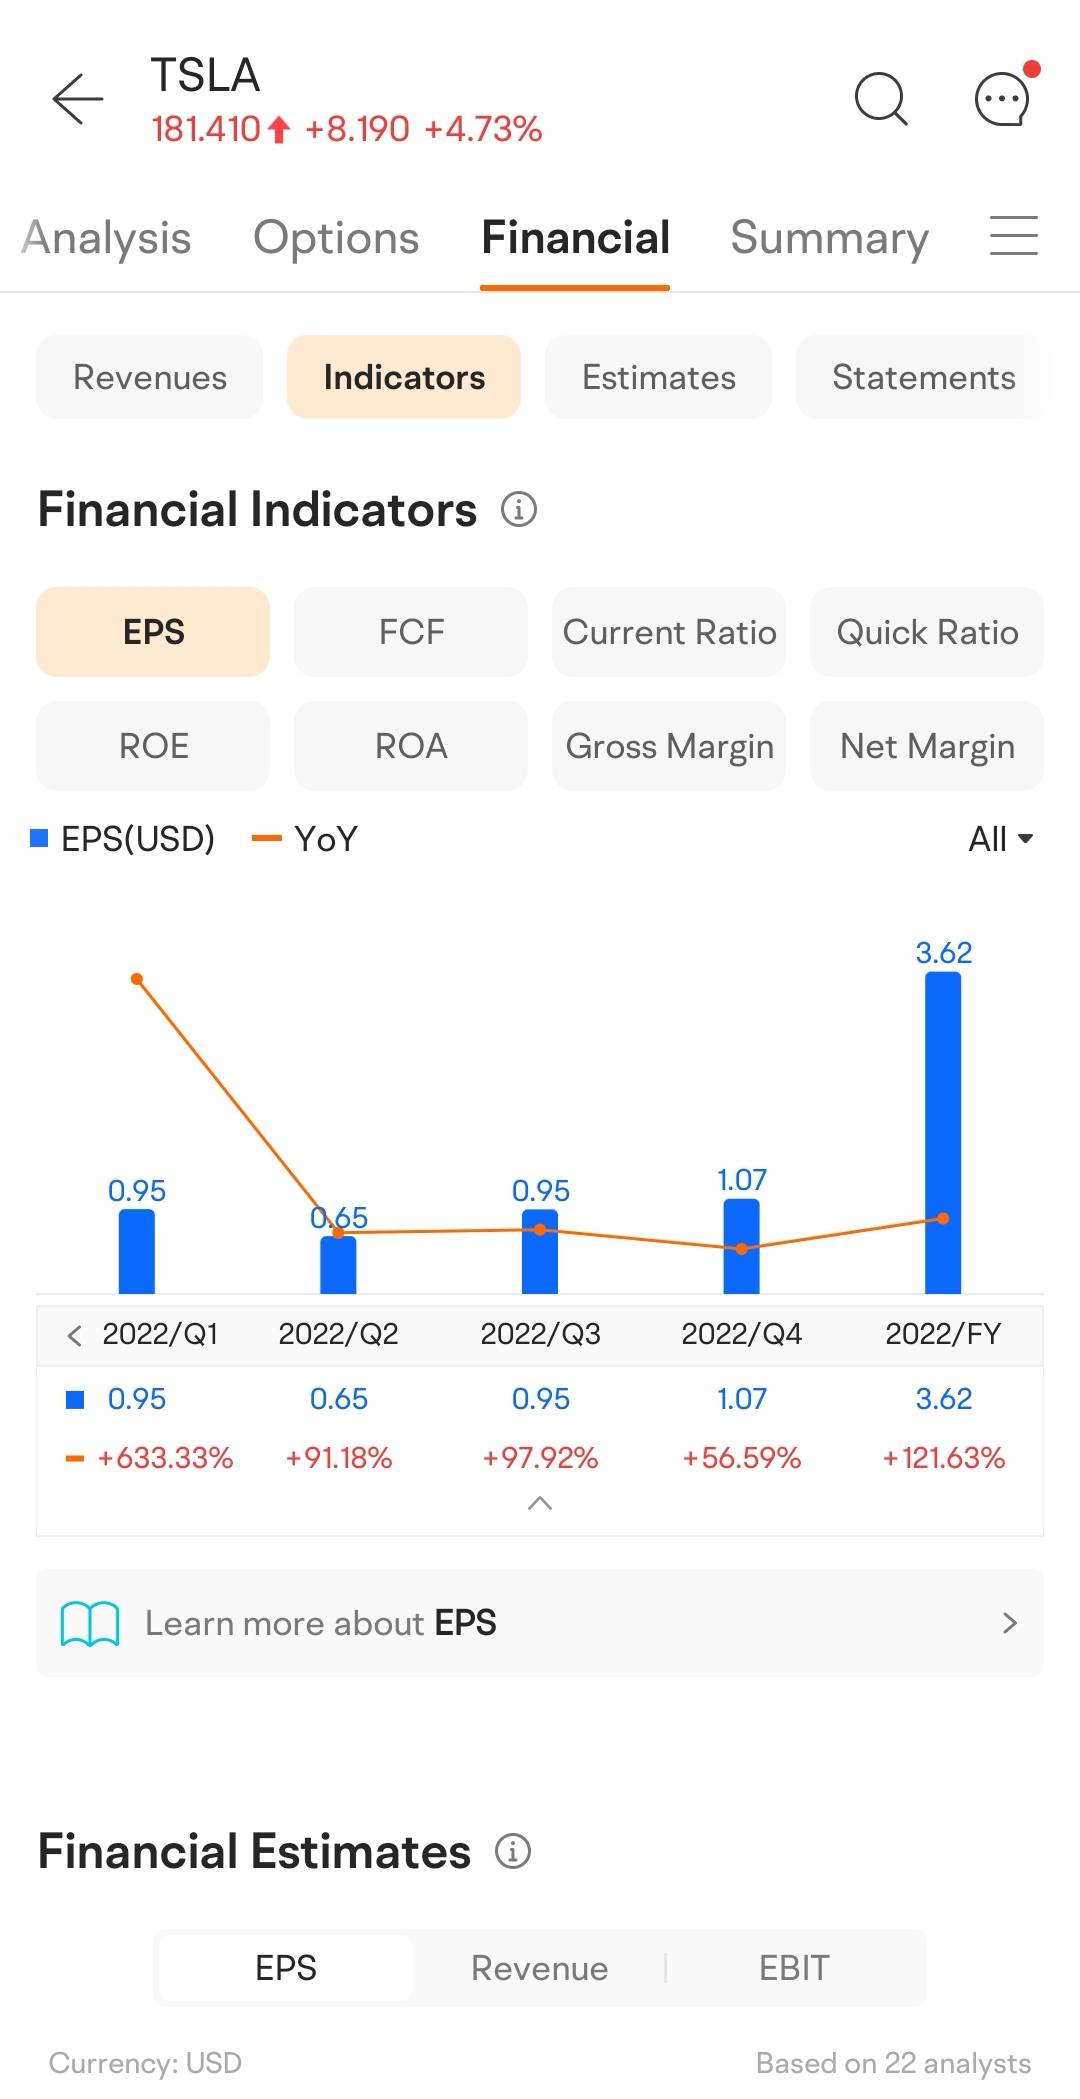
Investors and analysts often use the ratio of earnings per share (EPS) to make earnings comparisons across many firms. To determine earnings per share (EPS), select the total amount of profit allocated to shareholders and then divide that amount by the total number of issued shares. You may think of earnings per share, or EPS, as a method to describe profits per person. Comparing only the earnings figures of different companies does not indicate how much money each company made for each of its shares; therefore, we need to compare earnings per share (EPS) to make valid comparisons. This is because the number of shares owned by the public in each company is unique.
On Wall Street, earnings season is analogous to when students get their report cards. Publicly traded corporations in the United States are obliged by law to publish their financial statements every quarter. This occurs four times during an entire year. Regarding reporting, most businesses stick to the calendar year, although they can report based on their own internal fiscal calendars.
You may have guessed that profits, are generally the most significant statistic disclosed during earnings season. This is the number that typically receives the most attention and media coverage. However, it is vital to note that investors look at all financial data. Estimates of future profits are provided by stock analysts in advance of the release of financial reports (an estimate of the number they think earnings will hit). After that, research companies put all these predictions together to create the "consensus earnings estimate."
When a company's actual profits come in higher than these projections, it is referred to as an earnings surprise, and the shares will often go up. It is stated that a firm has disappointed when it reports results that are lower than these projections, and the price will typically go down as a result. Given all this, predicting how a stock will move during earnings season is challenging since it all comes down to expectations and company performance.
Earnings are important to investors since they are ultimately the factor that largely determines stock pricing. When earnings are solid, the stock price may go up (and vice versa). When a business's stock price is skyrocketing, it doesn't always signify that the firm is generating a lot of money; rather, it indicates that investors have high hopes that the company will succeed in the near future. It goes without saying that there are no assurances the firm will live up to the present anticipations of investors.
The rise and fall of the dot-com industry is a textbook example of a company's actual profits falling substantially short of the amounts that investors had anticipated. When the boom began, people became excited about the potential for any firm engaged with the Internet; as a result, stock prices skyrocketed. As time passed, it became abundantly evident that the promised profits from the dot coms would not even come close to being realized by the companies. The lofty values placed on these firms by the market simply could not be justified in the absence of profits, and as a direct consequence, the stock prices of these companies saw a precipitous decline. [1]
When a corporation is profitable, it may choose between two different courses of action out of several possible scenarios. To begin, it could enhance its existing items and create brand-new ones. Second, the company can return some of the money to shareholders by way of a dividend or buy back some of their own shares. In the first scenario, you put your faith in the management team to reinvest earnings with the expectation of furthering the company's financial success. Reinvesting profits is a common strategy used by younger firms to build shareholder value; however, dividend payments are generally more common among established businesses. Neither approach is inherently superior, but both are predicated on the same principle: that, over the course of a company's lifetime, profits should result in a return on the investments made by shareholders.
Earnings are a measurement of the money a business generates, and they are often assessed in terms of a metric called earnings per share (EPS), likely the single most significant indication of how healthy a company's finances are. Wall Street pays extreme attention to the quarterly earnings reports distributed four times. Earnings increasing over time are a positive indicator that a firm is heading in the correct direction with the hopes that it will provide a healthy return on investment for its shareholders.
Moomoo stock trading app provides visualized financial information to help investors to understand and evaluate individual stocks, like earnings per share (EPS), net assets per share, current ratio, gross margin, net margin, etc. Sign up and download the moomoo app today to access comprehensive information about the financial analysis of individual stocks!
[1] https://www.nasdaq.com/articles/reflecting-on-the-tech-bubble-of-2000-and-the-great-financial-crisis-2021-01-19
This presentation is for informational and educational use only and is not a recommendation or endorsement of any particular investment or investment strategy. Investment information provided in this content is general in nature, strictly for illustrative purposes, and may not be appropriate for all investors. Read more
Recommend

How to Trade During High Volatility (VIX > 25)
How to Day Trade Without $25,000

How to Start Day Trading for Beginners

Swing Trading Basics: Strategies & How It Works
How to Practice Day Trading (Day Trading Simulator Guide)
Intraday Trading Basics: How to Start & Benefits
ETF Tax Refund Guide: Understand Your Investment Returns
Stock Trading: A Beginner's Guide
How to Start Investing: A Beginner's Guide
How to Invest in Gold: Learn the Basics
Ethereum ETFs: How To Trade Spot Ethereum ETFs
What Is Copy Trading
What to Consider When Shifting from Paper Trading to Actual Trading
Investing During Earnings Season
How Stock Charting Tools Can Help You
What is Thematic Investing?
What Is Social Trading
6 ETF Concerns That Investors Shouldn’t Overlook
What Is Mirror Trading?
Company Earnings and Earnings per Share What Investors Need to Know
How to Use Paper Trading to Test and Help Refine Your Trading Strategy?
How to Practice Trading Without Risking Money?
Tax Trading Strategies in a Bear Market
What Are Market Orders?
Using Volume Oscillators to Confirm Price Movements
Price-to-Earnings (P/E) Ratio
What Is Working Capital?
What Is SWOT Analysis?
Choosing a Stock Simulator to Practice Stock Trading
What Is Revenue?
What Is A Recession?
Psychological Condition of the Market
What Is Beta in the Stock Market?
On-Balance Volume (OBV): What Is It?
What Is the Money Flow Index (MFI)?
Spot Market: What Is It?
What Does It Mean to Have a Certificate of Deposit (CD)?
What Is a Bellwether?
What Is the Spot Rate?
What Is a Volatility Smile?
What Is Historical Volatility (HV)?
What is Buying on Margin?
What Is Barbell Strategy?
How to Analyse Short Sale Volume in Trading
Trading Stocks Short: Overview
What is short selling?
Will ESG Investing Be The Future Of Investing?
How to Invest in the Hong Kong Stock Exchange - What Investors Should Know
Level 2 Market Data: How Advanced Traders Can Identify Value
Swing Trading vs. Day Trading: What's the Difference?
What Is a Day Order?
What Is the National Best Bid and Offer (NBBO) in US Equities?
What is Short Covering?
How to Find A Stock's Number of Shorted Shares?
What Is Trend Analysis?
TOP 10 Day Trading Strategies for Beginners
VWAP Trading Strategy - Volume Weighted Average Price
What is Maintenance Margin?
What Is Market Depth?
What Is Short Interest?
What Is a Trailing Stop and How to Use It?
Stock Split: Stock Trading Strategies for Advanced Traders
Scalping Stock Trading: How Does It Work?
Trading as a Side Hustle: How to get started
How to Pick Stocks: Invest Smarter with Stock Screener
Is Swing Trading More Profitable than Long-Term Trading?
Trade In A Bear Market With Short Sales
How to Trade During High Volatility (VIX > 25)
How to Day Trade Without $25,000
How to Start Day Trading for Beginners
Swing Trading Basics: Strategies & How It Works
How to Practice Day Trading (Day Trading Simulator Guide)
Intraday Trading Basics: How to Start & Benefits
ETF Tax Refund Guide: Understand Your Investment Returns
Stock Trading: A Beginner's Guide
How to Start Investing: A Beginner's Guide
How to Invest in Gold: Learn the Basics
Ethereum ETFs: How To Trade Spot Ethereum ETFs
What Is Copy Trading
What to Consider When Shifting from Paper Trading to Actual Trading
Investing During Earnings Season
How Stock Charting Tools Can Help You
What is Thematic Investing?
What Is Social Trading
6 ETF Concerns That Investors Shouldn’t Overlook
What Is Mirror Trading?
Company Earnings and Earnings per Share What Investors Need to Know
How to Use Paper Trading to Test and Help Refine Your Trading Strategy?
How to Practice Trading Without Risking Money?
Tax Trading Strategies in a Bear Market
What Are Market Orders?
Using Volume Oscillators to Confirm Price Movements
Price-to-Earnings (P/E) Ratio
What Is Working Capital?
What Is SWOT Analysis?
Choosing a Stock Simulator to Practice Stock Trading
What Is Revenue?
What Is A Recession?
Psychological Condition of the Market
What Is Beta in the Stock Market?
On-Balance Volume (OBV): What Is It?
What Is the Money Flow Index (MFI)?
Spot Market: What Is It?
What Does It Mean to Have a Certificate of Deposit (CD)?
What Is a Bellwether?
What Is the Spot Rate?
What Is a Volatility Smile?
What Is Historical Volatility (HV)?
What is Buying on Margin?
What Is Barbell Strategy?
How to Analyse Short Sale Volume in Trading
Trading Stocks Short: Overview
What is short selling?
Will ESG Investing Be The Future Of Investing?
How to Invest in the Hong Kong Stock Exchange - What Investors Should Know
Level 2 Market Data: How Advanced Traders Can Identify Value
Swing Trading vs. Day Trading: What's the Difference?
What Is a Day Order?
What Is the National Best Bid and Offer (NBBO) in US Equities?
What is Short Covering?
How to Find A Stock's Number of Shorted Shares?
What Is Trend Analysis?
TOP 10 Day Trading Strategies for Beginners
VWAP Trading Strategy - Volume Weighted Average Price
What is Maintenance Margin?
What Is Market Depth?
What Is Short Interest?
What Is a Trailing Stop and How to Use It?
Stock Split: Stock Trading Strategies for Advanced Traders
Scalping Stock Trading: How Does It Work?
Trading as a Side Hustle: How to get started
How to Pick Stocks: Invest Smarter with Stock Screener
Is Swing Trading More Profitable than Long-Term Trading?
Trade In A Bear Market With Short Sales

