
Moomoo Insights
Jul 16 15:38
TSMC Earnings: AI Demand Is Stronger Than the Chip Selloff Suggests
Moomoo Insights
Sep 30 05:04
Live Take | Anthropic’s $518B Compute Bet: Who Wins From the AI Buildout?
Intermediate and advanced traders might have heard about using Level 2 market data. But how does using Level 2 data help traders make better decisions?
This article explains the seldom explored topic of using Level 2 market data to place intraday trades.
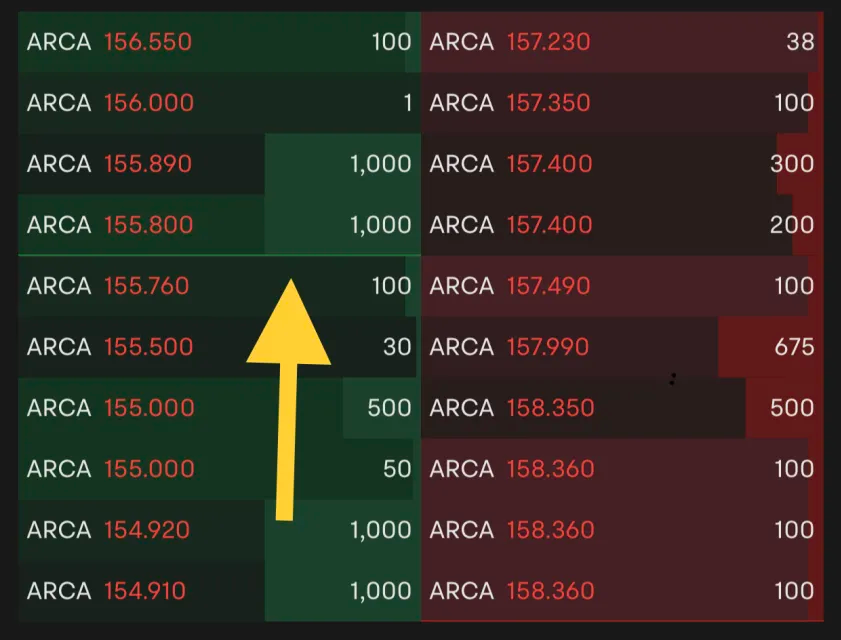
Level 2 stock quotes provide a record of the buyers and sellers of a given asset. This gives us information like:
• How many buyers and sellers there are
• How large the orders are
• What are the bids and asks made before a transaction happens
These orders can be placed through market makers or other market participants, including institutions or retail investors. Some orders will be placed through electronic communication networks (ECNs) as well.
The orders are updated in real-time, giving the most accurate information about potential moves in a stock for those who know how to interpret them.
You might be wondering how Level 2 data is different from the usual stock market data we get from Google or finance websites.
This usual data is also called Level 1 data and is easily available to most investors. It provides the following information:
• Bid/ask price
The bid price is the highest price at which someone has bought the asset. The ask price is the lowest price at which someone has sold the asset. This establishes the bid-ask spread which affects trade execution.
• Bid/ask volume
The bid/ask volume reveals the total number of units being bought or sold.
• Last price/volume
This tells traders what the last price someone traded this asset for and how many units they bought.
However, level 2 market data goes much deeper into the above. It provides traders with a set of the highest bid and lowest ask prices. Additionally, level 2 market data reveals the participants who placed the order.
These participants might be huge institutions and analysing their orders could be valuable for retail traders.
Before we continue, let us clarify some other terms which traders use when reading to Level 2 (or Level II) market data.
The records of transactions for a given asset can also be called an order book. This is simply another term for Level 2 market data.
Level 2 market data also shows the market depth because it shows the number of contracts available at each of the bid and ask prices. Market depth refers to the ability of a stock or asset’s ability to absorb large orders without a major impact to the current stock price.
In trading classics like Reminiscences of a Stock Operator, interpreting Level 2 market data can also be called “reading the tape”.
Level 2 data is used by intraday traders who want to capture small or fast price movements.
By catching many small price movements throughout the day, they reduce the chances of giving back their profits. The profits they gain from small price movements can add up over the course of a day.
Through studying the bid/ask prices and volume, experienced traders can get a sense of how the underlying asset’s price might trend in the next few minutes.
For example, if an asset’s bid prices are getting lower, it could mean the price is about to go lower. Potential buyers have begun offering less and less money for it at the top end.
On the other hand, if an asset’s ask prices are getting higher, it could mean the price is about to go up and gain strength in the short term.
Beyond the immediate price movements, level 2 market data might also reveal whether a stock might hold at a certain price. This is because market makers, institutions or large investors might place huge orders at a certain price.
This allows them to “lead” the price of a particular stock for a short duration.
By studying the Level 2 data, a trader can evaluate if some specific investor is setting the current prices and make his or her trades accordingly to follow the huge player’s trade.
Here are four key points in Level 2 market data for experienced traders.
Level 2 market data provides a range of the best bid and ask prices that have been placed for an underlying asset. Through these prices, traders can get the full picture of what the market is willing to pay.
Using this information, a significant gap between the highest bid and the next highest bid indicates the stock might not be particularly strong.
This is an advantage of using level 2 market data. By relying on level 1 market data alone, a trader will only be able to see the highest bid. They will not be able to identify the gap between the highest and second highest bid.
By analysing the market depth, traders can get a better understanding of the current value of the stock. This can better influence their decision to buy, sell, scale further or reduce their existing position.
The liquidity of the stock refers to how quickly shares of a stock can be bought or sold without huge moves in the stock price.
The lower the liquidity, the harder it is for an order to be filled. This typically results in losses from trade execution instead of price movements in the underlying stock.
Traders may struggle to sell it at the price they want, resulting in losses from a wide bid-ask spread that might be far from their target prices.
On the other hand, a stock with high liquidity will be easier to buy or sell at the target price.
With level 2 market data, traders can gauge the number and types of investors who are trading a stock. This gives them information about whether a particular stock is a good candidate for intraday trades.
Most experienced traders can generally sense the trend of a stock. To help improve their trades, they can work towards timing their trade entry based on what other market participants are doing.
This is crucial for traders who rely on scalping as their main strategy. For scalpers, their strategy relies on catching multiple small price movements throughout the trading day.
Through level 2 market data, scalpers can help identify the small price movements they need with better accuracy. As a result, they’ll be able to potentially catch a bigger chunk of a price movement.
Level 2 market data can also help traders better interpret the bid-ask spread.
While most traders focus on catching huge price movements in an underlying stock, experienced traders are aware that capitalizing on trade execution on the price movements can become profits in their trading accounts.
This is where understanding the bid-ask spread becomes crucial. When this spread remains low, it indicates buying and selling prices remain relatively close (refer to the paragraph on stock liquidity).
This makes it easier for traders to execute orders on the stock as the price is relatively stable. On the other hand, if you have a large spread, you will likely see less liquidity for those investments.
The price you see for the last transaction might not be the price you get for your buy or sell order.
At moomoo, we believe in empowering our users to make better decisions for their portfolios.
When you trade with a moomoo brokerage account, you get access to real-time level 2 market data. This data is free to access for moomoo account users.
For example, moomoo offers its users access to the depth chart of a particular stock.

Images provided are not current and any securities are shown for illustrative purposes only.
While level 2 market data shows traders the orders placed at each price, it can sometimes be hard to visualise the trends in the entire feed of numbers flashing on our screens.
With a depth chart, level 2 market data is presented in a graphical format. A depth chart can better present prices and order quantities to help investors better understand supply and demand.
• The X-Axis indicates the price distribution of all orders.
• The Y-Axis indicates the cumulative order numbers up to or down to a certain price (i.e., the number of orders needed to be filled for the stock to reach a certain price level).
When the gradient on the depth chart is steep, it indicates orders are concentrated at a certain price level.
When the gradient on the depth chart is gentle, it indicates that orders are spread out across different price levels.
Additionally, moomoo provides its users with real-time level 2 market data which is refreshed every 0.3 seconds with 60 levels of bid and ask prices.
Images provided are not current and any securities are shown for illustrative purposes only.
These features are useful for traders who plan to buy or sell a small number of shares. This can be due to a small portfolio or a position initiated on a relatively expensive stock.
Sign up and download moomoo today to start building your portfolio with the detailed information for trading.
Get started now and grow as you improve your trading strategies through analysing level 2 market data.
Level 2 data is free to moomoo users that have an approved brokerage account with Moomoo Financial Inc.
This presentation is for informational and educational use only and is not a recommendation or endorsement of any particular investment or investment strategy. Investment information provided in this content is general in nature, strictly for illustrative purposes, and may not be appropriate for all investors. Read more
Recommend
How to Trade During High Volatility (VIX > 25)
How to Day Trade Without $25,000
How to Start Day Trading for Beginners

Swing Trading Basics: Strategies & How It Works
How to Practice Day Trading (Day Trading Simulator Guide)
Intraday Trading Basics: How to Start & Benefits
ETF Tax Refund Guide: Understand Your Investment Returns
Stock Trading: A Beginner's Guide
How to Start Investing: A Beginner's Guide
How to Invest in Gold: Learn the Basics
Ethereum ETFs: How To Trade Spot Ethereum ETFs
What Is Copy Trading
What to Consider When Shifting from Paper Trading to Actual Trading
Investing During Earnings Season
How Stock Charting Tools Can Help You
What is Thematic Investing?
What Is Social Trading
6 ETF Concerns That Investors Shouldn’t Overlook
What Is Mirror Trading?
Company Earnings and Earnings per Share What Investors Need to Know
How to Use Paper Trading to Test and Help Refine Your Trading Strategy?
How to Practice Trading Without Risking Money?
Tax Trading Strategies in a Bear Market
What Are Market Orders?
Using Volume Oscillators to Confirm Price Movements
Price-to-Earnings (P/E) Ratio
What Is Working Capital?
What Is SWOT Analysis?
Choosing a Stock Simulator to Practice Stock Trading
What Is Revenue?
What Is A Recession?
Psychological Condition of the Market
What Is Beta in the Stock Market?
On-Balance Volume (OBV): What Is It?
What Is the Money Flow Index (MFI)?
Spot Market: What Is It?
What Does It Mean to Have a Certificate of Deposit (CD)?
What Is a Bellwether?
What Is the Spot Rate?
What Is a Volatility Smile?
What Is Historical Volatility (HV)?
What is Buying on Margin?
What Is Barbell Strategy?
How to Analyse Short Sale Volume in Trading
Trading Stocks Short: Overview
What is short selling?
Will ESG Investing Be The Future Of Investing?
How to Invest in the Hong Kong Stock Exchange - What Investors Should Know
Level 2 Market Data: How Advanced Traders Can Identify Value
Swing Trading vs. Day Trading: What's the Difference?
What Is a Day Order?
What Is the National Best Bid and Offer (NBBO) in US Equities?
What is Short Covering?
How to Find A Stock's Number of Shorted Shares?
What Is Trend Analysis?
TOP 10 Day Trading Strategies for Beginners
VWAP Trading Strategy - Volume Weighted Average Price
What is Maintenance Margin?
What Is Market Depth?
What Is Short Interest?
What Is a Trailing Stop and How to Use It?
Stock Split: Stock Trading Strategies for Advanced Traders
Scalping Stock Trading: How Does It Work?
Trading as a Side Hustle: How to get started
How to Pick Stocks: Invest Smarter with Stock Screener
Is Swing Trading More Profitable than Long-Term Trading?
Trade In A Bear Market With Short Sales
How to Trade During High Volatility (VIX > 25)
How to Day Trade Without $25,000
How to Start Day Trading for Beginners
Swing Trading Basics: Strategies & How It Works
How to Practice Day Trading (Day Trading Simulator Guide)
Intraday Trading Basics: How to Start & Benefits
ETF Tax Refund Guide: Understand Your Investment Returns
Stock Trading: A Beginner's Guide
How to Start Investing: A Beginner's Guide
How to Invest in Gold: Learn the Basics
Ethereum ETFs: How To Trade Spot Ethereum ETFs
What Is Copy Trading
What to Consider When Shifting from Paper Trading to Actual Trading
Investing During Earnings Season
How Stock Charting Tools Can Help You
What is Thematic Investing?
What Is Social Trading
6 ETF Concerns That Investors Shouldn’t Overlook
What Is Mirror Trading?
Company Earnings and Earnings per Share What Investors Need to Know
How to Use Paper Trading to Test and Help Refine Your Trading Strategy?
How to Practice Trading Without Risking Money?
Tax Trading Strategies in a Bear Market
What Are Market Orders?
Using Volume Oscillators to Confirm Price Movements
Price-to-Earnings (P/E) Ratio
What Is Working Capital?
What Is SWOT Analysis?
Choosing a Stock Simulator to Practice Stock Trading
What Is Revenue?
What Is A Recession?
Psychological Condition of the Market
What Is Beta in the Stock Market?
On-Balance Volume (OBV): What Is It?
What Is the Money Flow Index (MFI)?
Spot Market: What Is It?
What Does It Mean to Have a Certificate of Deposit (CD)?
What Is a Bellwether?
What Is the Spot Rate?
What Is a Volatility Smile?
What Is Historical Volatility (HV)?
What is Buying on Margin?
What Is Barbell Strategy?
How to Analyse Short Sale Volume in Trading
Trading Stocks Short: Overview
What is short selling?
Will ESG Investing Be The Future Of Investing?
How to Invest in the Hong Kong Stock Exchange - What Investors Should Know
Level 2 Market Data: How Advanced Traders Can Identify Value
Swing Trading vs. Day Trading: What's the Difference?
What Is a Day Order?
What Is the National Best Bid and Offer (NBBO) in US Equities?
What is Short Covering?
How to Find A Stock's Number of Shorted Shares?
What Is Trend Analysis?
TOP 10 Day Trading Strategies for Beginners
VWAP Trading Strategy - Volume Weighted Average Price
What is Maintenance Margin?
What Is Market Depth?
What Is Short Interest?
What Is a Trailing Stop and How to Use It?
Stock Split: Stock Trading Strategies for Advanced Traders
Scalping Stock Trading: How Does It Work?
Trading as a Side Hustle: How to get started
How to Pick Stocks: Invest Smarter with Stock Screener
Is Swing Trading More Profitable than Long-Term Trading?
Trade In A Bear Market With Short Sales

