

Moomoo Insights
Jul 16 15:38
TSMC Earnings: AI Demand Is Stronger Than the Chip Selloff Suggests
Moomoo Insights
Sep 30 05:04
Live Take | Anthropic’s $518B Compute Bet: Who Wins From the AI Buildout?
Stock charts are graphs that display the performance of a company's publicly traded shares. These graphs may display the stock performance of a firm across a range of time frames, from years to just a few days. During market hours, you may even follow the movement of a company's shares.
The line chart is probably the most straightforward pricing chart. It draws a single line connecting all of the stock's closing values over a specified period of time.
Despite its ease of use, the line chart may not provide traders with complete information about the day's action. However, it will help traders see trends and graphically contrast closing prices from one period to the next.
This strategy has some benefit for connecting a stock's trend or overall performance to the market without being overly concerned with intraday volatility because many brokerages base account valuation on closing price.
The bar chart, referred to as OHLC charts (open-high-low-close charts), which plots the open, close, high, and low values of stocks or other financial instruments as a series of prices over a given time period, is one of the fundamental tools of technical analysis.
A bar chart displays a stock's price and volume (the number of shares traded) over a period of time. For instance, a daily bar chart displays the number of shares traded daily along with the opening, closing, highest and lowest price for each day. The highest and lowest price for the entire week as well as the total volume for the entire week would be displayed in a weekly bar chart.

Images provided are not current and any securities are shown for illustrative purposes only.
There is a separate "bar" for each day in the aforementioned graphic. Each bar has a tiny "tick" on the left side indicating the day's opening price and a tiny "tick" on the right side indicating the day's closing price. The length of the bar indicates the trading range for that day.
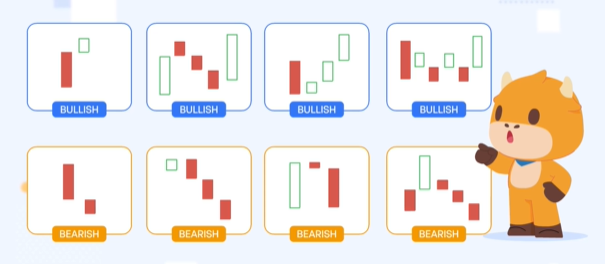
A version of the bar chart is the candlestick chart. By exhibiting separate "bodies" that are green or red depending on whether the stock closes higher or lower than the open, candles help visualize bullish or bearish emotion. The high and low prices are referred to as the wick or shadow, and the range between them is represented as the body.
Analysts can track price changes in a moving market with the use of candles. Trading signals for entry or exit may be made from specific candle combinations.
Buy and sell signals can be generated using technical indicators. You might choose a handful of indicators that you believe will assist you make wiser trading judgments.
Moving averages are an indicator layered over price charts that represents the average price of an asset across a certain time period. Moving averages can be short- or long-term, across daily, weekly, or even longer timeframes.
Investors and traders typically use moving averages not only to find levels that may act as support or resistance but to understand if a trend in an asset class is changing.
When short-term moving averages cross below or above a longer-term moving average, the event is called either a death cross or golden cross, named for the corresponding price action that typically follows. Death crosses are bearish, and may indicate that the asset will soon fall into a downtrend, while golden crosses are bullish and may indicate that the asset will increase in an upward trend.
The Relative Strength Index (RSI), developed by J. Welles Wilder, is a momentum indicator to measure the magnitude of recent price changes to indicate whether a stock or other asset price is overbought or oversold. The formula for the RSI is
where RS = Average Gain of n days up / Average Loss of n days down
According to Welles (1978), the standard n is 14, but this can be lowered to increase sensitivity or raised to decrease sensitivity. The parameters also depend on the volatility of the security.
Bollinger Bands are comprised of three lines – the upper, middle, and lower band. The middle band is a simple moving average (SMA) of the price over a defined period. The upper and lower bands are plotted at a defined standard deviation level above and below the simple moving average.
Bollinger Bands have two parameters, Period and Standard Deviations. Most trading applications use a 20-period moving average and two standard deviations as default values. However, traders can customize the parameter combinations.
Bollinger Bands are a volatility indicator that measures the relative high or low of a security's price in relation to previous trades. When the markets become more volatile, the bands widen; during less volatile periods, the bands contract.
Fibonacci retracements are a technical analysis tool that uses horizontal lines to indicate areas of support or resistance at the key Fibonacci levels before the price continues to move in the original direction.
As we know, the price of a security does not simply move in one way. It always moves up and down repeatedly. And traders believe that stocks and indices tend to retrace their paths after making a large move in either direction. When forecasting retracement levels, technicians often refer to a series of magic numbers that may help make trading decisions. The Fibonacci sequence is one of them.
Transitions between rising and sliding trends are frequently indicated by stock chart patterns. This is an introduction to a few typical patterns.
Support and resistance are two concepts commonly used in technical analysis.
Support refers to a price level where there's potential support to stop a downtrend.
Resistance is a price level where there's potential resistance to reverse an uptrend.
Support and resistance usually appear under the following circumstances.
Moving averages, such as the 5-day, 10-day, and 20-day moving averages, create support and resistance.
In an intraday trendline, the high and low points form support and resistance.
When a gap opening happens (i.e. the opening price is substantially higher or lower than the previous day's closing price), an upward gap serves as support and a downward gap serves as resistance.
Support and resistance can also be found in existing ascending or descending channels.
The head and shoulders pattern is a popular chart formation. The pattern consists of 3 tops, where the middle is the highest and the outer two are close in height. It is called the head and shoulders because the three peaks look like a "left shoulder," "head," and a "right shoulder," respectively.
Generally, a head and shoulders pattern signals a bullish-to-bearish trend reversal.
A double top pattern typically occurs at the end of an uptrend market. It's comprised of two consecutive rounding tops at roughly the same level with a valley in between, which looks like the letter "M." Generally, a double top is a bullish-bearish technical reversal pattern. It indicates that the price is likely to fall.
A double bottom pattern typically occurs at the end of a downtrend market. It's comprised of two consecutive rounding lows at roughly the same level with a peak in between, which looks like the letter 'W'. A double bottom is a bullish reversal pattern. It indicates the existing downtrend may have reached the lowest low and the price is predicted to rally.
An ascending triangle pattern typically forms in an uptrend. The pattern consists of two trendlines: a horizontal trendline and an ascending trendline. The horizontal trendline connects the swing highs, while the ascending trendline connects the swing lows. As the distance between the highs and lows narrows, which indicates less price fluctuation, the two trendlines ultimately converge, forming a triangle. Ascending triangles are considered a continuation pattern, which means that the stock price is predicted to continue in the prior direction, providing potential entry points for traders.
A descending triangle pattern typically forms in a downtrend. The pattern consists of two trendlines, a horizontal trendline and a descending trendline. The horizontal trendline connects the swing lows, while the descending trendline connects a series of lower highs. As the distance between the highs and lows narrows, this indicates less price volatility, and when the two trendlines finally meet, it forms a triangle. Descending triangles are considered a bearish continuation pattern, as the lower highs suggest stronger downside momentum. The prior downtrend is predicted to continue when the stock price breaks out from the triangle area.
The bull flag is considered a continuation pattern that occurs in a strong uptrend. It consists of two parts: the flagpole and the flag and resembles the letter "F". The flagpole is generally a pronounced uptrend, and the flag is a period of market consolidation that follows the uptrend. In a bull flag pattern, the price consolidates within two almost parallel trendlines - also known as a channel - in the opposite direction of the uptrend. After the consolidation phase, the price is predicted to break above the resistance line and continue moving upward. In general, the potential price target for a bull flag is based on the breakout point plus the height of the flagpole.
The bear flag is considered a continuation pattern that forms in a downtrend and is the inverse of the bull flag. The pattern also consists of two parts: the flagpole and the flag. The flagpole is typically a pronounced downtrend, and the flag is a period of upward consolidation that follows the downtrend. In a bear flag pattern, the price action consolidates within two almost parallel trendlines - also known as a channel - in the opposite direction of the downtrend. After the consolidation phase, the price is predicted to break through the flag-like range and continue moving downward. Traders might argue that a potential price target for the bear flag is based on the breakout point less the size of the flagpole.
The bullish pennant is considered a bullish continuation pattern consisting of three parts: the flagpole, the pennant, and the breakout. The flagpole is an initial strong movement to the upside. The pennant represents a period of consolidation between two converging trendlines. And the breakout is the continuation of the prior upward move. Traders might argue that a potential price target for the bullish pennant is based on the breakout point plus the size of the flagpole.
The bearish pennant is considered a bearish continuation pattern. It is the opposite of a bullish pennant. The pattern also has three components: the flagpole, the pennant, and the breakout. The flagpole is an initial strong movement to the downside. The pennant represents a period of consolidation between two converging trendlines. And the breakout is the continuation of the prior downward move. For a bearish pennant, traders might argue that a potential price target is based on the breakout point less the size of the flagpole.
1、Assists in spotting trends and patterns: Traders and investors who are trying to understand market patterns frequently use stock chart patterns as a tool. Stock chart patterns, which form the foundation of technical analysis, can be used along with a wide range of technical indicators and tools to help traders develop insights and strategies around stock patterns, previous results, and emerging trends.
2、Offers technical analysis: A variety of technical indicators are available with stock charting tools to assist investors to decide whether to purchase or sell a stock. These indicators can offer useful insights into market trends and price momentum as well as assist investors in determining if a company is overbought or oversold.
3、Provide real-time data: A lot of stock charting software offers real-time information on stock prices and trading activity. Day traders notably need to be able to quickly decide whether to purchase or sell a stock using this information.
4、Supports fundamental analysis: To help investors make better choices, stock charting may be utilized in combination with fundamental research. Investors may better comprehend a company's financial performance and decide when to purchase or sell its shares by keeping an eye on stock price changes and market trends.
1、Get familiar with the fundamentals of technical analysis: By examining previous chart patterns and formations, technical analysis is a technique for forecasting the future direction of a market's price.
2、Keep an eye on the news and other external factors: Investors may obtain important insights into the stock market and make better judgments about whether to purchase or sell a stock by keeping up with economic data, business news, political developments, and industry trends.
3、Employ a variety of indicators and chart kinds: When utilizing indicators and chart types, the objective is to locate trading opportunities. For example, a moving average crossover often signals an upcoming trend change. In this case, using the moving average indicator on a price chart enables traders to spot potential turning points for a trend, which presents a trading opportunity.
4、Create a trading plan and stick to it: You may establish the specifications of your ideal transaction and make rational trading selections with the aid of a trading plan. You may avoid making irrational judgments in the heat of the moment by having a solid trading plan.
Moomoo stock trading app provides investors with powerful stock charting tools to meet various investors' charting needs and help to make investing decisions. Moomoo stock charting tools consist of 38 types of charts, support for saving and synchronization of charts, and customized color patterns, etc. Download the moomoo app today to unlock these free charting tools!
This presentation is for informational and educational use only and is not a recommendation or endorsement of any particular investment or investment strategy. Investment information provided in this content is general in nature, strictly for illustrative purposes, and may not be appropriate for all investors. Read more
Recommend
How to Trade During High Volatility (VIX > 25)
How to Day Trade Without $25,000
How to Start Day Trading for Beginners

Swing Trading Basics: Strategies & How It Works
How to Practice Day Trading (Day Trading Simulator Guide)
Intraday Trading Basics: How to Start & Benefits
ETF Tax Refund Guide: Understand Your Investment Returns
Stock Trading: A Beginner's Guide
How to Start Investing: A Beginner's Guide
How to Invest in Gold: Learn the Basics
Ethereum ETFs: How To Trade Spot Ethereum ETFs
What Is Copy Trading
What to Consider When Shifting from Paper Trading to Actual Trading
Investing During Earnings Season
How Stock Charting Tools Can Help You
What is Thematic Investing?
What Is Social Trading
6 ETF Concerns That Investors Shouldn’t Overlook
What Is Mirror Trading?
Company Earnings and Earnings per Share What Investors Need to Know
How to Use Paper Trading to Test and Help Refine Your Trading Strategy?
How to Practice Trading Without Risking Money?
Tax Trading Strategies in a Bear Market
What Are Market Orders?
Using Volume Oscillators to Confirm Price Movements
Price-to-Earnings (P/E) Ratio
What Is Working Capital?
What Is SWOT Analysis?
Choosing a Stock Simulator to Practice Stock Trading
What Is Revenue?
What Is A Recession?
Psychological Condition of the Market
What Is Beta in the Stock Market?
On-Balance Volume (OBV): What Is It?
What Is the Money Flow Index (MFI)?
Spot Market: What Is It?
What Does It Mean to Have a Certificate of Deposit (CD)?
What Is a Bellwether?
What Is the Spot Rate?
What Is a Volatility Smile?
What Is Historical Volatility (HV)?
What is Buying on Margin?
What Is Barbell Strategy?
How to Analyse Short Sale Volume in Trading
Trading Stocks Short: Overview
What is short selling?
Will ESG Investing Be The Future Of Investing?
How to Invest in the Hong Kong Stock Exchange - What Investors Should Know
Level 2 Market Data: How Advanced Traders Can Identify Value
Swing Trading vs. Day Trading: What's the Difference?
What Is a Day Order?
What Is the National Best Bid and Offer (NBBO) in US Equities?
What is Short Covering?
How to Find A Stock's Number of Shorted Shares?
What Is Trend Analysis?
TOP 10 Day Trading Strategies for Beginners
VWAP Trading Strategy - Volume Weighted Average Price
What is Maintenance Margin?
What Is Market Depth?
What Is Short Interest?
What Is a Trailing Stop and How to Use It?
Stock Split: Stock Trading Strategies for Advanced Traders
Scalping Stock Trading: How Does It Work?
Trading as a Side Hustle: How to get started
How to Pick Stocks: Invest Smarter with Stock Screener
Is Swing Trading More Profitable than Long-Term Trading?
Trade In A Bear Market With Short Sales
How to Trade During High Volatility (VIX > 25)
How to Day Trade Without $25,000
How to Start Day Trading for Beginners
Swing Trading Basics: Strategies & How It Works
How to Practice Day Trading (Day Trading Simulator Guide)
Intraday Trading Basics: How to Start & Benefits
ETF Tax Refund Guide: Understand Your Investment Returns
Stock Trading: A Beginner's Guide
How to Start Investing: A Beginner's Guide
How to Invest in Gold: Learn the Basics
Ethereum ETFs: How To Trade Spot Ethereum ETFs
What Is Copy Trading
What to Consider When Shifting from Paper Trading to Actual Trading
Investing During Earnings Season
How Stock Charting Tools Can Help You
What is Thematic Investing?
What Is Social Trading
6 ETF Concerns That Investors Shouldn’t Overlook
What Is Mirror Trading?
Company Earnings and Earnings per Share What Investors Need to Know
How to Use Paper Trading to Test and Help Refine Your Trading Strategy?
How to Practice Trading Without Risking Money?
Tax Trading Strategies in a Bear Market
What Are Market Orders?
Using Volume Oscillators to Confirm Price Movements
Price-to-Earnings (P/E) Ratio
What Is Working Capital?
What Is SWOT Analysis?
Choosing a Stock Simulator to Practice Stock Trading
What Is Revenue?
What Is A Recession?
Psychological Condition of the Market
What Is Beta in the Stock Market?
On-Balance Volume (OBV): What Is It?
What Is the Money Flow Index (MFI)?
Spot Market: What Is It?
What Does It Mean to Have a Certificate of Deposit (CD)?
What Is a Bellwether?
What Is the Spot Rate?
What Is a Volatility Smile?
What Is Historical Volatility (HV)?
What is Buying on Margin?
What Is Barbell Strategy?
How to Analyse Short Sale Volume in Trading
Trading Stocks Short: Overview
What is short selling?
Will ESG Investing Be The Future Of Investing?
How to Invest in the Hong Kong Stock Exchange - What Investors Should Know
Level 2 Market Data: How Advanced Traders Can Identify Value
Swing Trading vs. Day Trading: What's the Difference?
What Is a Day Order?
What Is the National Best Bid and Offer (NBBO) in US Equities?
What is Short Covering?
How to Find A Stock's Number of Shorted Shares?
What Is Trend Analysis?
TOP 10 Day Trading Strategies for Beginners
VWAP Trading Strategy - Volume Weighted Average Price
What is Maintenance Margin?
What Is Market Depth?
What Is Short Interest?
What Is a Trailing Stop and How to Use It?
Stock Split: Stock Trading Strategies for Advanced Traders
Scalping Stock Trading: How Does It Work?
Trading as a Side Hustle: How to get started
How to Pick Stocks: Invest Smarter with Stock Screener
Is Swing Trading More Profitable than Long-Term Trading?
Trade In A Bear Market With Short Sales

