Approaching Post-Earnings IV Crush With Options
Earnings announcements often create significant volatility in the options market, particularly through the phenomenon known as implied volatility (IV) crush. After an earnings report, the uncertainty that drove high IV typically resolves, leading to a sharp decline in IV and a corresponding drop in option premiums. This IV crush can pose a challenge for option buyers but presents a unique opportunity for traders using short Vega strategies, which benefit from decreasing IV. By understanding and preparing for IV crush, traders can position themselves to potentially profit from the post-earnings environment.
This article will break down the following:
Why IV Drops After Earnings
Identifying Opportunities Using moomoo's Earnings Tools
Common Strategies for Post-Earnings Trades
Using moomoo's Strategy Builder to Customize Your Approach
Conclusion
1. Why IV Drops After Earnings
After an earnings announcement, the uncertainty surrounding a company's performance—such as potential surprises in revenue, earnings per share, or guidance—typically resolves. This resolution leads to a phenomenon known as IV crush, where implied volatility drops sharply as the market adjusts to new information. Here's why IV typically drops after earnings:
Reduced Uncertainty: The earnings report removes the unknown factors that drove IV higher, such as whether the company will beat or miss expectations.
Lower Hedging Demand: Before earnings, investors often buy options to hedge against potential price swings. After the announcement, this demand decreases, reducing IV.
Market Maker Adjustments: Market makers, who previously increased IV to account for potential price swings, now lower IV to reflect the reduced risk of volatility.
This IV crush causes option premiums to drop significantly, often even if the stock price moves in the trader's favor. For option buyers (long Vega positions), this can lead to losses, but for option sellers or traders using short Vega strategies, IV crush presents an opportunity to profit from the decline in option premiums. By understanding this dynamic, traders can try to take advantage of the IV drop on earnings day.
2. Identifying Potential Opportunities Using moomoo's Earnings Tools
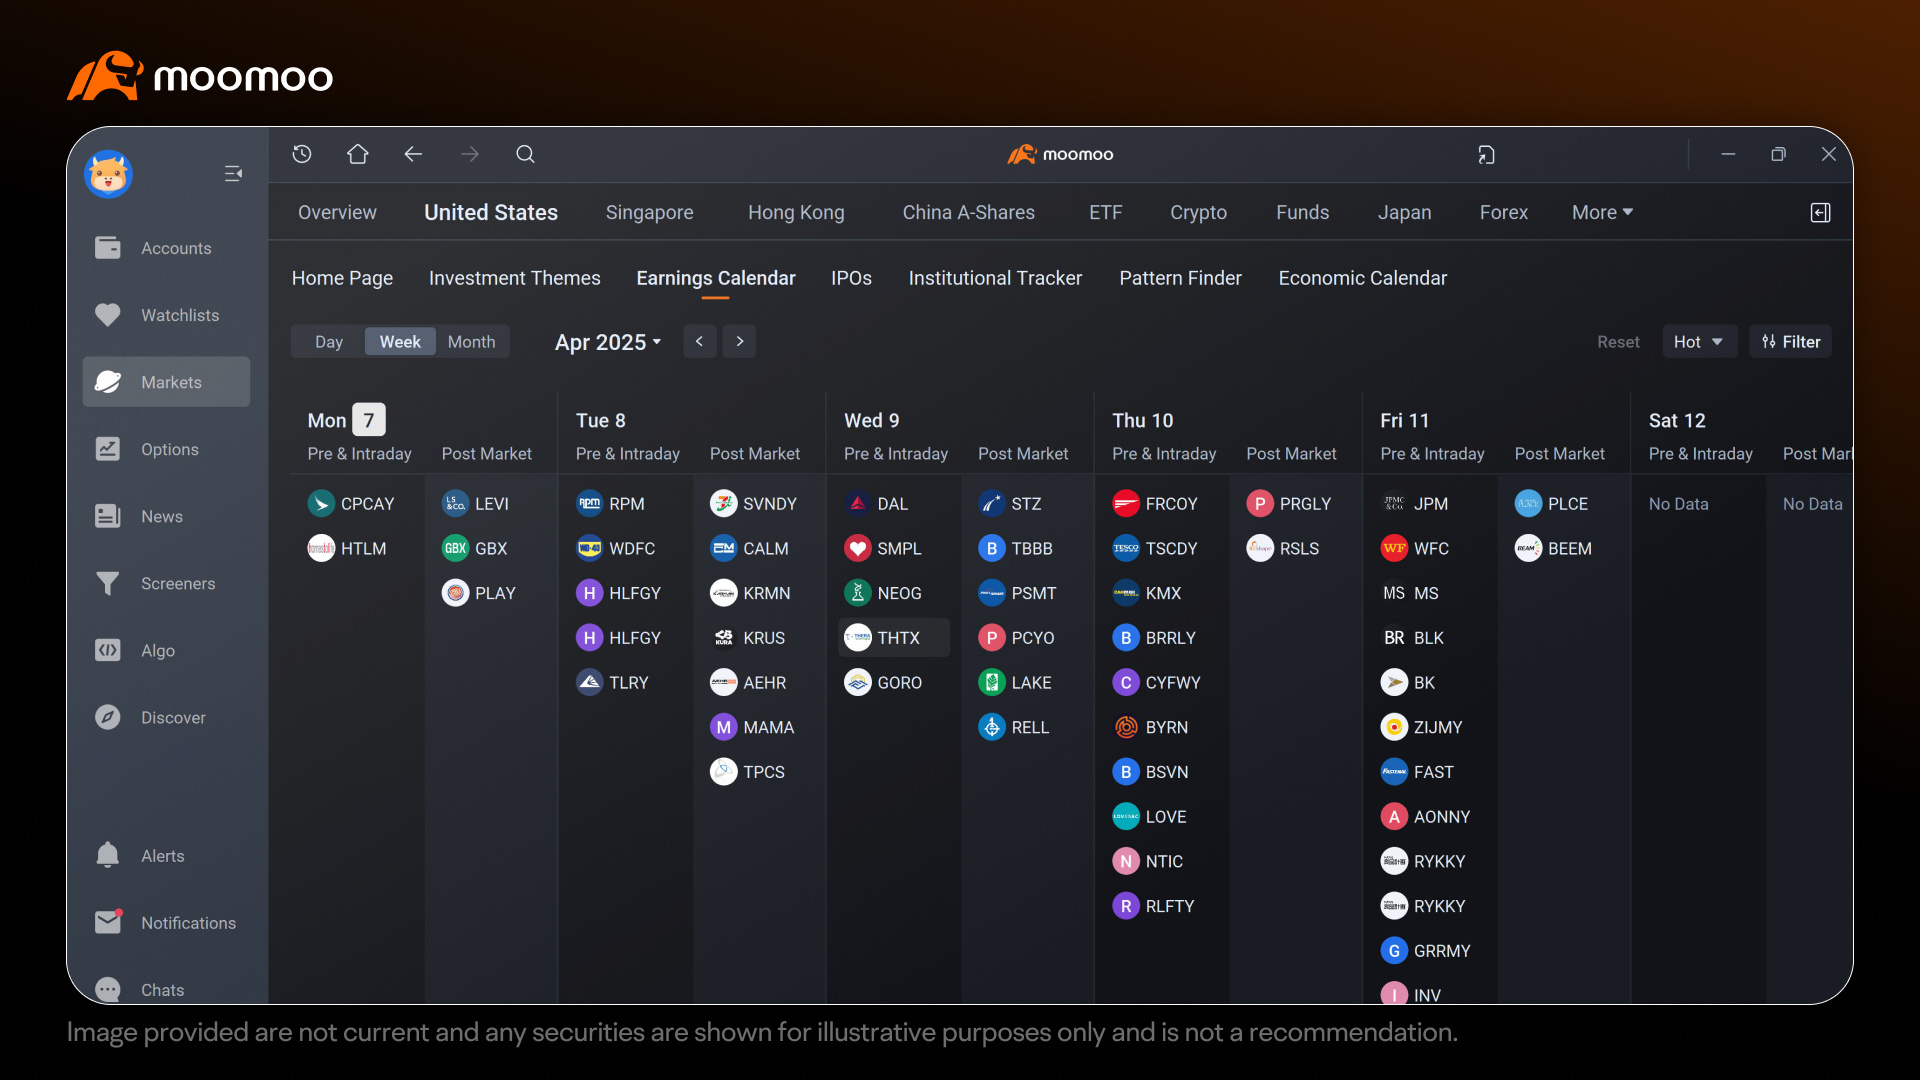
To identify potential IV crush setups, traders can use moomoo's earnings tools to analyze stocks reporting earnings, focusing on historical IV patterns and price movements. By navigating to moomoo's Earnings Calendar, you can explore upcoming earnings announcements by date, helping to identify stocks to consider for a IV crush trading strategy.
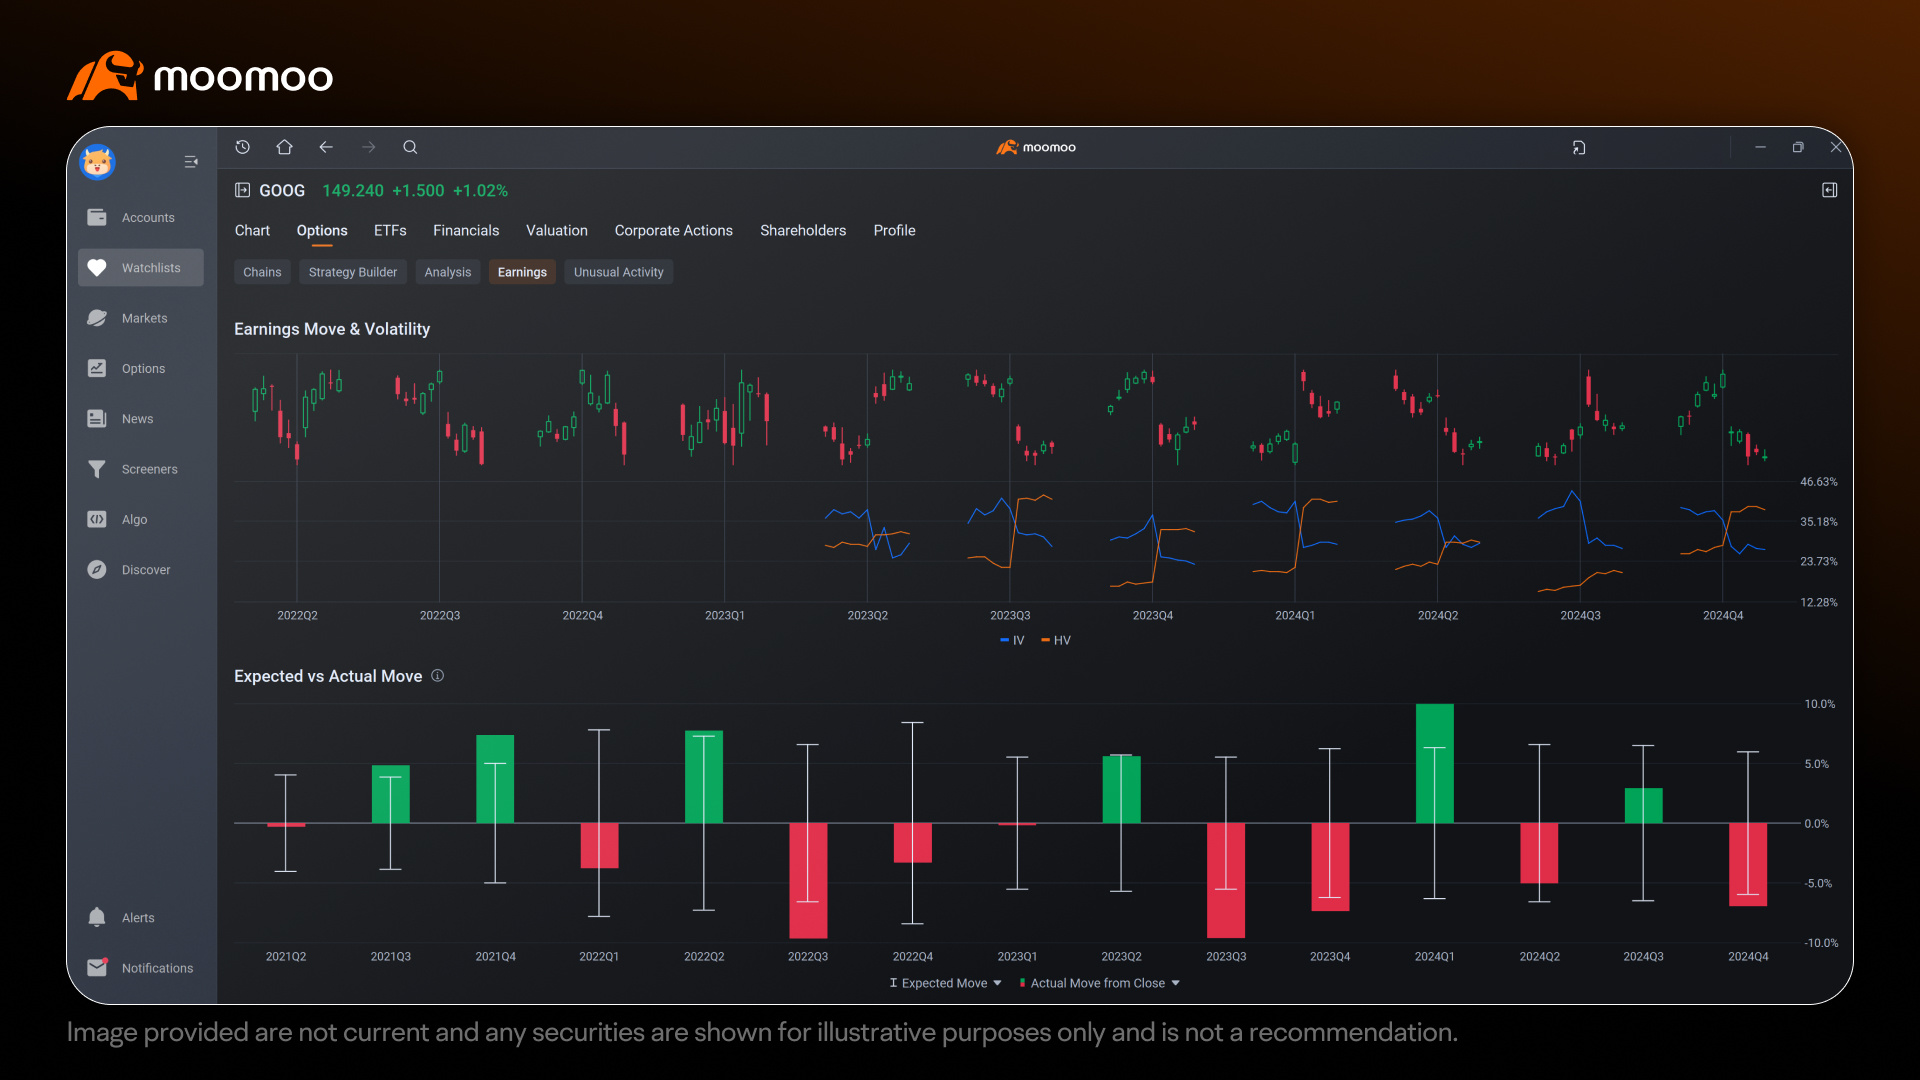
Moomoo's earnings tool assists in identifying opportunities for earnings trades by examining stocks that can potentially experience a significant IV drop, which can benefit short Vega strategies, and by assessing whether the stock's price movement aligns with market expectations, helping to guide your strategy and strike price selection. Here's a streamlined guide to using these tools:
3. Identifying Stocks with Historically Significant IV Drops After Earnings

Using the Earnings Move & Volatility Chart to Spot IV Crush Patterns: moomoo's platform includes an Earnings Move & Volatility Chart that displays historical pre vs post earnings price movements and IV trends over multiple earnings cycles, showing IV behavior for several days before and after earnings. The goal is to find stocks with a consistent history of IV decreases after earnings, as a sharp IV drop reduces option premiums, benefiting short Vega strategies. It can be beneficial to look for stocks where the IV line has consistently fallen in the days following earnings across several quarters. A consistent downward trend (e.g., IV decreases in most or all past earnings periods) suggests a higher probability of IV crush after the upcoming earnings announcement, making the stock a potential candidate for a short Vega trade. While historical data doesn’t guarantee future results, a consistent pattern can provide a useful indication of potential behavior. If the IV trend is inconsistent—say, it drops in some quarters but stays flat or rises in others (a 50/50 pattern)—the stock may not be reliable for short Vega strategies. This unpredictability can reduce profit potential, as short Vega trades rely on falling IV, and increases the risk of misjudging trade if IV remains high due to lingering market uncertainty. Consider stocks with a more consistent IV crush history may potentially improve the odds of success.
4. Comparing Actual vs. Expected Price Moves to Evaluate Option Strategies
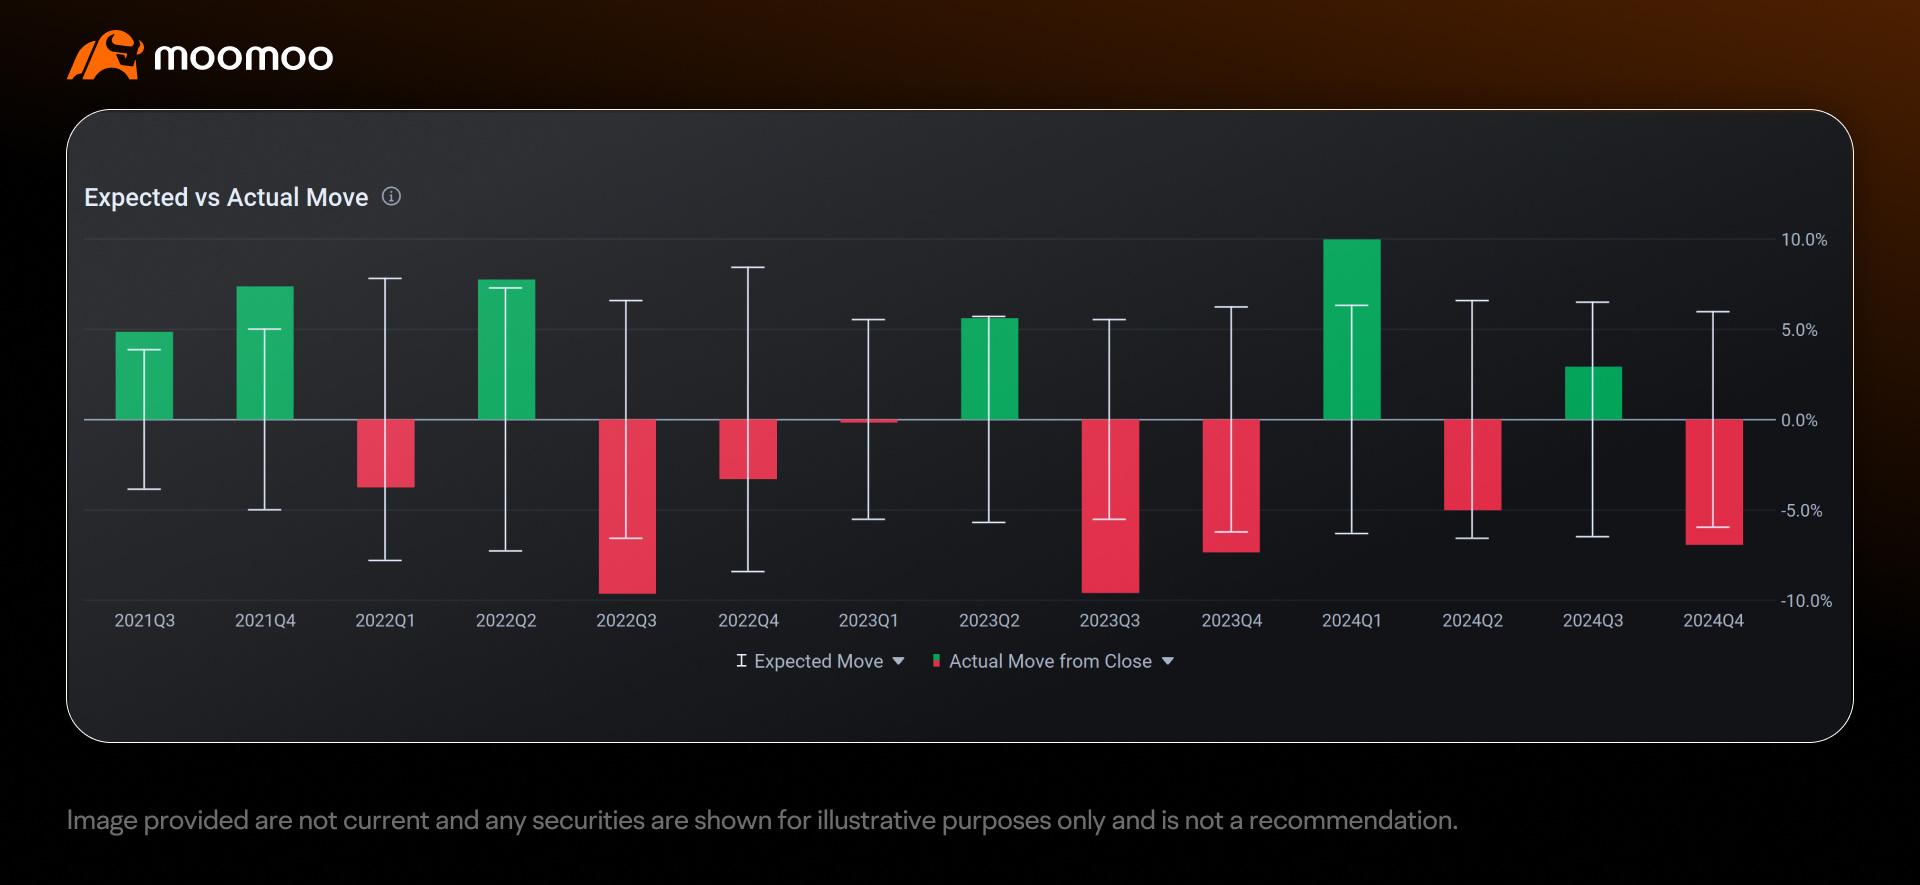
Visualizing Trends with the Expected vs. Actual Move Chart: moomoo's platform provides an "Expected vs. Actual Move" Chart to help you compare the expected price move (based on pre-earnings implied volatility) to the actual price move on the earnings day across multiple earnings periods. The expected move is calculated daily before earnings by adding the weighted ATM straddle and the first two weighted OTM strangles, then dividing by the current stock price, with the most recent value displayed by default. The chart visually displays the expected and actual moves for each period, allowing traders to quickly see if the stock's actual move typically falls within, exceeds, or is below the expected move. This visual representation helps traders identify patterns in the stock's price behavior on earnings days, providing a high-level understanding of whether the stock tends to move more or less than the market anticipates.
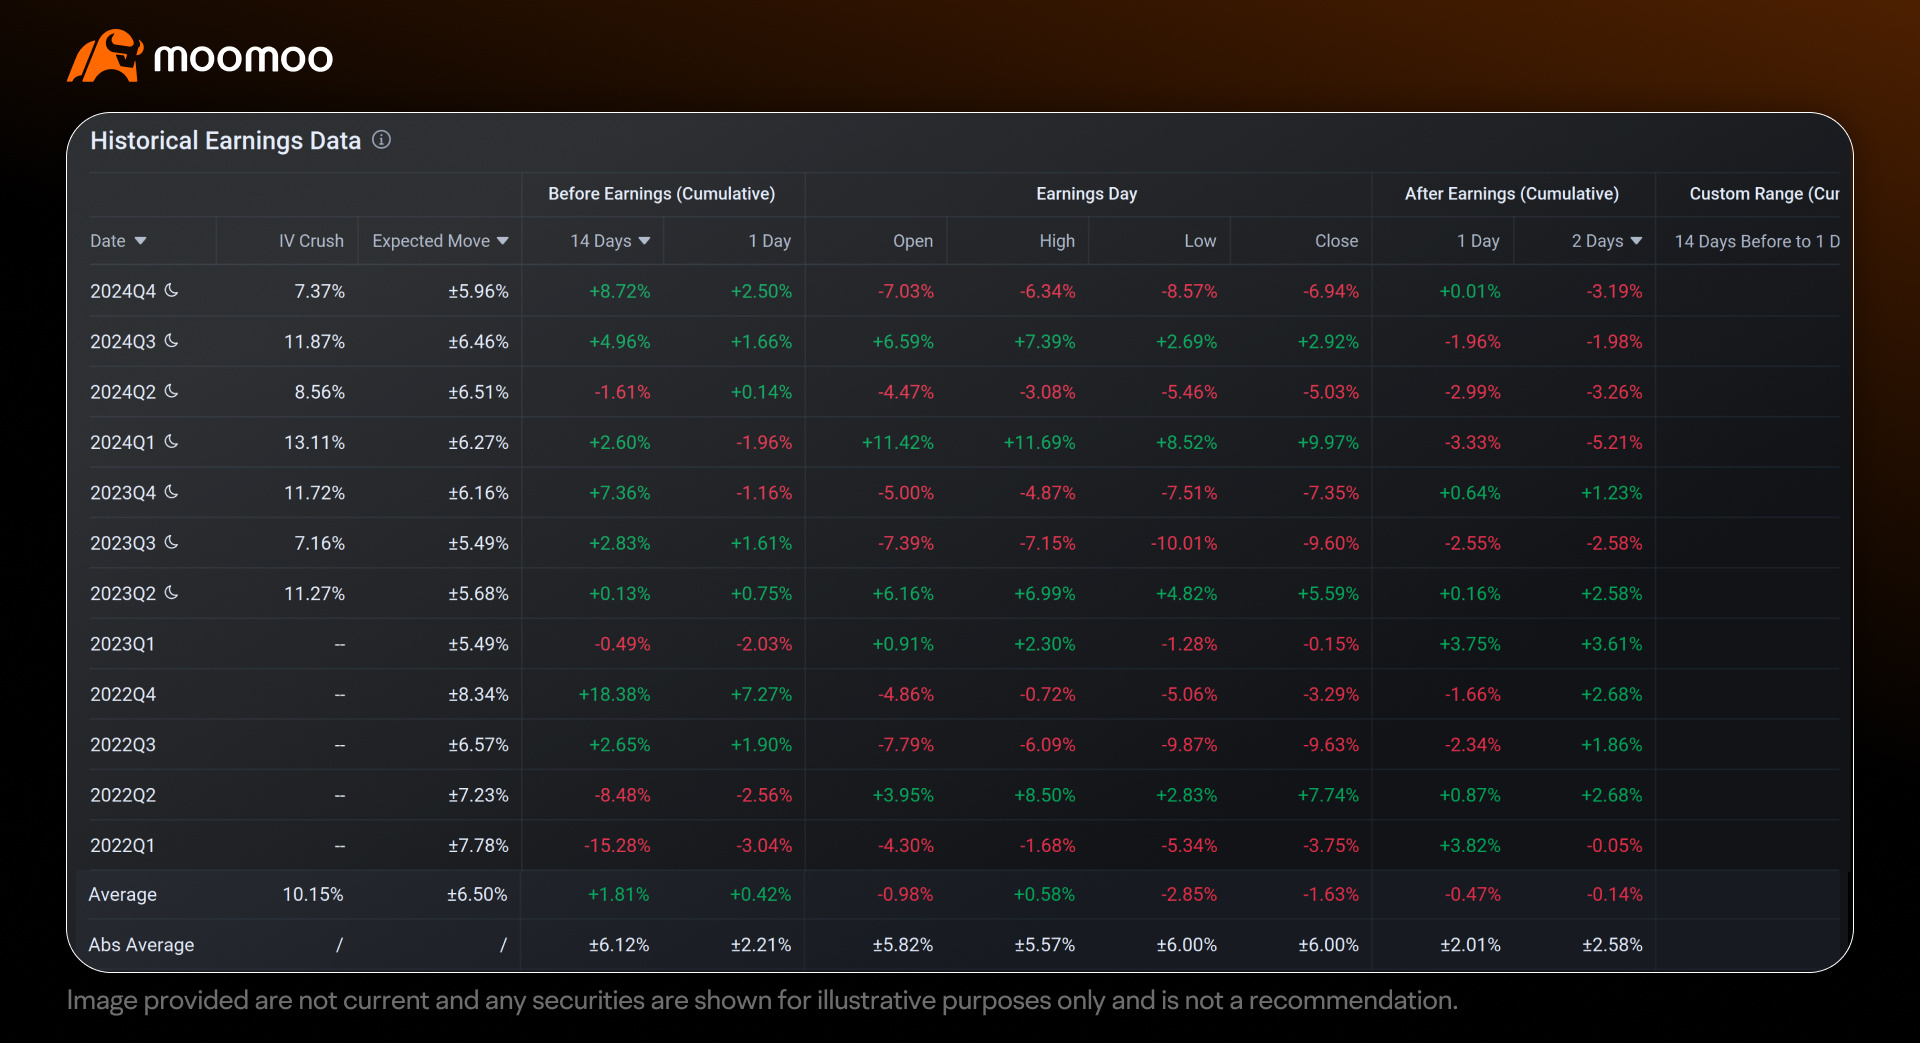
Diving Deeper with the Historical Earnings Data: Moomoo provides a Historical Earnings Data table with detailed numerical data to support a trader's analysis. The "Earnings Day" columns (Open, High, Low, Close) show the actual price changes on the earnings day, calculated as percentage changes from the previous day's close to the respective price points. The table also includes a column next to "IV Crush" that, by default, displays the "Expected Move" (EM) for each earnings cycle, represent the latest expected price range (± percentage) based on pre-earnings implied volatility. Traders can toggle this column to display the "Max EM" (Maximum Expected Move), which reflects the highest expected move value observed during the given period, offering a more cautious estimate of the potential price swing. By comparing the actual moves (from the "Earnings Day" columns) to the expected moves (from the "Expected Move"/"Max EM" column), traders can quantify whether the stock tends to move more or less than expected on the earnings day, complementing the visual insights from the chart.
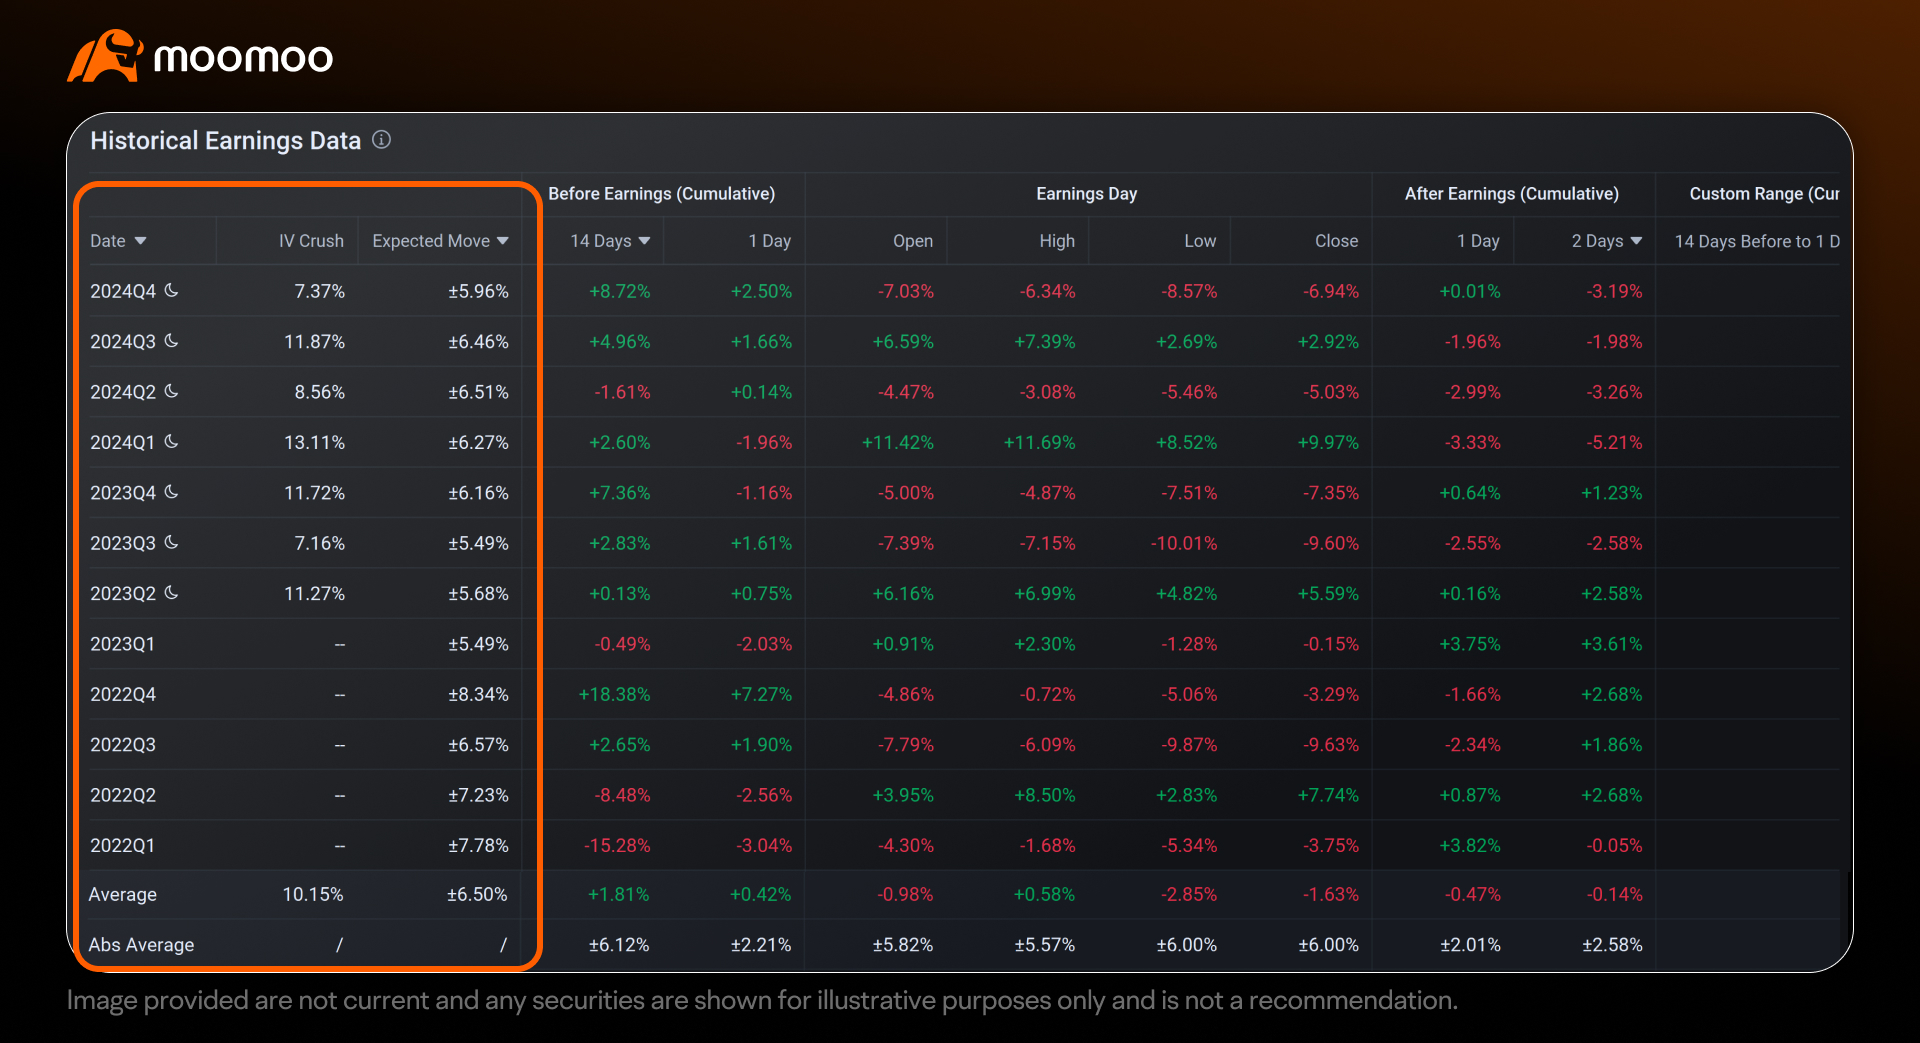
Analyzing IV Crush for Consistency and Magnitude: After looking at IV trends in the Earnings Move & Volatility Chart, using the "IV Crush" column in the Historical Earnings Data table to confirm the reliability and magnitude of the IV drop can add additional context. A consistently high IV crush (e.g., significantly above a moderate threshold in most periods) reinforces the suitability of short Vega strategies, as it indicates a reliable drop in option premiums. If the IV crush is inconsistent or low (e.g., frequently below a moderate threshold), the potential profit from short Vega strategies may be reduced, increasing the risk of sustained IV hurting short Vega option strategies.
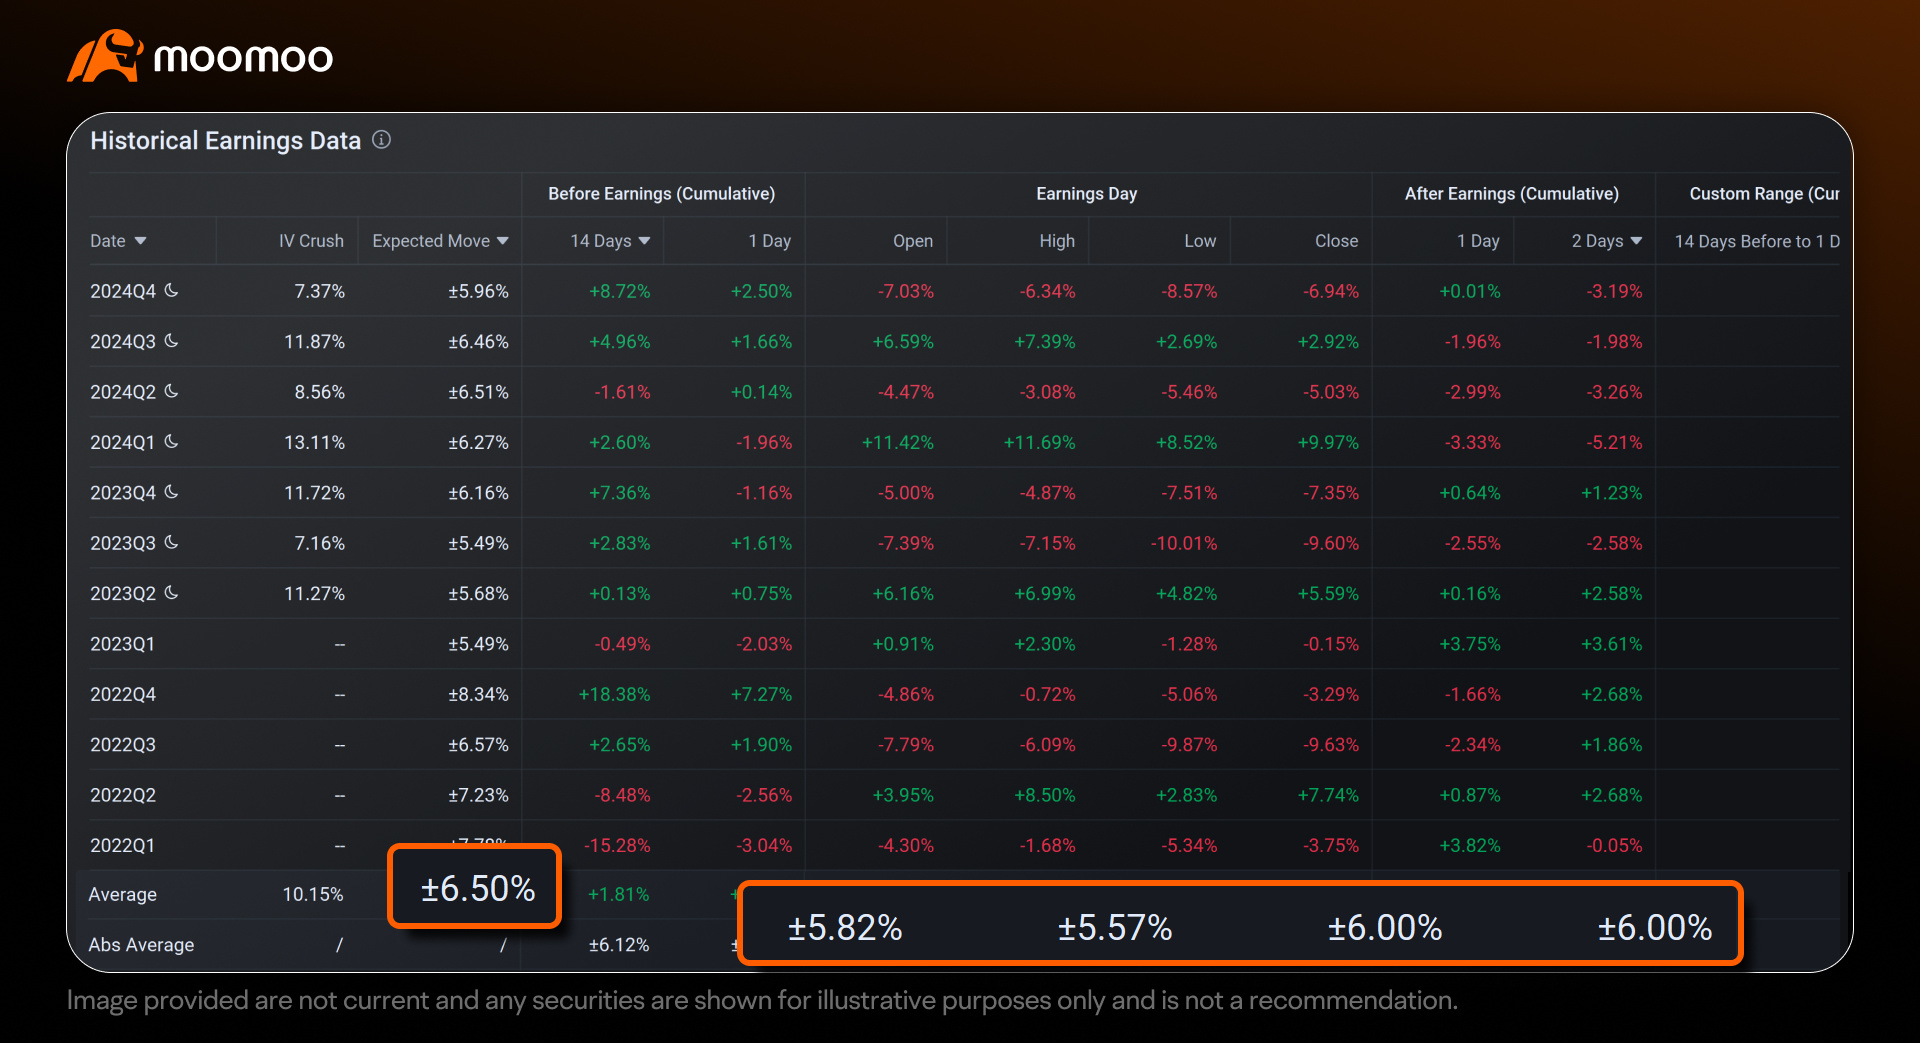
Analyzing Absolute Average for Price Movement Insight: At the bottom of the Historical Earnings Data, the "Abs Average" row provides insight into the stock's typical price movement on the earnings day. Traders can use the "Earnings Day" columns (Open, High, Low, Close) to analyze price movements at different points, depending on their strategy. For example, the "Abs Average" for the "Close" column reflects the average magnitude of the price movement, regardless of direction, by taking the absolute value of each period's move before averaging, offering a standardized measure for historical analysis. By comparing the "Abs Average" (e.g., based on the "Close" column or another column of your choice) to the average "Expected Move" (calculated as the mean of the "Expected Move" column across all periods, or "Max EM" for a conservative approach), you can determine if the stock’s typical price move on the earnings day is smaller than, in line with, or exceeds the expected move. This comparison is can be vital piece of information for non-directional strategies, as it focuses on the size of the price move rather than its direction, helping you assess whether the stock's movement aligns with market expectations.
Why It Matters: This combined analysis of IV crush and price movement can help traders decide between short Vega and long Vega strategies, while also assisting in the selection of appropriate strike prices:
If the "IV Crush" is consistently high and the "Abs Average" of the actual move on the earnings day (e.g., based on the "Close" column) is smaller than the average "Expected Move" (or "Max EM"), short Vega strategies (e.g., short straddles, short strangles, iron condors) are likely to perform well. The stock’s limited movement reduces the risk of exceeding the expected range, potentially allowing traders to profit from the IV drop after the earnings release (whether pre-market or after-hours). For example, in a short strangle, traders can select out-of-the-money (OTM) strikes beyond the "Abs Average" (e.g., if the "Abs Average" is 4%, choosing strikes more than 4% away from the current price), possibly minimizing the risk of the stock moving the position, regardless of when the trade is closed on earnings day.
If the "IV Crush" is inconsistent or low or the "Abs Average" consistently exceeds the average "Expected Move" (or "Max EM"), long Vega strategies might be more suitable. A larger-than-expected price move could offset a smaller IV crush, potentially leading to profits. For example, in a long straddle, if the "Abs Average" is 8% but the "Expected Move" is 6%, traders can select at-the-money (ATM) strikes to possibly maximize gains from the larger move, potentially outweighing the IV crush’s impact, depending on when the trade is closed. For short Vega strategies, traders would need much wider strikes (e.g., beyond 8%) to reduce risk, but the likelihood of the stock moving past those strikes can make these strategies less attractive.
5. Insight: Applying Your Analysis
Traders can use insights from moomoo's Earnings tools to help guide strategy selection and strike price for a potential for a potential earnings trade:
Step 1: Reviewing the Expected vs. Actual Move Chart
Using the "Expected vs. Actual Move" chart to see how the stock's actual price moves on earnings days compare to the expected moves across several past earnings periods. This helps you spot patterns—does the stock typically move more, less, or about the same as the market expects?
Step 2: Checking the IV Crush Pattern in the Historical Earnings Data
Looking at the "IV Crush" column in the Historical Earnings Data table can help to confirm if the stock consistently experiences a significant IV drop after earnings. Some traders aim for a high and reliable IV crush (e.g., a large percentage drop in most periods), as this benefits short Vega strategies by reducing option premiums.
Step 3: Comparing the Stock’s Typical Move to the Expected Move
In the Historical Earnings Data table, the "Abs Average" row (e.g., in the "Close" column) can be used to see the stock’s typical price move on earnings days, regardless of direction. Some traders then compare this to the average "Expected Move" (or "Max EM" for a more conservative estimate) across the same periods:The average "Expected Move" can be calculated by taking the mean of the "Expected Move" values in the table.
Alternatively, the "Max EM" toggle can be used for a cautious approach, which shows the highest expected move observed in each period.
Step 4: Choosing Your Strategy and Strike Prices Based on the Comparison
The results from Steps 1-3 can be useful in deciding on your strategy and strike prices:If the IV crush is consistently high and the "Abs Average" is smaller than the average "Expected Move" (or "Max EM"): Favor short Vega strategies like short straddles, short strangles, or iron condors. The stock is likely to move less than expected, and the IV drop will reduce option premiums, potentially benefiting your position. Traders can select out-of-the-money (OTM) strikes beyond the "Abs Average" (e.g., if the "Abs Average" is 4%, choose strikes more than 4% away from the current price) to potentially minimize the risk of the stock moving against you.
If the "Abs Average" exceeds the average "Expected Move" (or "Max EM") or the IV crush is inconsistent or low: Opting for long Vega strategies like long straddles or strangles can possibly capture the larger-than-expected price move. Using at-the-money (ATM) strikes for a straddle can potentially maximize gains from the move, but its prudent to be cautious of the IV crush reducing premiums. For a strangle, selecting OTM strikes just beyond the expected move can help to balance cost and profit potential.
Important note: Historical data, such as past IV patterns and price movements, does not predict future performance. Market conditions, company-specific factors, and broader economic events can change, impacting how a stock behaves after earnings. Use historical analysis as a guide, but always consider current market dynamics and risks when making trading decisions.
6. Common Strategies for Earnings Day Trades
Once you've identified a stock with a history of significant IV crush and analyzed its price behavior on the earnings day, you might choose a strategy to potentially capitalize on these dynamics. The strategy you select can depend on whether you expect the stock to move minimally (favoring short Vega strategies) or significantly beyond the expected move (potentially favoring long Vega strategies). Below are some common strategies for earnings day trades, categorized into short Vega and long Vega approaches.
Short Vega Strategies (Capitalizing on IV Crush with Limited Price Movement)
If you expect the stock's actual move on the earnings day to be smaller than or in line with the expected move, and the IV crush to be significant, you might consider these short Vega strategies to benefit from the IV drop:
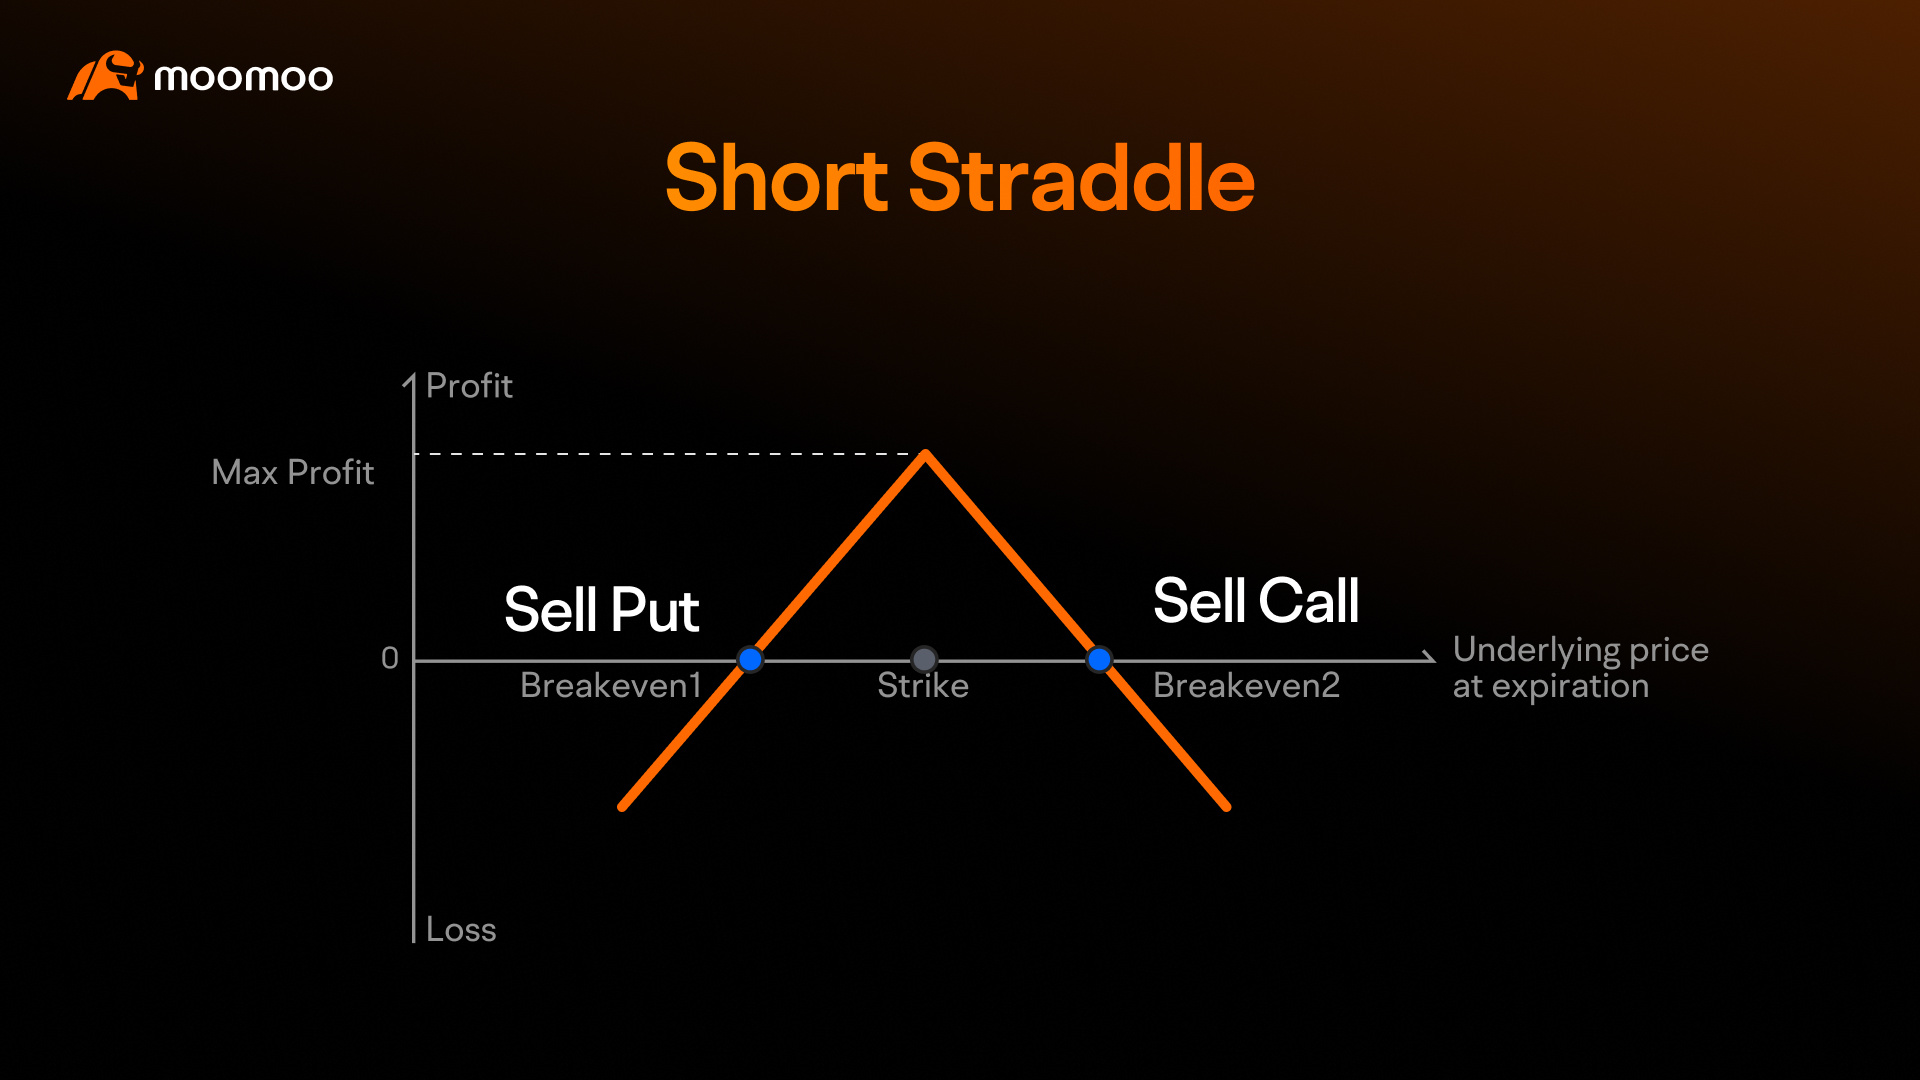
Short Straddle:
Setup: Selling an at-the-money (ATM) call and an ATM put at the same strike.
Pros: Benefits from a sharp IV drop and minimal price movement, as both options lose value.
Cons: Unlimited risk if the stock moves significantly in either direction; requires careful position sizing.
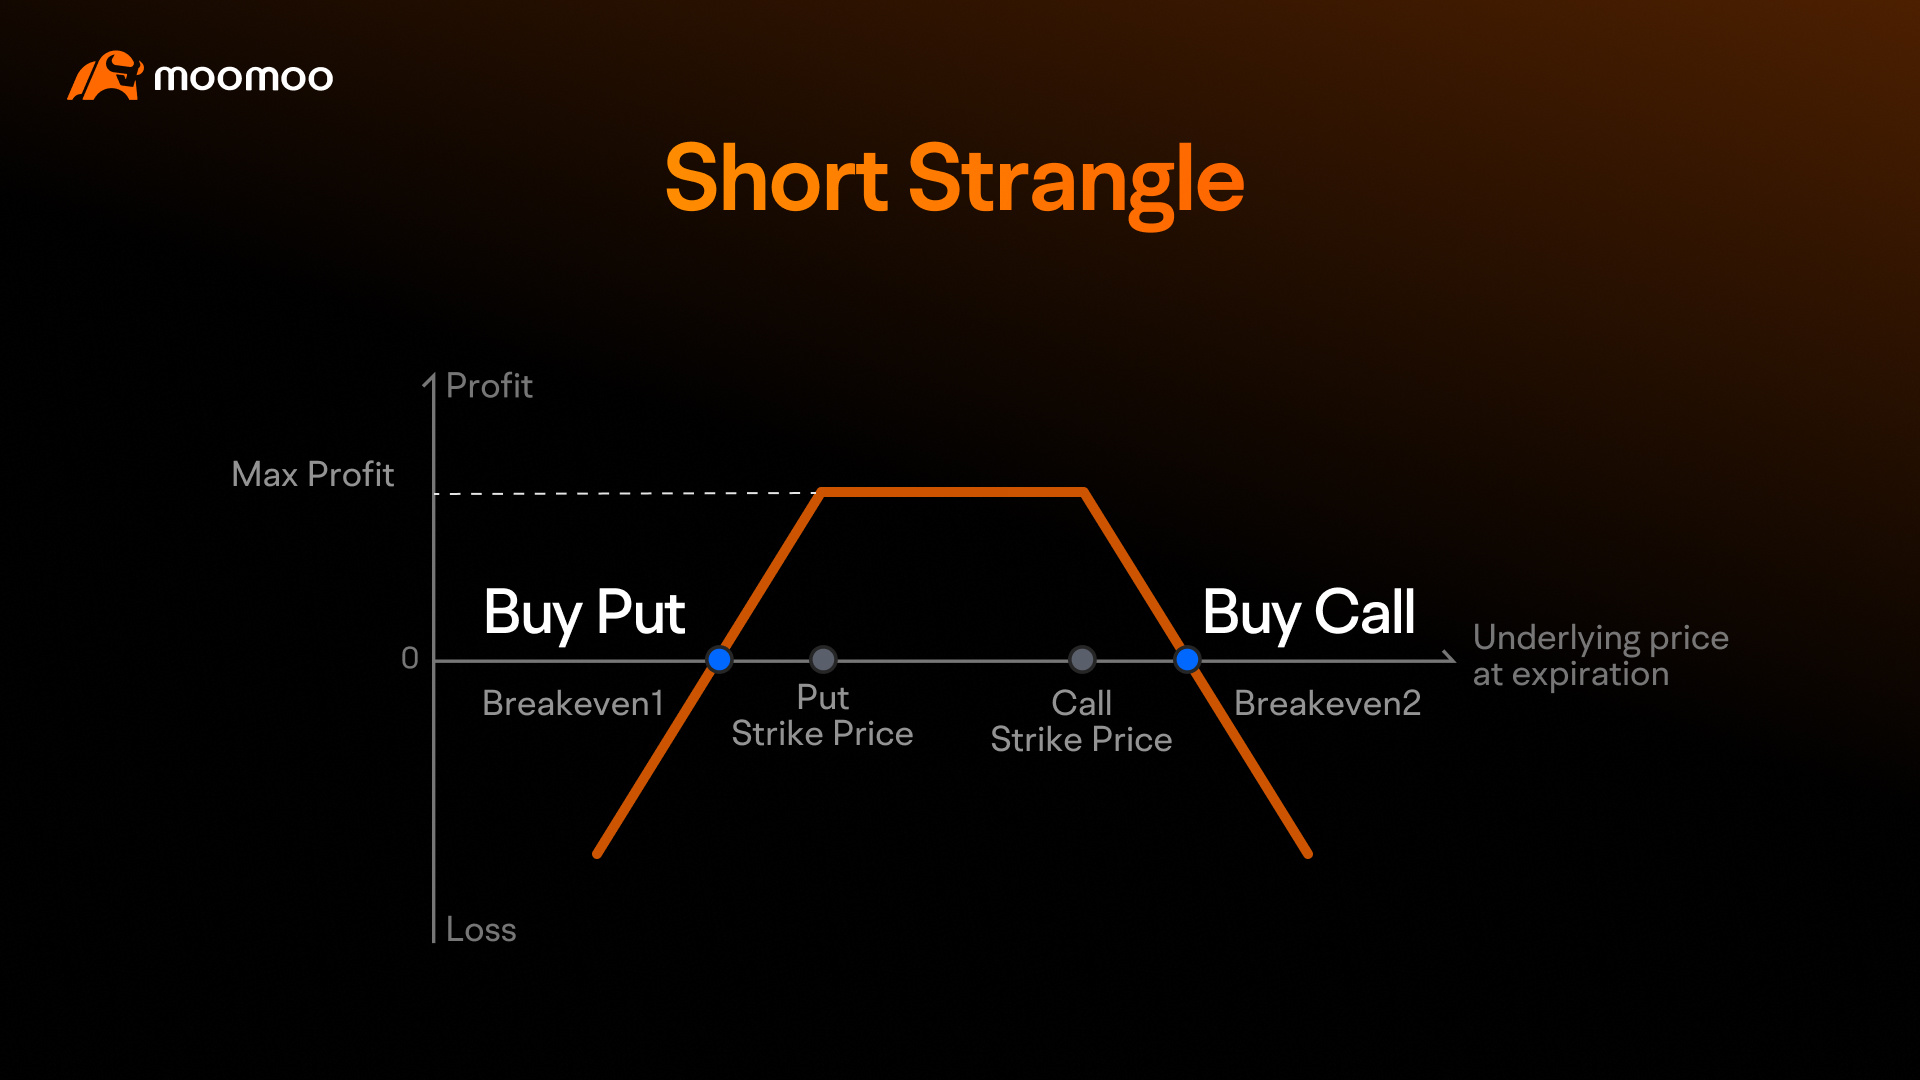
Short Strangle:
Setup: Selling an out-of-the-money (OTM) call and an OTM put at different strikes.
Pros: Lower risk than a short straddle due to OTM strikes; benefits from IV crush and limited price movement.
Cons: Still carries significant risk if the stock moves beyond the strikes; requires a larger move to incur losses compared to a straddle.
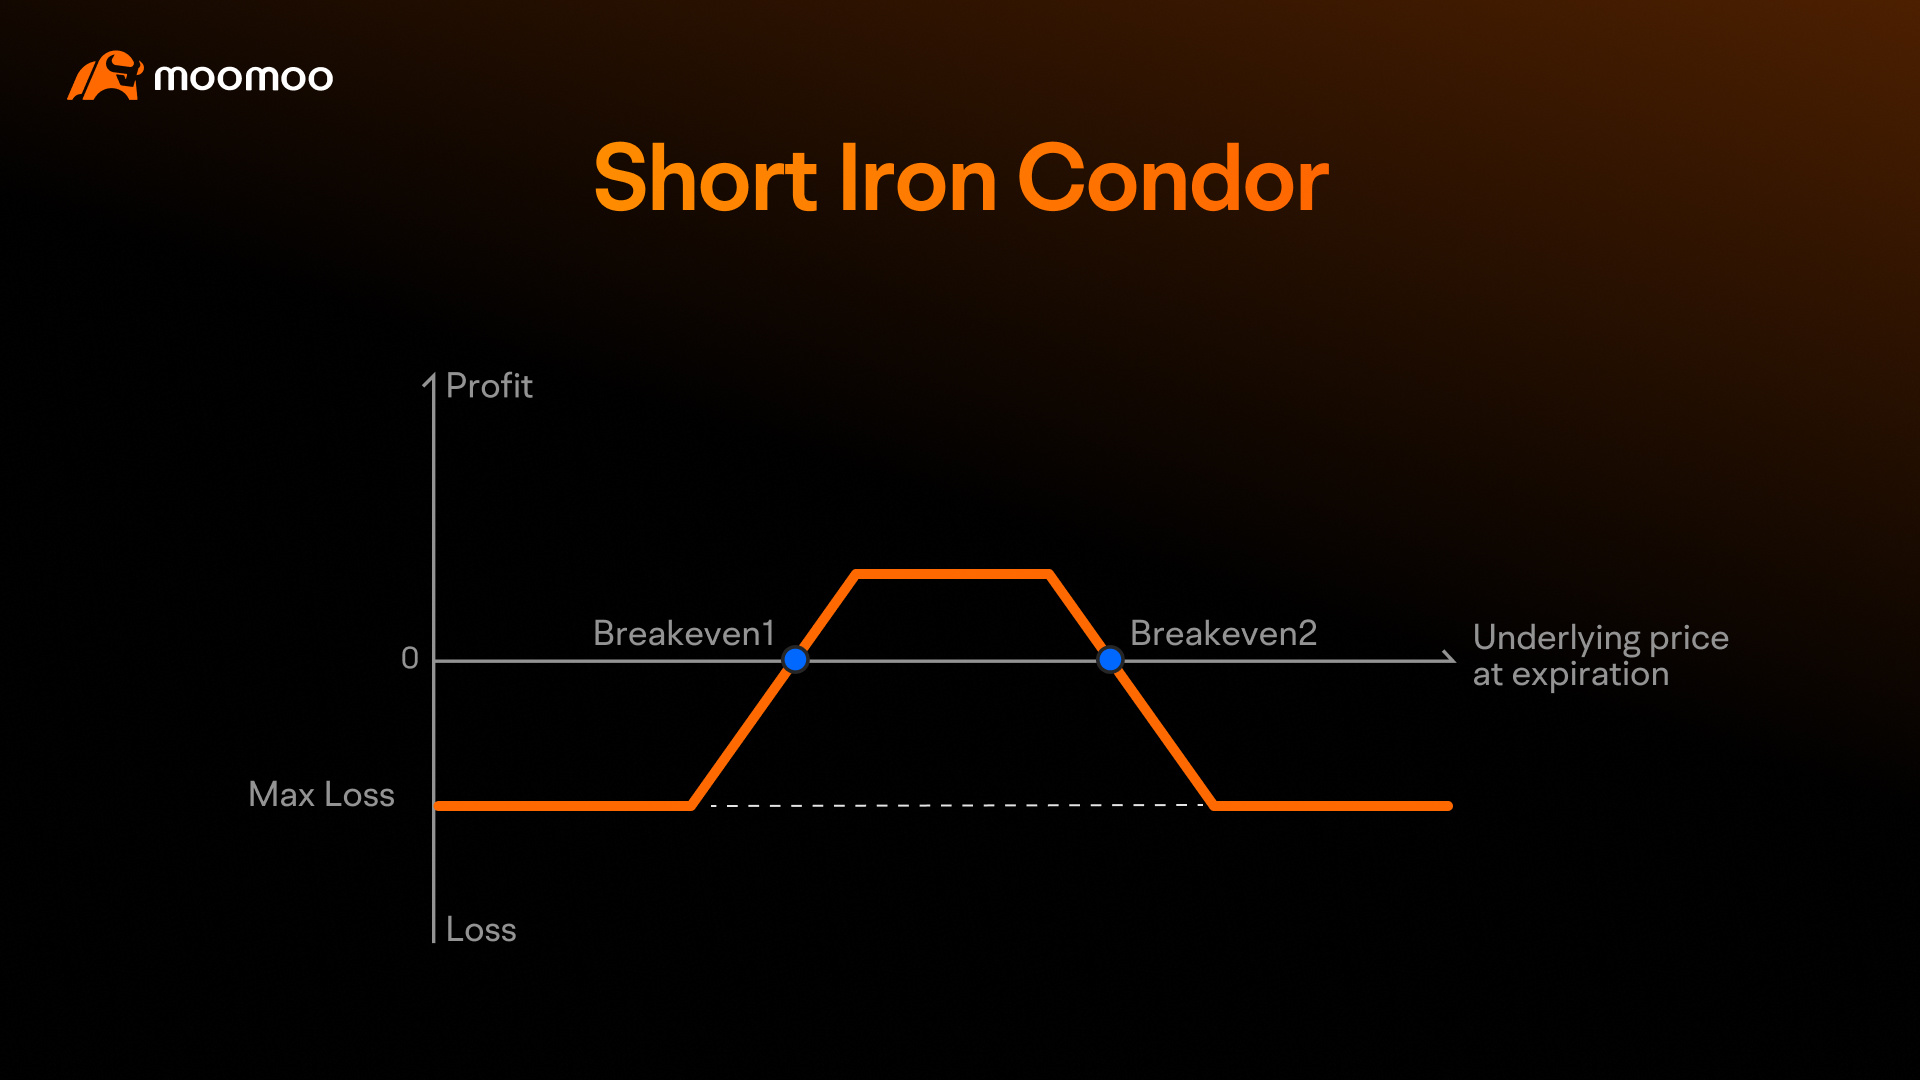
Short Iron Condor:
Setup: Selling an OTM call spread and an OTM put spread, creating a defined-risk position.
Pros: Limited risk and reward; benefits from IV crush and the stock staying within a range between the short strikes.
Cons: Lower profit potential compared to straddles or strangles; requires the stock to stay within a specific range to maximize profit.
Long Vega Strategies (When Actual Moves Exceed Expected Moves)
If your analysis, using tools like the "Expected vs. Actual Move" chart and Historical Earnings Data table, suggests a pattern where the stock’s actual price move on the earnings day has often exceeded the expected move in past earnings periods, and you believe this trend might continue for the upcoming earnings, you might consider long Vega strategies. Even though an IV crush will likely occur after the earnings release, these strategies can potentially profit from large price swings, as a significant price move may offset the negative impact of the IV crush on option premiums, though careful consideration is required:
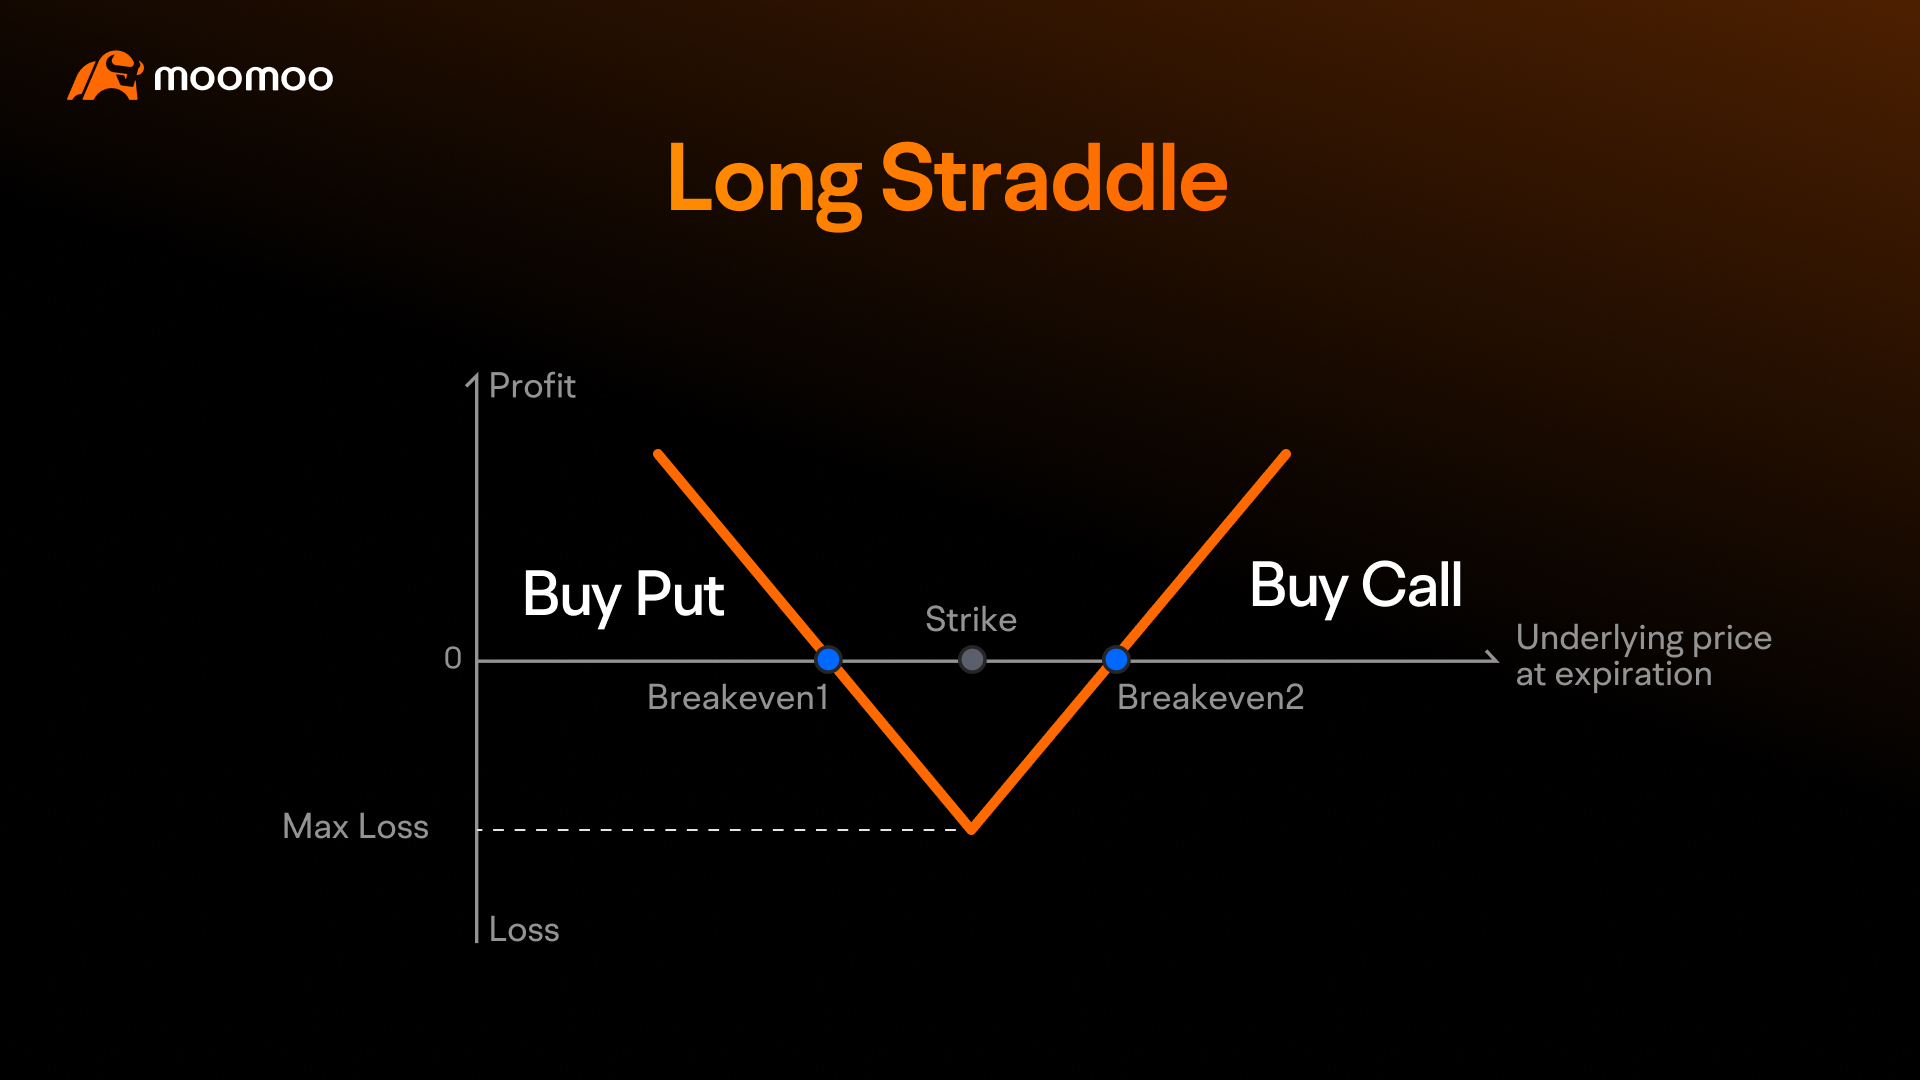
Long Straddle:
Setup: Buying an at-the-money (ATM) call and an ATM put at the same strike.
Pros: Benefits from a large price move in either direction, which can offset the IV crush if the move is significant enough (e.g., well beyond the expected move).
Cons: Expensive due to buying two ATM options; the IV crush reduces premiums, requiring a very large price move to achieve profitability.
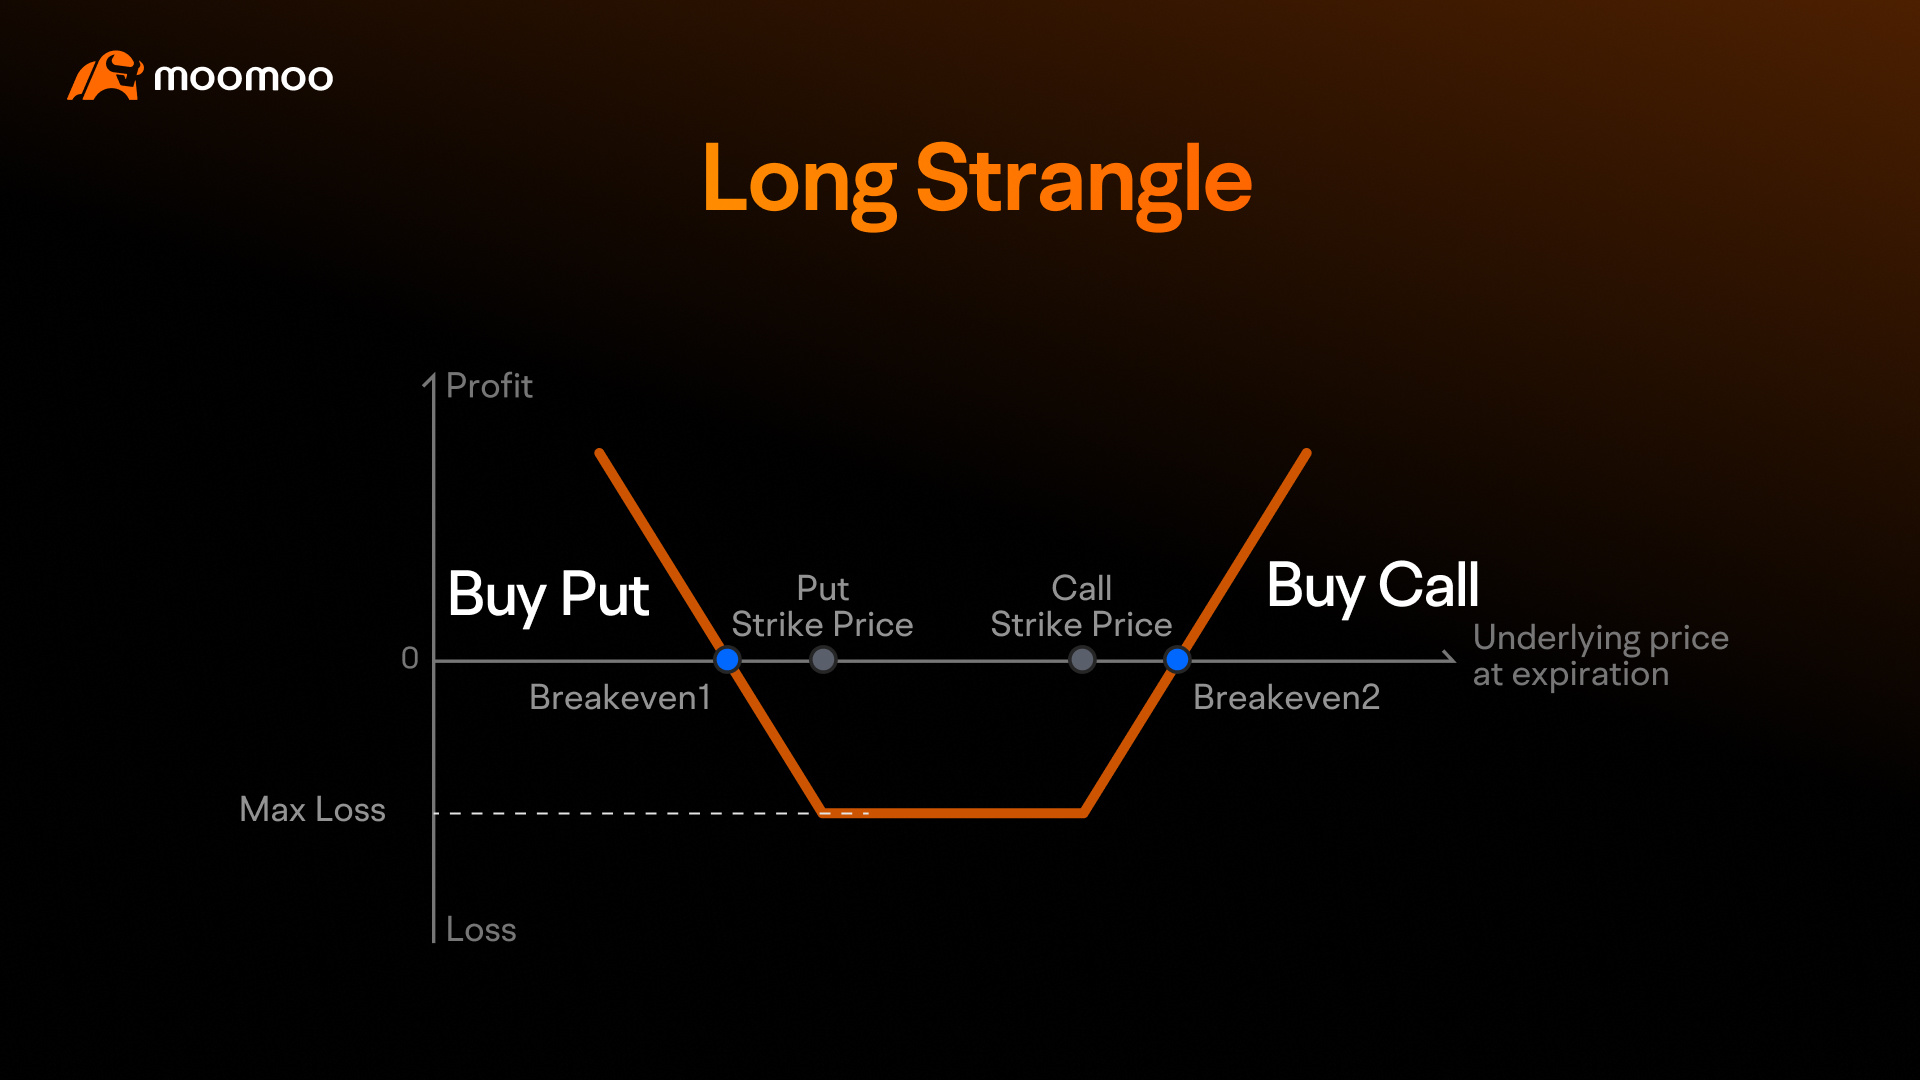
Long Strangle:
Setup: Buying an out-of-the-money (OTM) call and an OTM put at different strikes.
Pros: Cheaper than a straddle due to OTM options, reducing your initial cost; benefits from a large price move.
Cons: Needs an even larger price move than a straddle to become profitable; highly sensitive to IV crush, which can significantly reduce premiums.
Key Consideration: While an IV crush will reduce option premiums, a sufficiently large price move can still make these strategies profitable. For example, if the stock moves significantly beyond the expected move, the intrinsic value gained by the ITM option (call or put) may outweigh the loss from the IV crush, especially if the IV drop is moderate. Use the historical "Abs Average" and "IV Crush" data to assess whether the expected price move is large enough to offset the IV decline. To mitigate the IV crush impact, consider a long strangle with OTM strikes just beyond the expected move, potentially balancing cost and profit potential.
Important Note: While these strategies can be used for earnings day trades, there is no guarantee they will be profitable, as market conditions can be unpredictable, and various risks, such as unexpected price movements, sustained high IV, or smaller-than-expected moves, may impact outcomes.
7. Using moomoo's Strategy Builder to Customize Your Approach
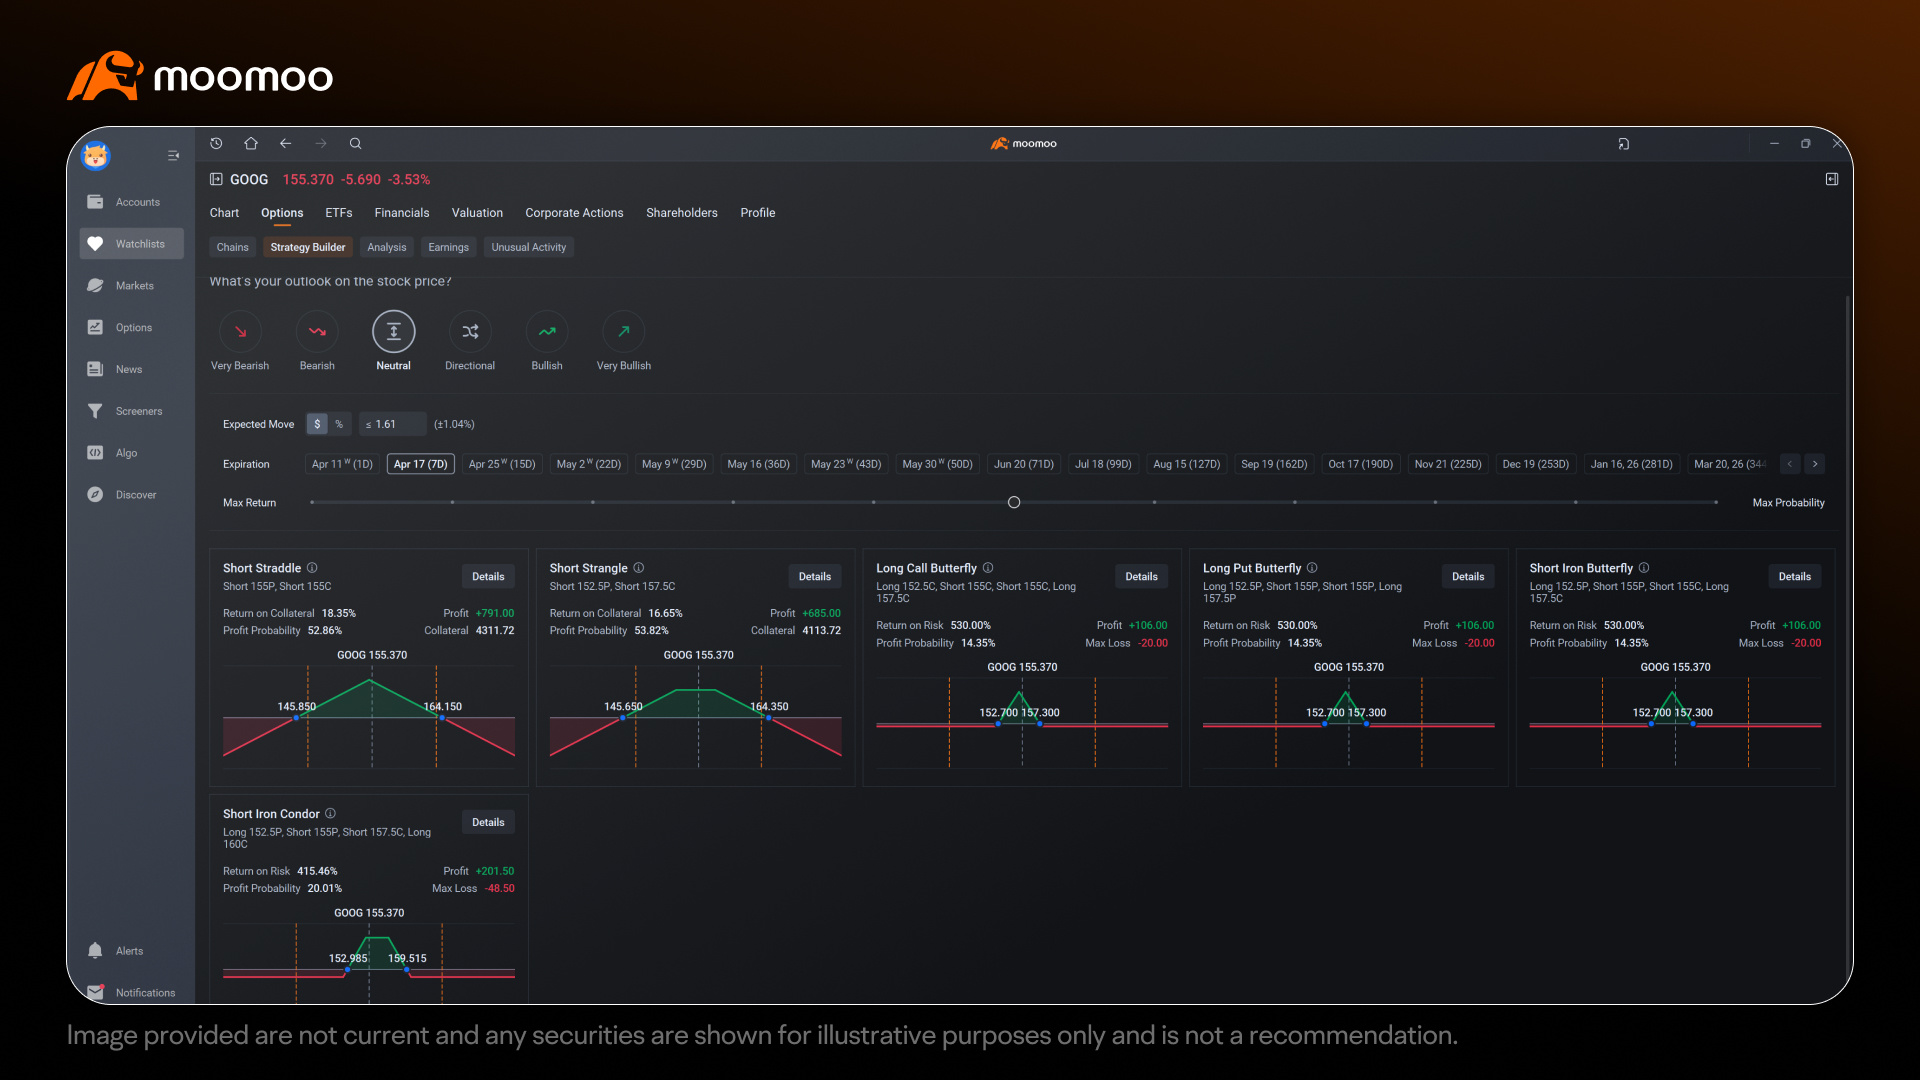
If you have a specific outlook on the stock's behavior on the earnings day or a strategy in mind, moomoo's Strategy Builder can help you refine your approach. The Strategy Builder provides option strategies based on your outlook for the stock price, making it easier to find a setup that matches your expectations for the earnings day. Here's how you might use it:
How the Strategy Builder Works
Select Your Outlook: The Strategy Builder allows you to input your outlook on the stock price, such as "Very Bearish," "Bearish," "Neutral," "Bullish," or "Very Bullish." For IV crush strategies, you might focus on a "Neutral" outlook if you expect the stock to move minimally on the earnings day, or a "Directional" outlook if you anticipate a large move in either direction (e.g., for long straddles).
View Available Strategies: To explore strategies that align with your outlook, you can select options like "Neutral," "Bearish," "Very Bearish," "Bullish," "Very Bullish," or "Directional" in the Strategy Builder. For example, a "Neutral" outlook will include short Vega strategies like Iron Condor or Short Butterfly, which benefit from IV crush and limited price movement. If you expect a large move in either direction (classified as "Directional"), strategies like Long Strangle or Long Straddle might be available, depending on your analysis of actual vs. expected moves. Many other option strategies are also provided for reference within each outlook.
Fill in Criteria: Depending on your outlook, you can input specific criteria to filter the option strategies, such as the expected move, target price, budget, and expiration date. The criteria you fill in may vary based on the outlook, allowing the Strategy Builder to tailor the strategy suggestions accordingly. You can also adjust the balance between "Max Return" and "Max Probability" using a slider to prioritize your preference.
Analyze Risk and Reward: For each strategy, the Strategy Builder provides key metrics such as the cost, maximum profit, maximum loss, and probability of profit. This can help you evaluate whether the strategy aligns with your risk tolerance.
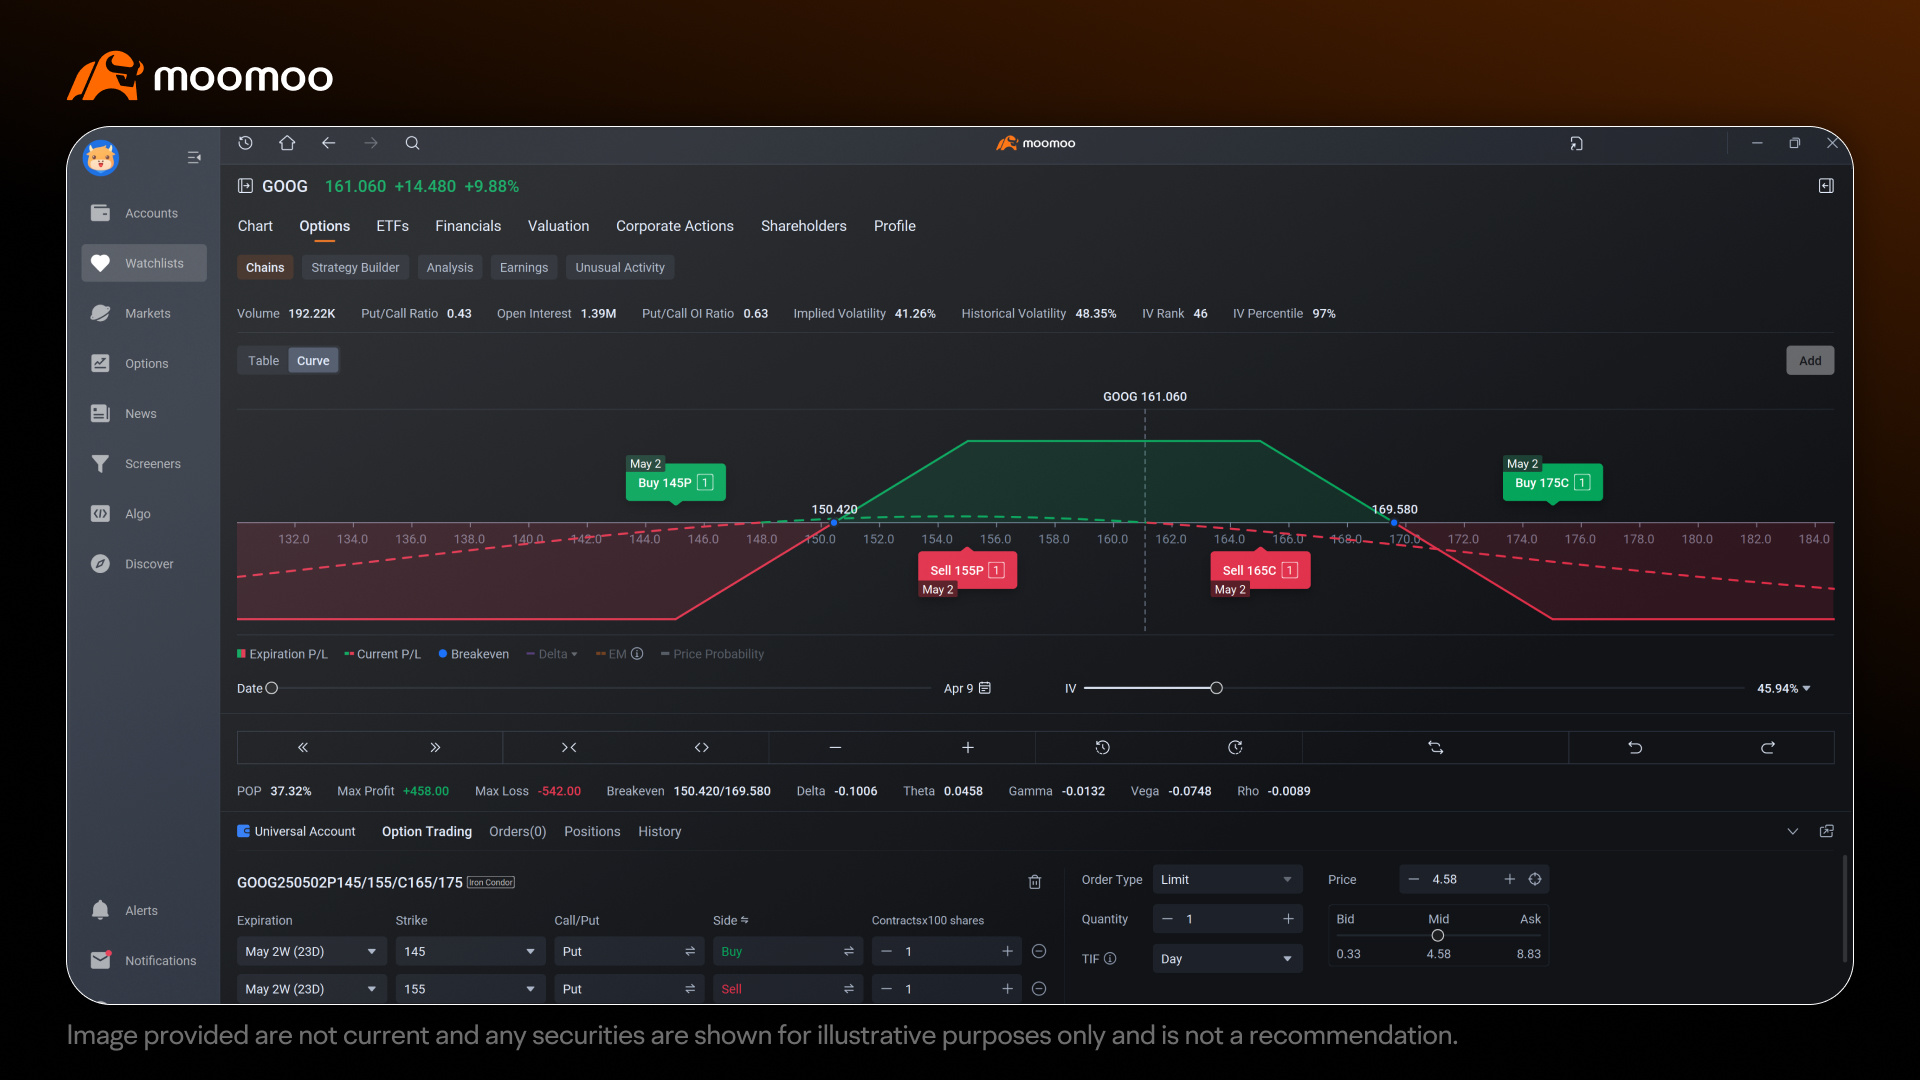
Visualize, Simulate, and Finalize the Trade: After selecting a strategy, you can click "Trade" to access the options curve interface. This allows you to further adjust the strike prices and expiration dates, visualize the payoff diagram, and review key metrics like probability of profit, maximum profit, maximum loss, and breakeven points. You might then simulate your setup in moomoo's demo environment using the options curve interface to see how it performs under different scenarios—for example, adjusting the date to the earnings day to see how the P/L graph looks after the earnings release, or modifying the implied volatility to observe the impact of the IV crush on the P/L graph—helping you to ensure that you're comfortable with the trade before placing it live.
Example Use Case
If you expect the stock to move minimally on the earnings day due to a significant IV crush, you might select a "Neutral" outlook in the Strategy Builder. Next, you can input criteria such as the expected move, target price, budget, and expiration date, adjusting the Max Return/Max Probability slider to suit your preference. The Strategy Builder will then display strategies such as Iron Condor or Short Iron Butterfly, among other options, along with their key metrics. You might choose an option strategy, such as an Iron Condor, which involves selling an OTM call spread and an OTM put spread. After selecting the option strategy, you can click "Trade" to access the options curve interface, where you can further adjust the strikes and expiration, visualize the payoff diagram, and review metrics. You might then simulate the setup in moomoo's demo environment to ensure you're comfortable with the trade before placing it live.
8. Managing Risks in Earnings Day Trades
The Challenge: Unexpected Price Swings and Sustained IV
While IV crush can benefit short Vega strategies, earnings day trades come with risks. The stock might experience unexpected price swings on the earnings day due to market reactions to the earnings report, such as surprises in the results or guidance, which can move the price against your position. Additionally, IV might not drop as much as expected if new uncertainties arise, such as forward-looking guidance or macroeconomic events, potentially reducing the profitability of short Vega positions. For long Vega strategies, the IV crush can significantly reduce option premiums, requiring a very large price move to achieve profitability.
Common Strategies Used to Manage Earnings Day Risks
Monitoring Price Movements Closely: On the earnings day, keep a close eye on the stock’s price action after the earnings release. If the stock starts to move significantly against your position, you might consider closing the trade early to limit losses, even if IV has dropped as expected (for short Vega) or the price move hasn't fully played out (for long Vega).
Using Defined-Risk Strategies: Strategies like iron condors or short iron butterflies (for short Vega) or debit spreads (for long Vega) can limit your risk by defining the maximum loss upfront, offering more protection compared to naked short straddles/strangles or long straddles/strangles.
Scaling In Gradually: For short Vega strategies, you might scale into your position 1-2 days before earnings to confirm that IV remains high, reducing the risk of entering too early. For long Vega strategies, you might scale in if the stock starts to show a larger-than-expected move on the earnings day, though this carries the risk of IV crush already having occurred.
9. Conclusion
The IV crush on the earnings day can present opportunities to explore short Vega strategies, potentially allowing traders to benefit from declining option premiums, while larger-than-expected price moves might favor long Vega strategies. By leveraging moomoo's Earnings tools to analyze historical IV crush and price movement data, exploring various strategies, and testing setups in a demo environment, traders can better position themselves to navigate the earnings day. However, it’s critical to recognize that historical data, such as past actual moves compared to expected moves, does not predict future performance, as market conditions can change unpredictably. Additionally, the common strategies mentioned in this article, like short straddles, iron condors, or long straddles, are not guaranteed to be the best choice or to produce profitable results, as their success depends on various factors, including market behavior and individual risk tolerance. Traders should remain mindful of risks—such as unexpected price swings, sustained IV, or smaller-than-expected moves—and prioritize thorough preparation and risk management to approach earnings day trades with a more informed and cautious strategy.
Disclaimer
Options trading entails significant risk and is not appropriate for all customers. It is important that investors read Characteristics and Risks of Standardized Options before engaging in any options trading strategies. Opening new options positions close to or on their expiration date comes with substantial risk of losses for reasons that include potential volatility of the underlying security and limited time to expiration. Options transactions are often complex and may involve the potential of losing the entire investment in a relatively short period of time. Certain complex options strategies carry additional risk, including the potential for losses that may exceed the original investment amount. Supporting documentation for any claims, if applicable, will be furnished upon request. Options trading subject to eligibility requirements. Strategies available will depend on options level approved.
The P/L Analysis is for informational purposes only and should not be considered a personalized recommendation or investment advice. The P/L Analysis performs hypothetical calculations based on model assumptions and other inputs you select, which may not reflect actual market conditions and do not guarantee future results. Although hedging strategies seek to limit or reduce investment risk, they may also limit or reduce the profit potential. There is no assurance that hedging strategies will be successful.
IMPORTANT: The projections or other information generated by the Trend Projection tool regarding the likelihood of various investment outcomes are hypothetical in nature, do not reflect actual investment results and are not guarantees of future results.
Options volatility rankings: Keep in mind that implied volatility values, IV Rankings, and IV Percentiles are theoretical estimates, and the actual market conditions may not always align with the theoretical information shown. Therefore, traders should exercise caution and use multiple sources of information when making investment decisions. There is no guarantee or assurance that the use of any tools or data provided on the moomoo app will result in investment success or reduce investment risk.
This presentation is for informational and educational use only and is not a recommendation or endorsement of any particular investment or investment strategy. Investment information provided in this content is general in nature, strictly for illustrative purposes, and may not be appropriate for all investors. It is provided without respect to individual investors’ financial sophistication, financial situation, investment objectives, investing time horizon, or risk tolerance. You should consider the appropriateness of this information having regard to your relevant personal circumstances before making any investment decisions. Past investment performance does not indicate or guarantee future success. Returns will vary, and all investments carry risks, including loss of principal. moomoo makes no representation or warranty as to its adequacy, completeness, accuracy or timeliness for any particular purpose of the above content.
Moomoo is a financial information and trading app offered by Moomoo Technologies Inc. Securities offered through moomoo Financial Inc, Member FINRA/SIPC.
In Singapore, investment products and services available through the moomoo app are offered through Moomoo Financial Singapore Pte. Ltd. regulated by the Monetary Authority of Singapore (MAS). Moomoo Financial Singapore Pte. Ltd. is a Capital Markets Services Licence (License No. CMS101000) holder with the Exempt Financial Adviser Status. This advertisement has not been reviewed by the Monetary Authority of Singapore.
In Australia, financial products and services available through the moomoo app are provided by Moomoo Securities Australia Limited, an Australian Financial Services Licensee (AFSL No. 224663) regulated by the Australian Securities and Investment Commission (ASIC). Please read and understand our Financial Services Guide, Terms and Conditions, Privacy Policy, Options PDS, Target Market Determination and other disclosure documents which are available on our website https://www.moomoo.com/au.
In Canada, order-execution only services available through the moomoo app are provided by Moomoo Financial Canada Inc., regulated by the Canadian Investment Regulatory Organization (CIRO).
In Malaysia, investment products and services available through the moomoo app are offered through Moomoo Securities Malaysia Sdn. Bhd.("Moomoo MY") regulated by the Securities Commission of Malaysia (SC). Moomoo Securities Malaysia Sdn. Bhd.is a Capital Markets Services Licence (License No. eCMSL/A0397/2024) holder. This advertisement has not been reviewed by the SC.
Moomoo Technologies Inc., Moomoo Financial Inc., Moomoo Financial Singapore Pte. Ltd., Moomoo Securities Australia Limited.
This presentation is for informational and educational use only and is not a recommendation or endorsement of any particular investment or investment strategy. Investment information provided in this content is general in nature, strictly for illustrative purposes, and may not be appropriate for all investors. Read more