Why Pre-Earnings Volatility Attracts Option Traders

Earnings season presents traders with unique opportunities to potentially profit from increased implied volatility (IV) in the options market. A key concept to understand is Vega, which measures an option’s sensitivity to changes in IV. By employing long Vega strategies, traders can seek to take advantage of the IV expansion that typically occurs before earnings announcements, boosting option premiums and creating profit potential.
This article will break down the following:
Why IV Rises Before Earnings
Identifying Potential Opportunities Using moomoo’s Earnings Tools
Common Long Vega Strategies for Pre-Earnings Trades
Using moomoo’s Strategy Builder to Customize Your Approach
Managing the Post-Earnings IV Crush
1. Why IV Rises Before Earnings
In the days leading up to earnings, the options market often sees a surge in implied volatility (IV) as traders anticipate significant price movements. This uncertainty stems from the potential for unexpected earnings results, new guidance, or strong market reactions, increases the perceived risk of large price swings, driving up demand for options and causing IV to rise, which in turn leads to higher option premiums—a dynamic that can benefits traders using long Vega strategies.
Here’s why IV typically rises before earnings:
Heightened Uncertainty: The market cannot predict whether earnings will be a positive or negative catalyst, increasing the perceived risk of a big price move.
Hedging Demand: Some investors buy options try to protect their positions against potential volatility, driving up demand.
Speculative Trading: Many traders take option positions seeking to to capitalize on expected price swings, further increasing demand.
By understanding this pre-earnings IV expansion, traders can position themselves to potentially profit from rising option premiums while planning to avoid the post-earnings IV crush.
2. Identifying Possible Opportunities Using moomoo’s Earnings Tools
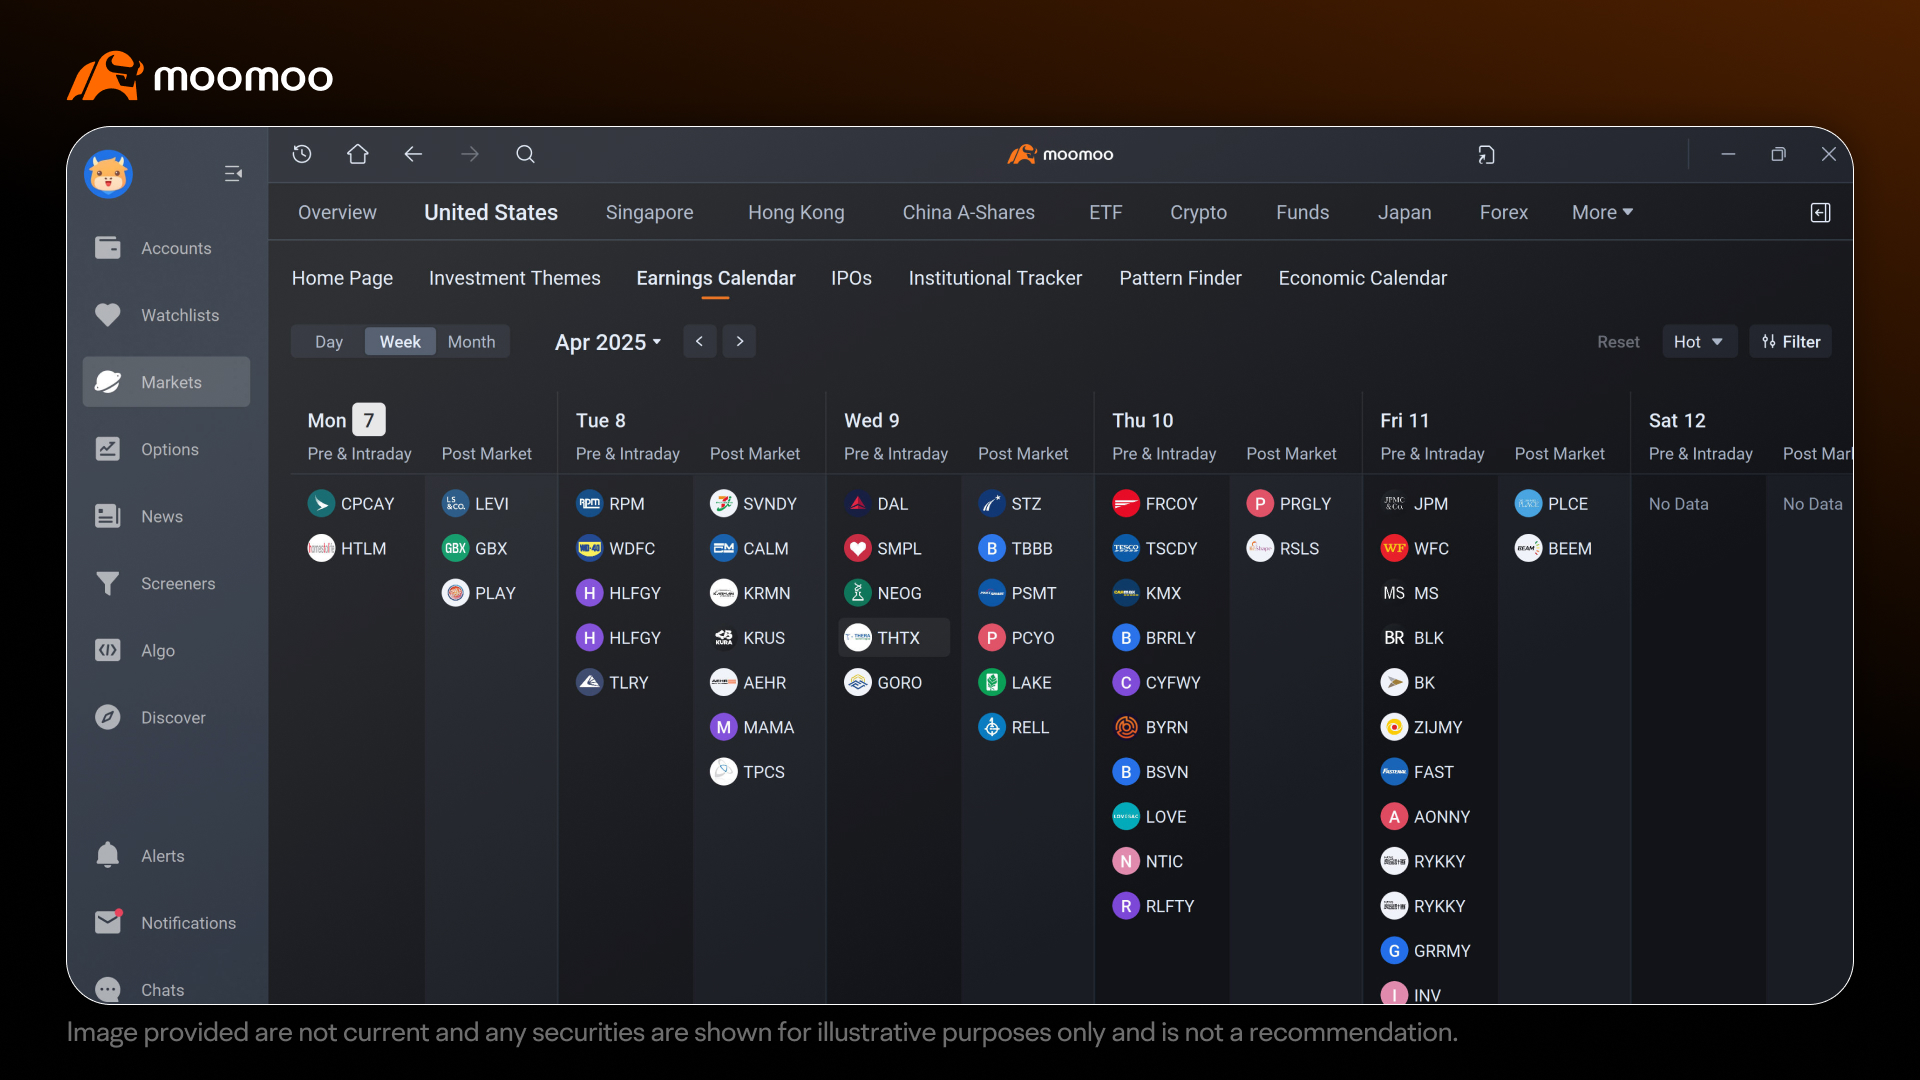
If they are hoping to capitalize on earnings, most traders typically start by identifying which companies are reporting earnings and when, so they can plan their trades ahead of time. To do so, you might navigate to moomoo’s Earnings Calendar, which lists upcoming earnings announcements by date. This tool allows you to see which companies are scheduled to report each day, helping you select stocks to focus on for your pre-earnings trading strategy.
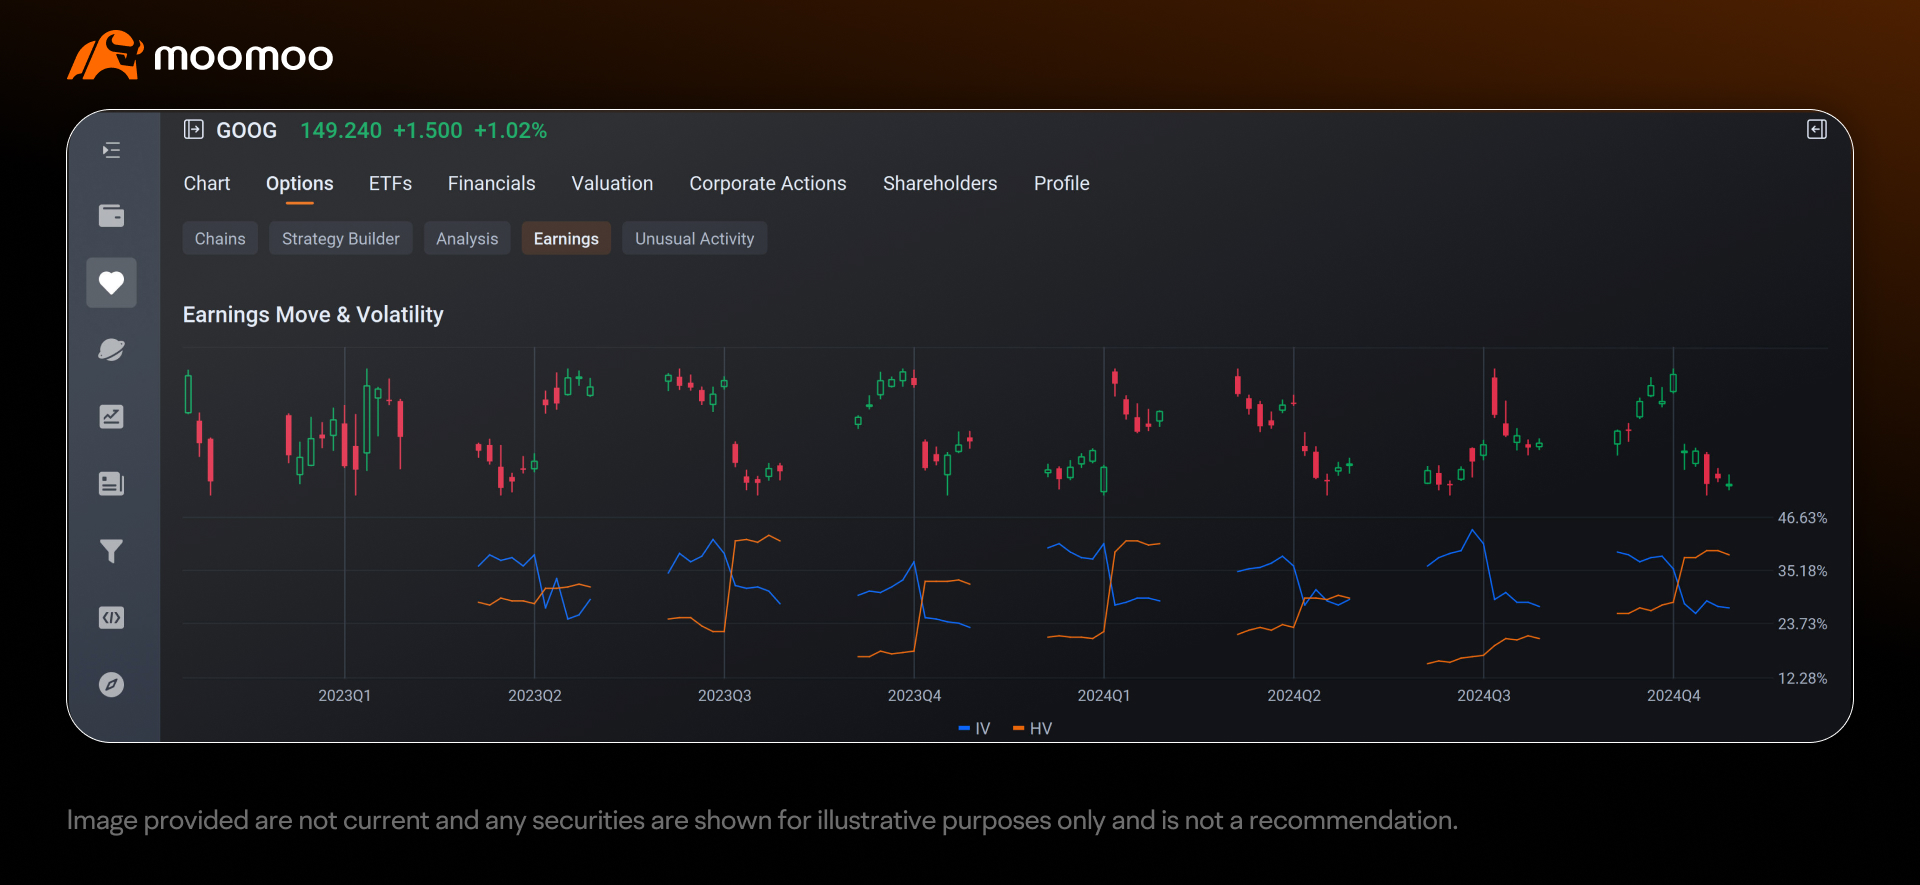
So, how might you develop strategies based on this pre-earnings IV expansion? The key is to identify stocks that you believe have a high probability of IV expansion and significant price movements before earnings, which can enhance the profitability of long Vega strategies. moomoo’s earnings tools offer a range of features to analyze earnings-related data, but for pre-earnings trades, we’ll focus on a few key components that can help you find potential opportunities. Here’s a streamlined guide to using these specific tools for pre-earnings long Vega strategies:
3. Identifying Stocks with Historically Rising IV Before Earnings
Focus on IV Expansion Patterns: Consider stocks with a consistent history of IV increases before earnings, as these increases can drive the profitability of long Vega strategies. Rising IV typically inflates option premiums, which usually benefits option holders.
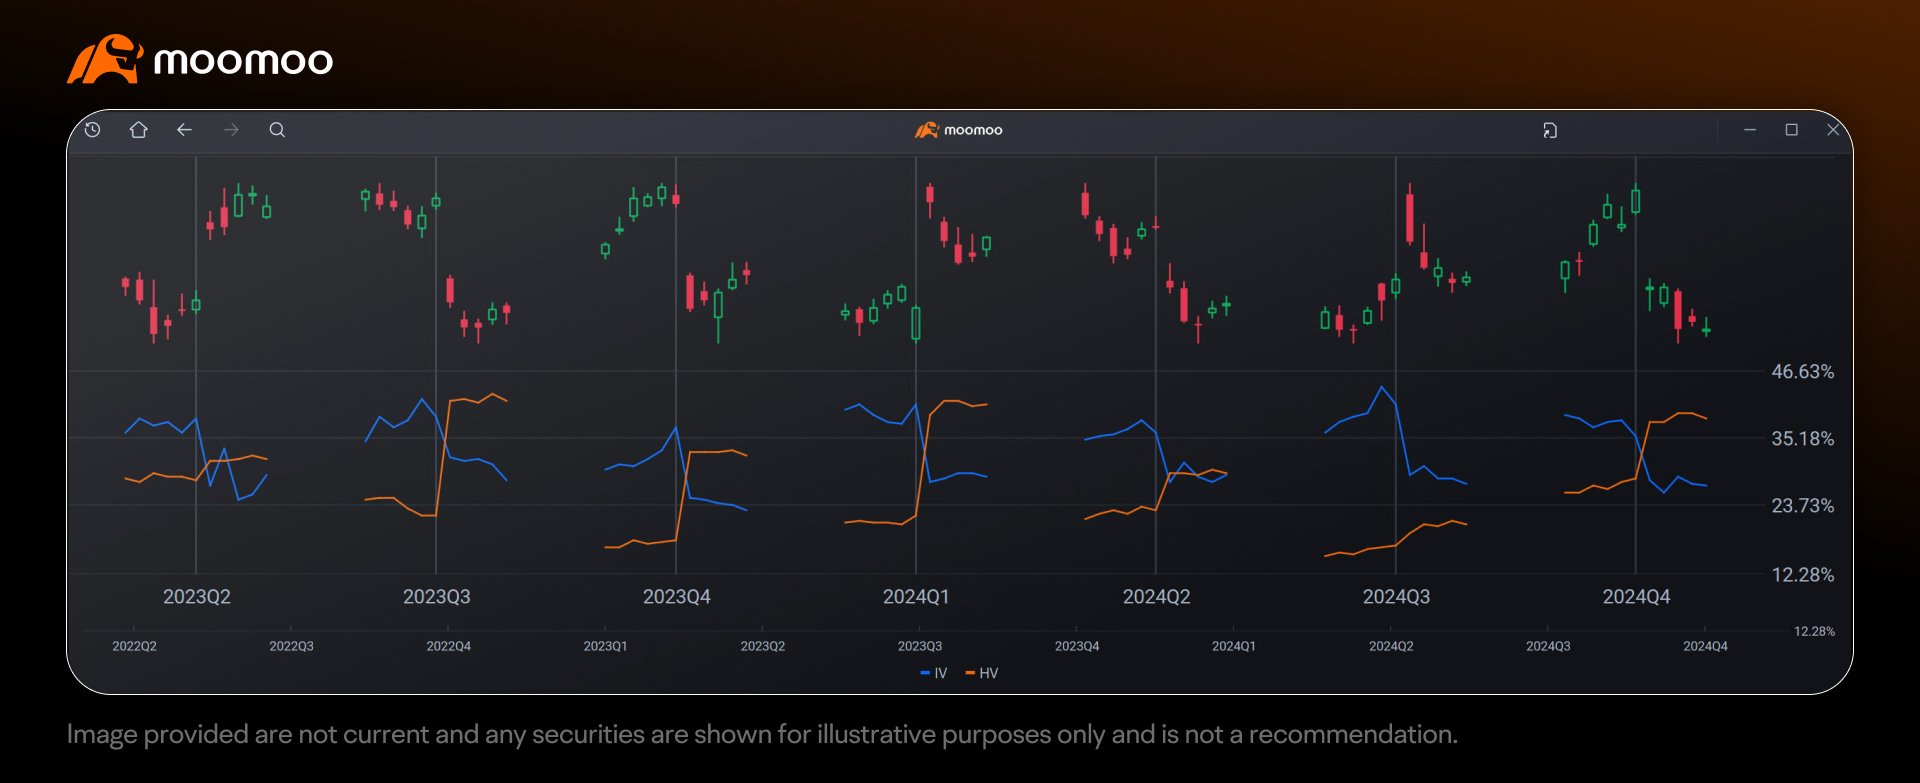
Using the Earnings Move & Volatility Chart: moomoo’s platform includes a chart that displays historical price action and IV trends over multiple earnings cycles. The chart shows IV behavior for up to 5 days leading up to earnings, allowing you to observe whether IV has typically increased during this period.
Insight: You might look for stocks where the IV line has consistently risen in the 5 days before earnings across several quarters. If this upward trend is consistent, meaning IV increases in most or all of the past earnings periods, it could indicate a higher probability of IV expansion in the upcoming earnings period, making the stock a potential candidate for a long Vega trade. While historical data doesn’t predict future results, a consistent pattern can provide a useful indication of potential behavior, increasing your confidence in the trade setup.
What If the IV Trend Is Inconsistent?: If the IV line doesn’t consistently rise—say, it only goes up in some quarters but stays flat or drops in others (a 50/50 pattern)—the stock might not be a reliable choice for a long Vega strategy.
Here’s why:Inconsistent IV Expansion Reduces Profit Potential: Long Vega strategies rely on rising IV to increase option premiums. If IV doesn’t rise as expected, your options may not gain value, even if the stock price moves. For example, if you buy an option position expecting IV to rise, but IV stays flat, the premiums might not increase, potentially leading to a loss if the price move isn’t large enough to offset the cost.
Higher Risk of Misjudging the Trade: A 50/50 IV pattern indicates unpredictability in market expectations. The market might not be pricing in enough uncertainty for that stock’s earnings, meaning there’s less demand for options and thus less IV expansion. This can make it harder to predict whether your long Vega trade will be profitable, increasing the risk of the trade.
Historical Context Still Matters: While historical data doesn’t guarantee future results, a lack of consistency in IV expansion suggests the stock may not follow the typical pre-earnings volatility pattern. For long Vega strategies, you might prefer stocks where the market more consistently anticipates uncertainty, driving IV higher. If the stock’s IV behavior is erratic, you might consider looking for a different candidate with a more consistent IV expansion history to improve your odds of success.
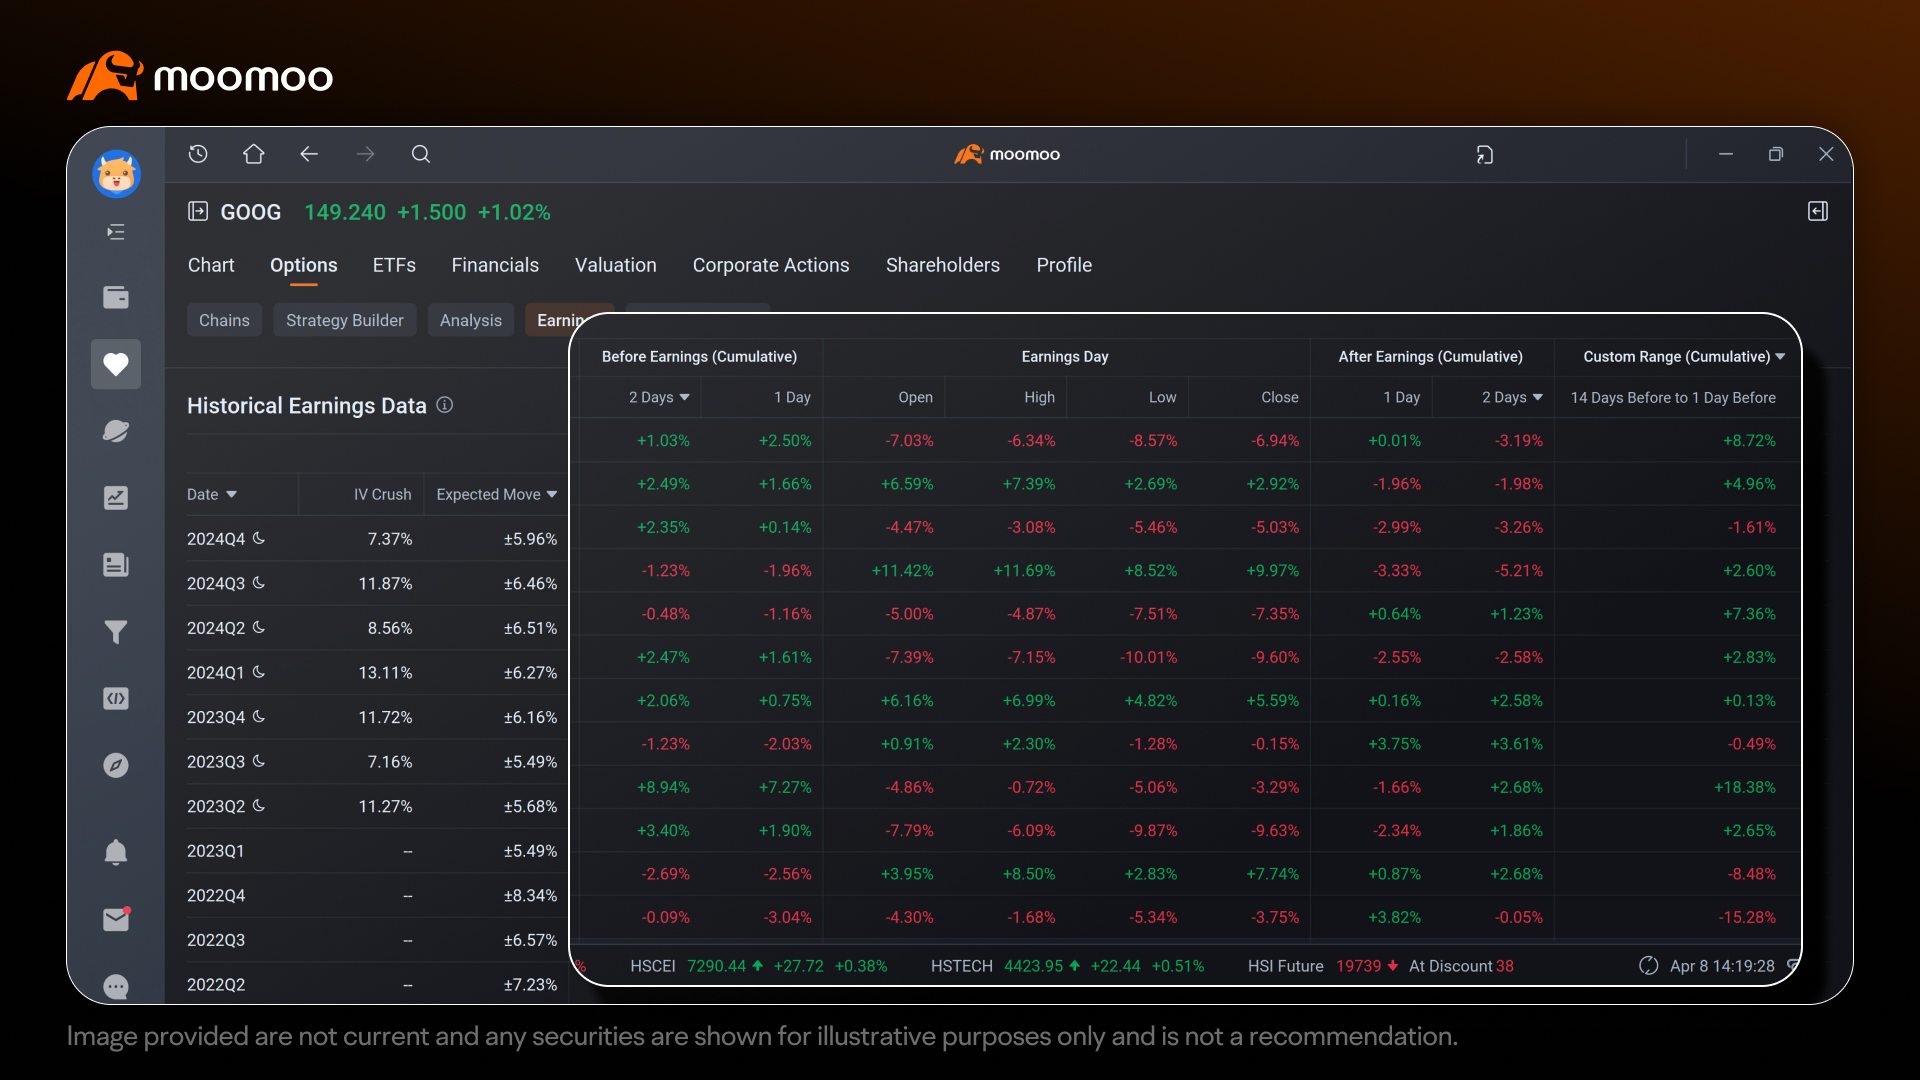
4. Assessing Historical Price Movements to Confirm Significant Pre-Earnings Moves
Analyzing Actual Price Changes Before Earnings: moomoo’s Historical Earnings Data table provides a detailed breakdown of price movements across multiple earnings periods. The table includes columns such as "Before Earnings (Cumulative)," which shows the actual price change in the days leading up to earnings. You can adjust this column to different timeframes (e.g., 1 day to 14 days before earnings) using the dropdown menu, allowing you to analyze price movements over your preferred period. Additionally, the "Custom Range (Cumulative)" column lets you set a specific timeframe (e.g., 13 days before to 1 day before) for more tailored analysis. Other columns, like "Earnings Day" (Open, High, Low, Close) and "After Earnings (Cumulative)," provide further context, but for pre-earnings trades, you might focus on the "Before Earnings (Cumulative)" and "Custom Range (Cumulative)" columns. Trading pre-earnings is often about looking for patterns of price movement and volatility in the lead-up to earnings, which these columns can help capture by showing how the stock has historically behaved in the days before the announcement. This can help you gauge whether the stock is likely to experience significant price swings that might complement the expected IV expansion, making it a potential candidate for long Vega strategies.
Why It Matters: Significant pre-earnings price movements can benefit long Vega strategies by increasing the likelihood of a profitable move, especially for strategies that generally thrive on large price swings. However, the degree of movement needed can vary depending on the strategy you choose and how it is structured:
Some long Vega strategies, such as those involving buying both a call and a put (e.g., Long straddles or strangles), typically require a large price move to be profitable because they involve purchasing two options, which can be expensive.
Other long Vega strategies, such as those with a more defined risk-reward profile (e.g., long iron condors), can profit from more moderate moves because they’re structured to have a lower cost and limited risk.
Insight: You might use the "Before Earnings (Cumulative)" column to identify stocks with consistent historical price movements in the lead-up to earnings. Adjust the timeframe in the dropdown menu (e.g., 1 to 14 days) to match your planned entry point—for example, if you plan to enter 7 days before earnings, set it to 7 days to see the historical price movement over that period. For more specific analysis, you can use the "Custom Range (Cumulative)" column to set a tailored timeframe (e.g., 13 days before to 1 day before). The "Average" and "Abs Average" rows at the bottom of the table may provide useful information for:
Average: This shows the mean price movement across all periods, indicating the stock’s typical directional bias before earnings. For example, a positive average over 14 days suggests a slight upward tendency, though the direction can vary. For non-directional long Vega strategies, the magnitude of the move often matters more than this average. However, if you have a directional bias, such as expecting a bullish move, you might use this data to adjust your strategy, like choosing strikes that favor an upward move.
Abs Average: This stands for Absolute Average and reflects the average magnitude of the price movement, regardless of direction, by taking the absolute value of each period’s move before averaging. For example, a higher Abs Average over 14 days means the stock typically moves a certain percentage in either direction, which is more relevant for non-directional strategies. For strategies that require larger moves, such as those involving buying both a call and a put (e.g., Long straddles or strangles), you might consider stocks with a larger Abs Average which indicates their previous movements were large enough to offset the cost of a trade set up around them. For strategies that can profit from more moderate moves, such as long iron condor, a more moderate Abs Average might still be appropriate.If the stock has a history of significant pre-earnings moves, as indicated by the Abs Average and individual periods, it might support the use of long Vega strategies. This approach of assessing historical price movements for pre-earnings trades is a common practice, but the Historical Earnings Data table can be used for many other purposes as well, such as analyzing post-earnings price reactions, directional strategies, or volatility trends. This is just one part of how you might leverage the tool to inform your trading decisions.
Important note: Historical data, such as past IV patterns and price movements, does not predict future performance. Market conditions, company-specific factors, and broader economic events can change, impacting how a stock behaves after earnings. Use historical analysis as a guide, but always consider current market dynamics and risks when making trading decisions.
5. Common Long Vega Strategies for Pre-Earnings Trades
Once you’ve identified a stock with a history of rising IV and significant pre-earnings price movements, you might choose a long Vega strategy to potentially capitalize on these dynamics. The strategy you select can depend on whether you have a directional bias (e.g., bullish or bearish) or no bias at all. Below are some common long Vega strategies for pre-earnings trades, categorized into non-directional and directional approaches. Note that there are other strategies available that might also be considered for pre-earnings trades, such as butterflies, iron condor, etc.
Non-Directional Strategies (No Bias)
If you don’t have a directional bias and expect volatility but are unsure of the direction, you might consider these non-directional strategies:
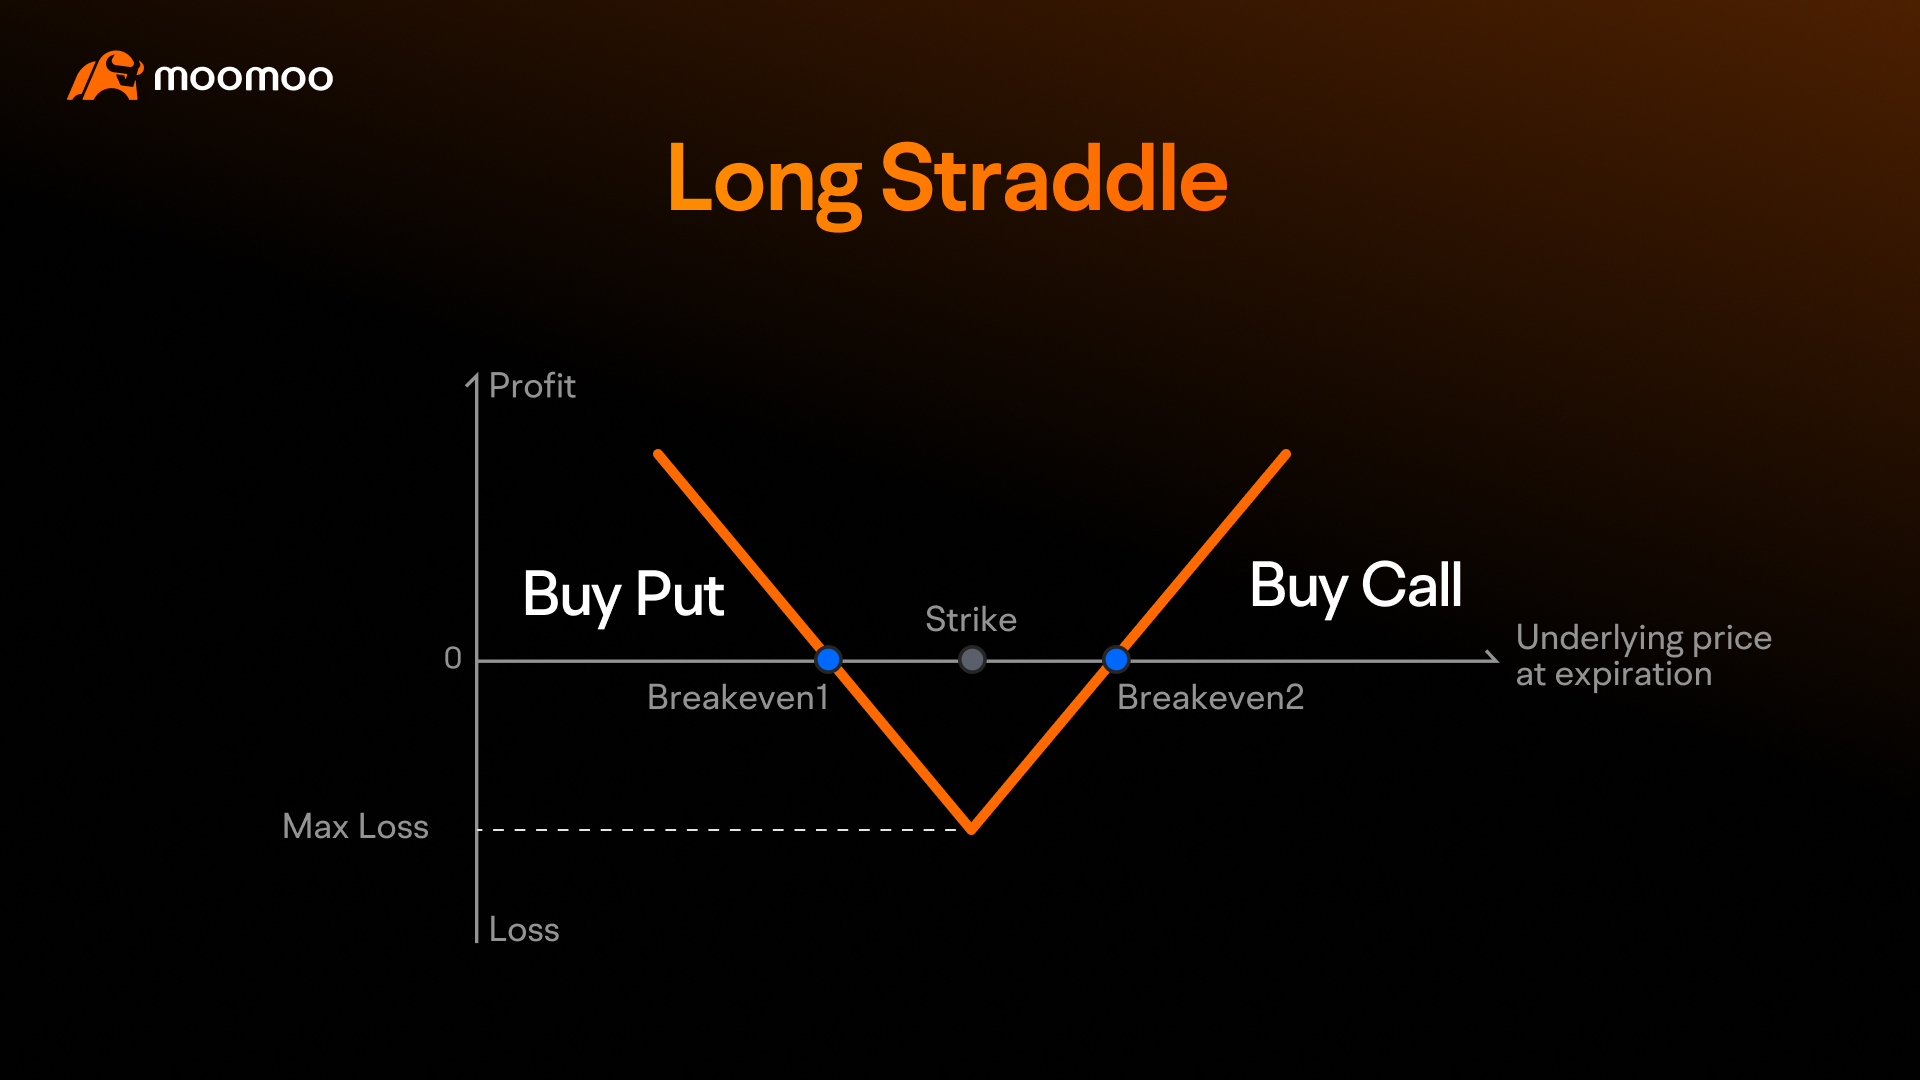
Long Straddle:
Setup: Buy an at-the-money (ATM) call and an ATM put at the same strike.
Pros: Benefits from a large price move in either direction.
Cons: Expensive due to buying two ATM options; requires a substantial price move to offset the cost.
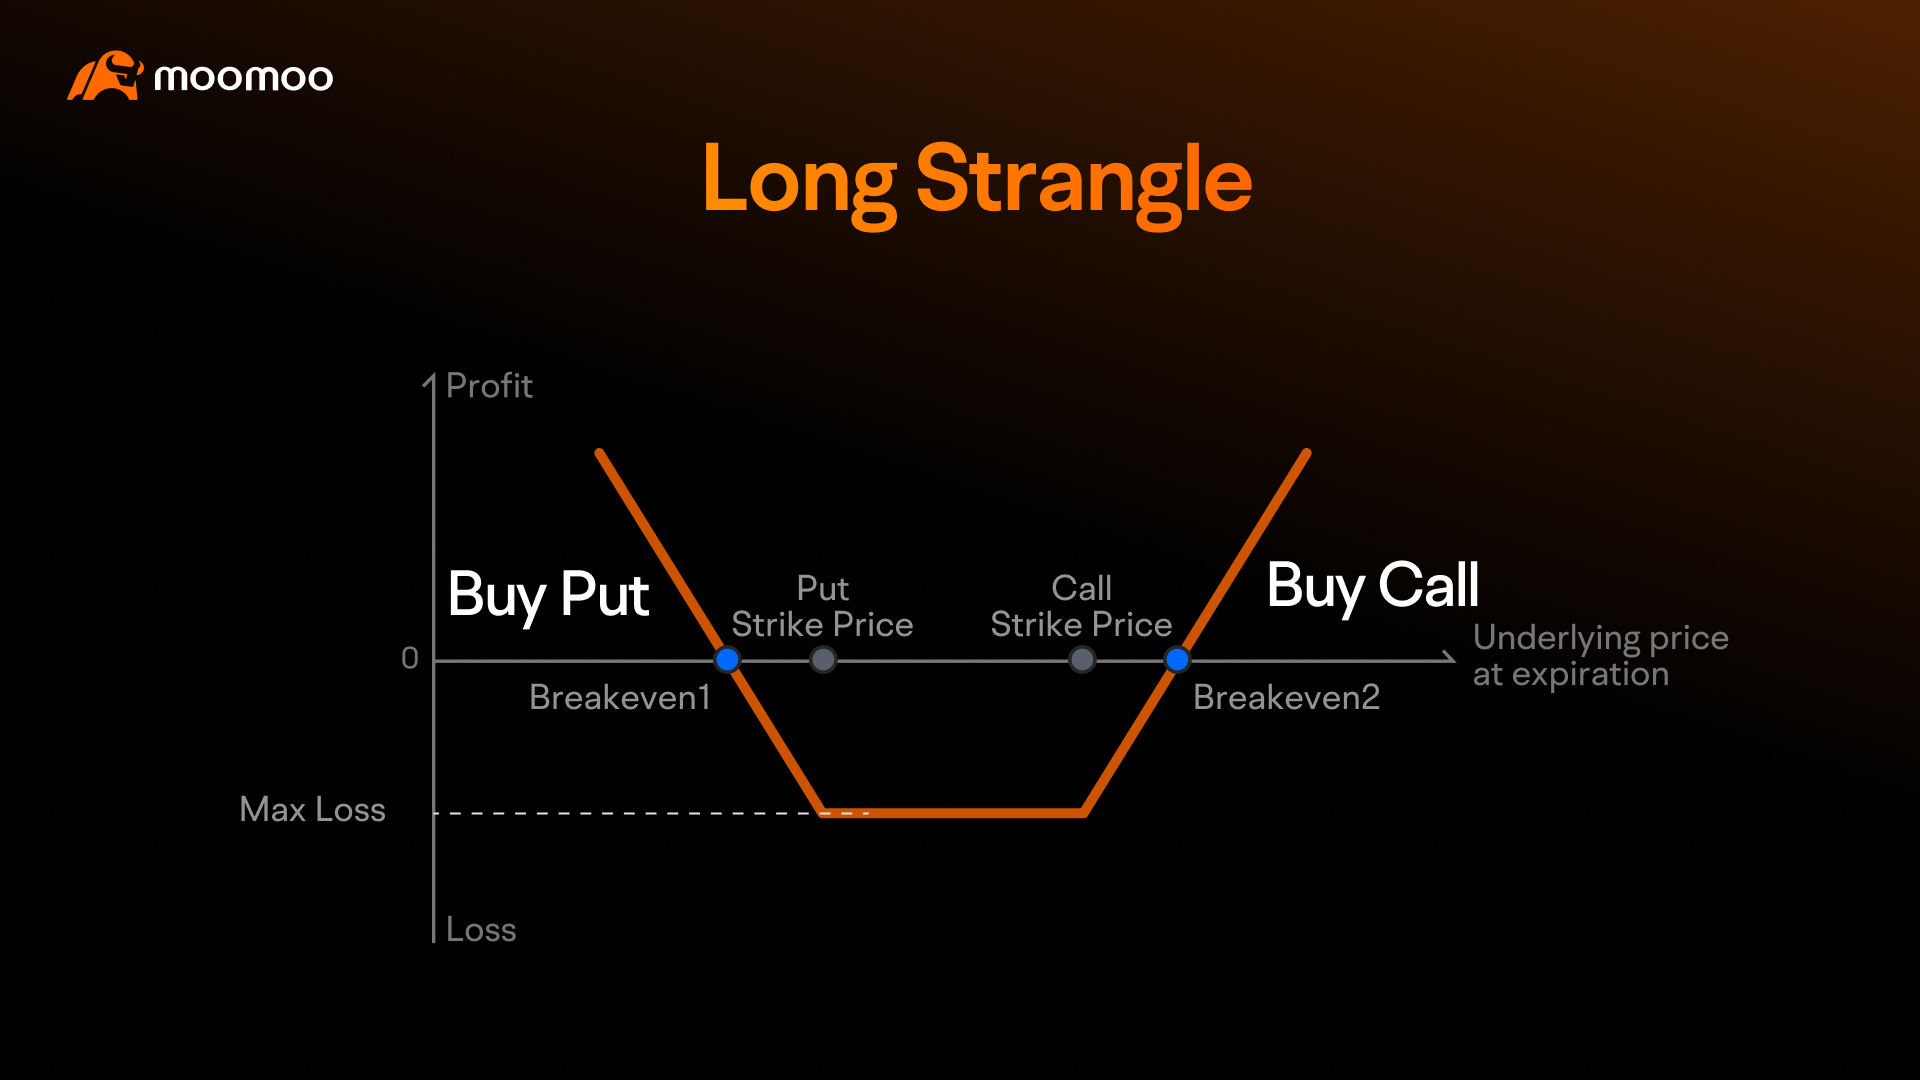
Long Strangle:
Setup: Buy an out-of-the-money (OTM) call and an OTM put at different strikes.
Pros: Cheaper than a straddle due to OTM options.
Cons: Needs a larger price move to be profitable compared to a straddle.
Directional Strategies (With Bias)
If you have a directional bias (e.g., expecting a bullish or bearish), you might consider these directional long Vega strategies:
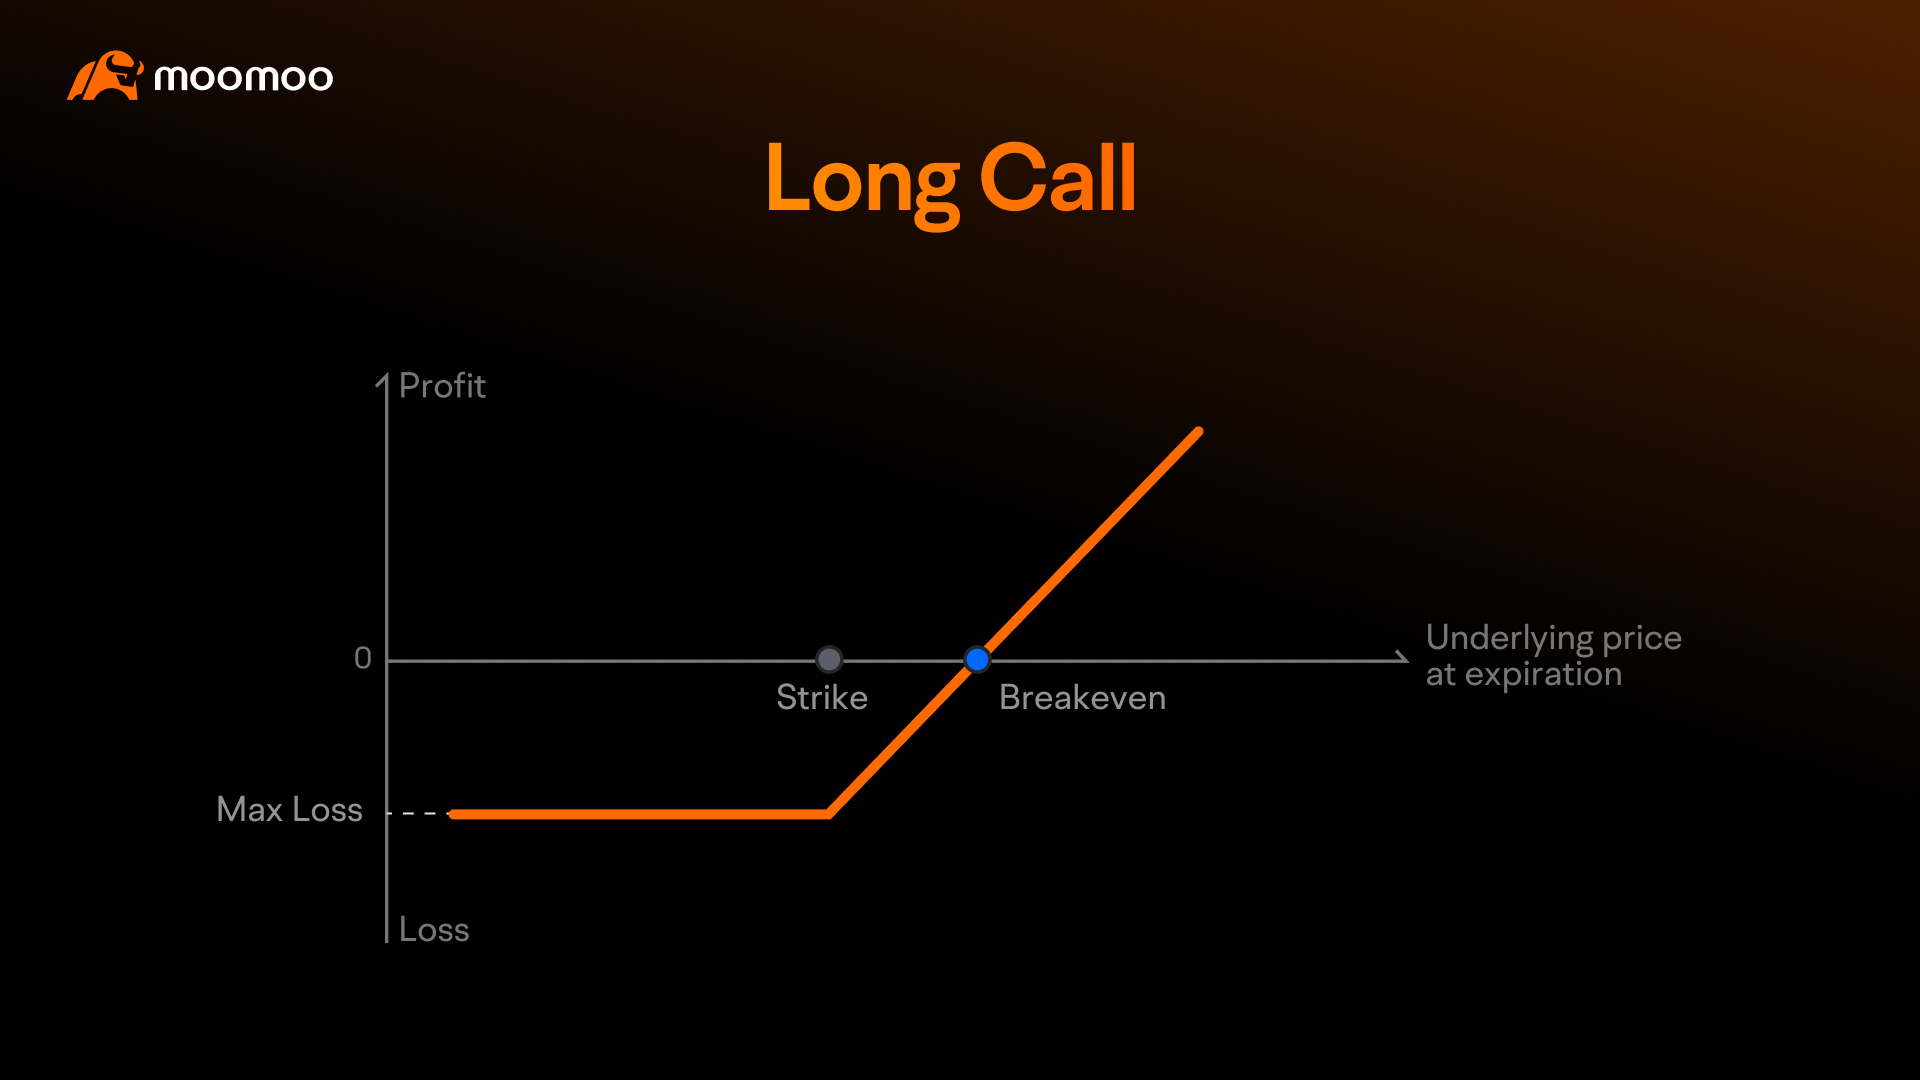
Setup: Buy an ATM or slightly OTM call.
Pros: Benefits from an upward move.
Cons: One-sided risk; loses value if the stock moves down or doesn’t move enough.
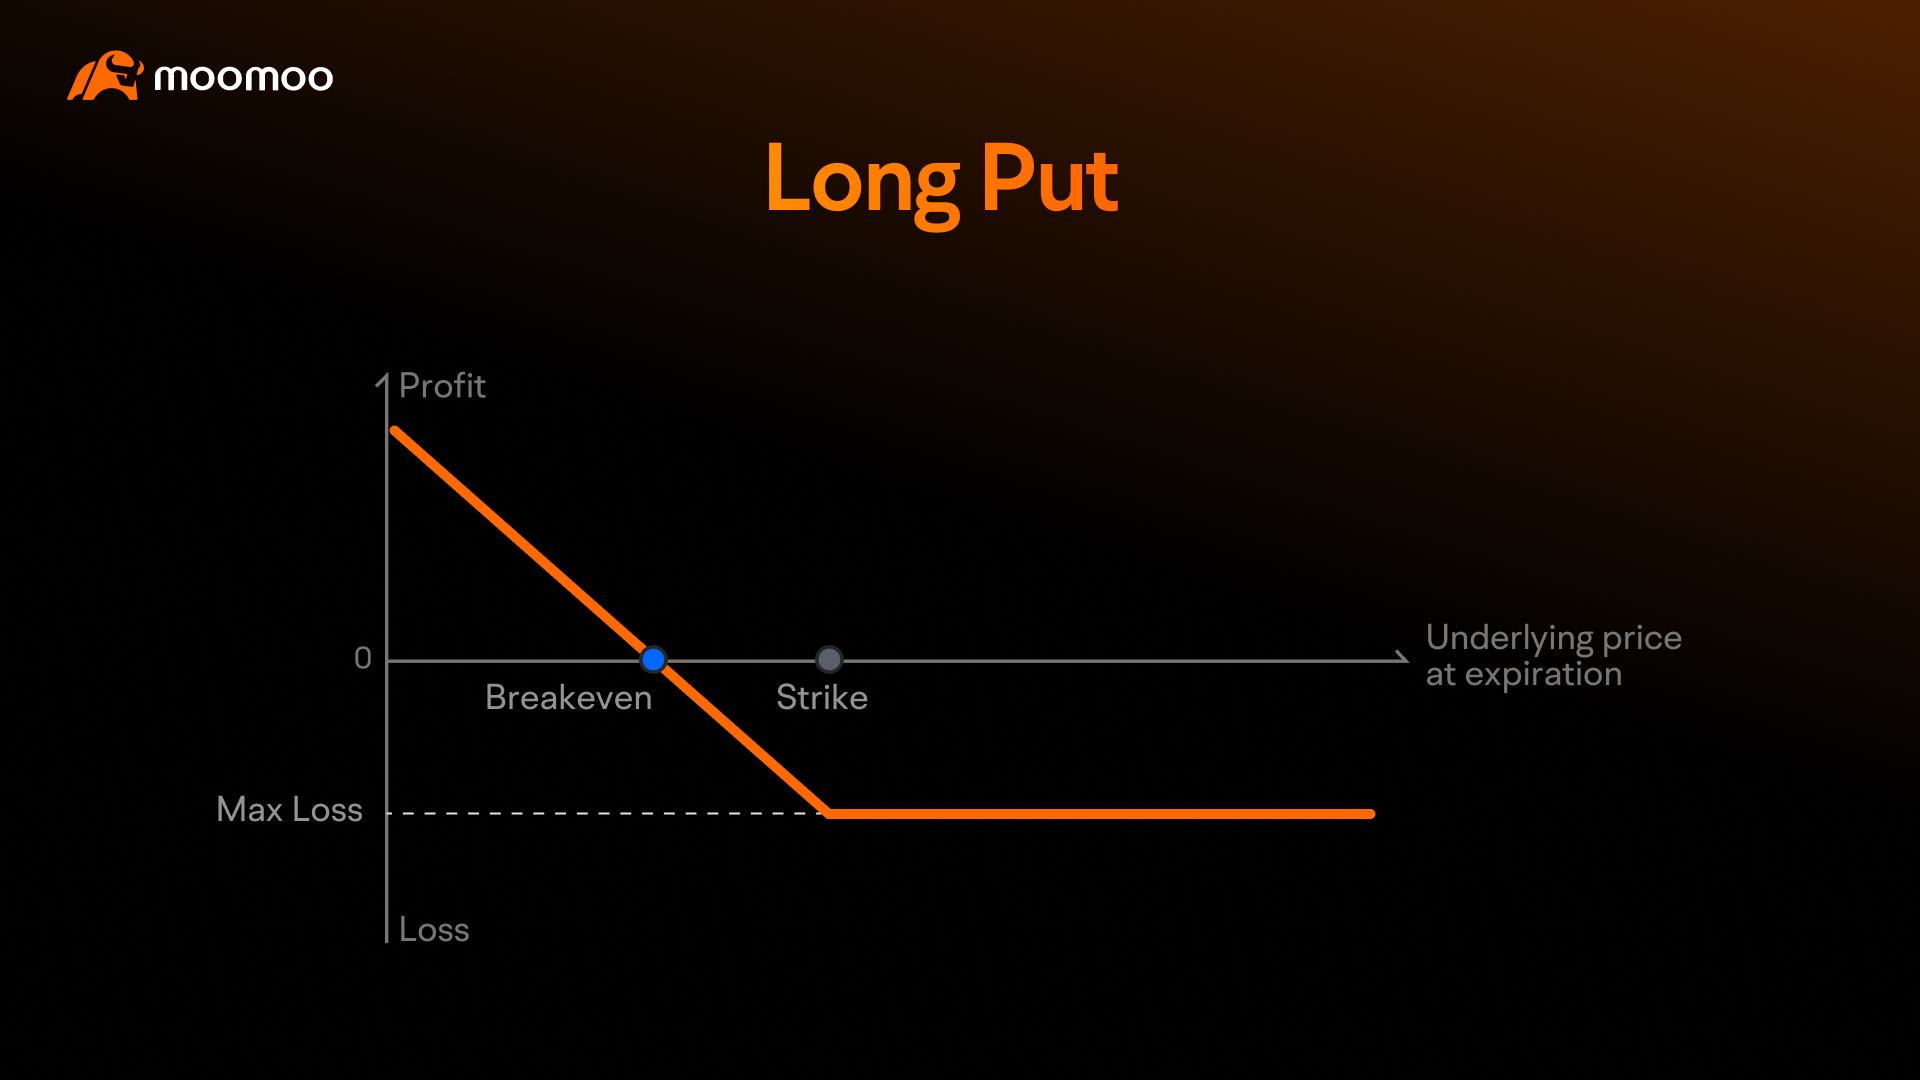
Setup: Buy an ATM or slightly OTM put.
Pros: Benefits from a downward move.
Cons: One-sided risk; loses value if the stock moves up or doesn’t move enough.
Important Note: While these strategies are commonly used for pre-earnings trades, there is no guarantee they will be profitable, as market conditions can be unpredictable, and various risks, such as unexpected price movements or changes in volatility, may impact outcomes.
6. Using moomoo’s Strategy Builder to Customize Your Approach
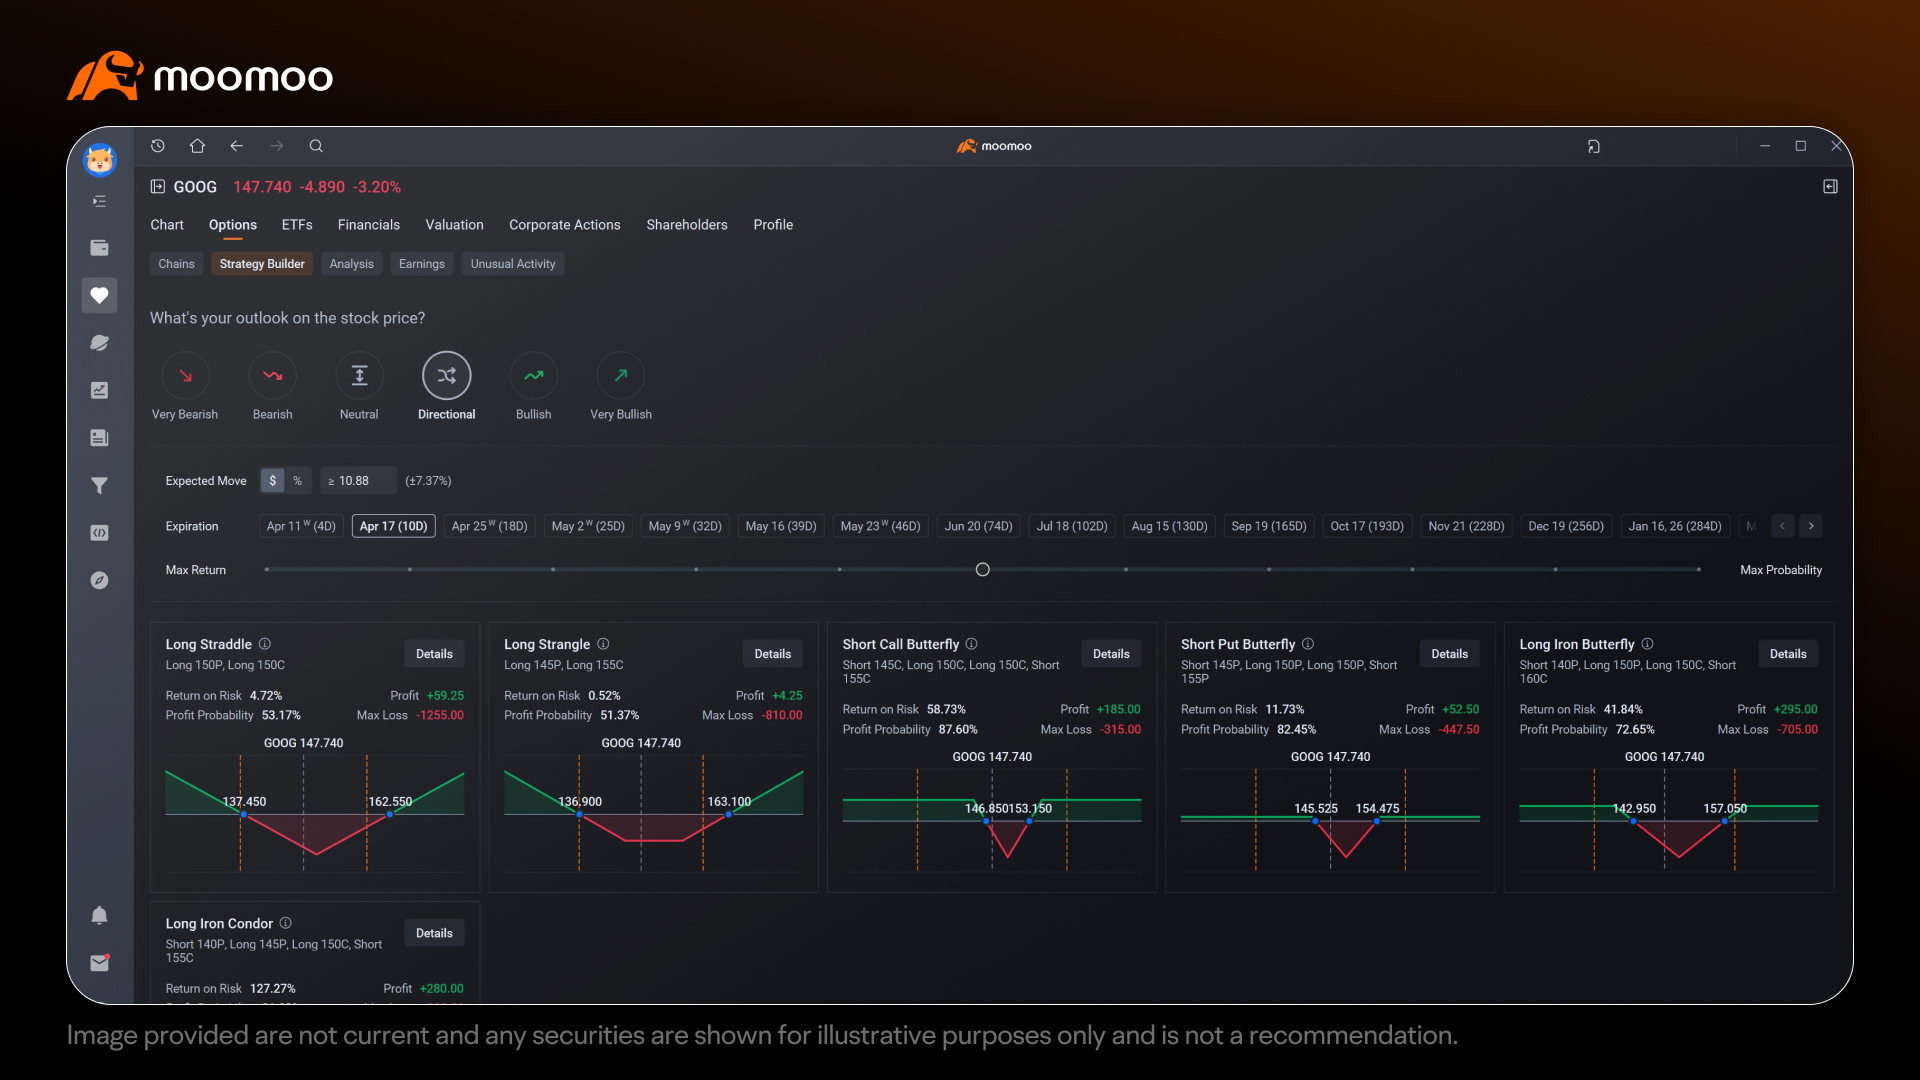
If you already have a directional outlook or a specific strategy in mind, moomoo’s Strategy Builder can help you refine your approach. The Strategy Builder provides strategies based on your outlook for the stock price, making it easier to find a setup that matches your expectations. Here’s how you might use it:
How the Strategy Builder Works
Selecting Your Outlook: The Strategy Builder allows you to input your outlook on the stock price, such as "Very Bearish," "Bearish," "Neutral," "Bullish," or "Very Bullish." This can be based on your analysis of the stock’s potential reaction to earnings or other factors.
Viewing Available Strategies: After analyzing IV and other factors, traders may have different outlooks. To explore strategies that align with your outlook, you can select options like "Neutral," "Bearish," "Very Bearish," "Bullish," "Very Bullish," or "Directional" in the Strategy Builder. For example, a "Neutral" outlook will include strategies like Short Iron Condor or Long Call Butterfly, while "Bearish" or "Very Bearish" will include Long Put or Short Call, and "Bullish" or "Very Bullish" will include Long Call or Short Put. If you expect a large move in either direction (classified as "Directional"), strategies like Long Straddle or Long Strangle will be available. Many other strategies are also provided for reference within each outlook.
Filling in Criteria: Depending on your outlook, you can input criteria like expected move, target price, budget, and expiration date to filter strategies. For "Neutral" or "Directional" outlooks, you can set the expected move (e.g., percentage or dollar change up or down); for "Bullish" or "Bearish" outlooks, you set a target price (your expected stock price). Budget is the maximum you’re willing to spend or risk on the trade, filtering strategies to fit this cost. You can also adjust a "Max Return" vs. "Max Probability" slider to prioritize your preference: for example, with a "Bullish" outlook, a long call strategy may appear; sliding toward "Max Return" might show a long OTM call with a high Return on Risk but low Profit Probability, while sliding toward "Max Probability" might adjust the strike to ITM or closer, increasing Profit Probability but lowering Return on Risk, updating the strategy box accordingly.
Analyzing Risk and Reward: For each strategy, the Strategy Builder provides key metrics such as the theoretical cost, theoretical maximum profit, maximum loss, and a projection of profit probability. This can help you evaluate whether the strategy aligns with your risk tolerance.
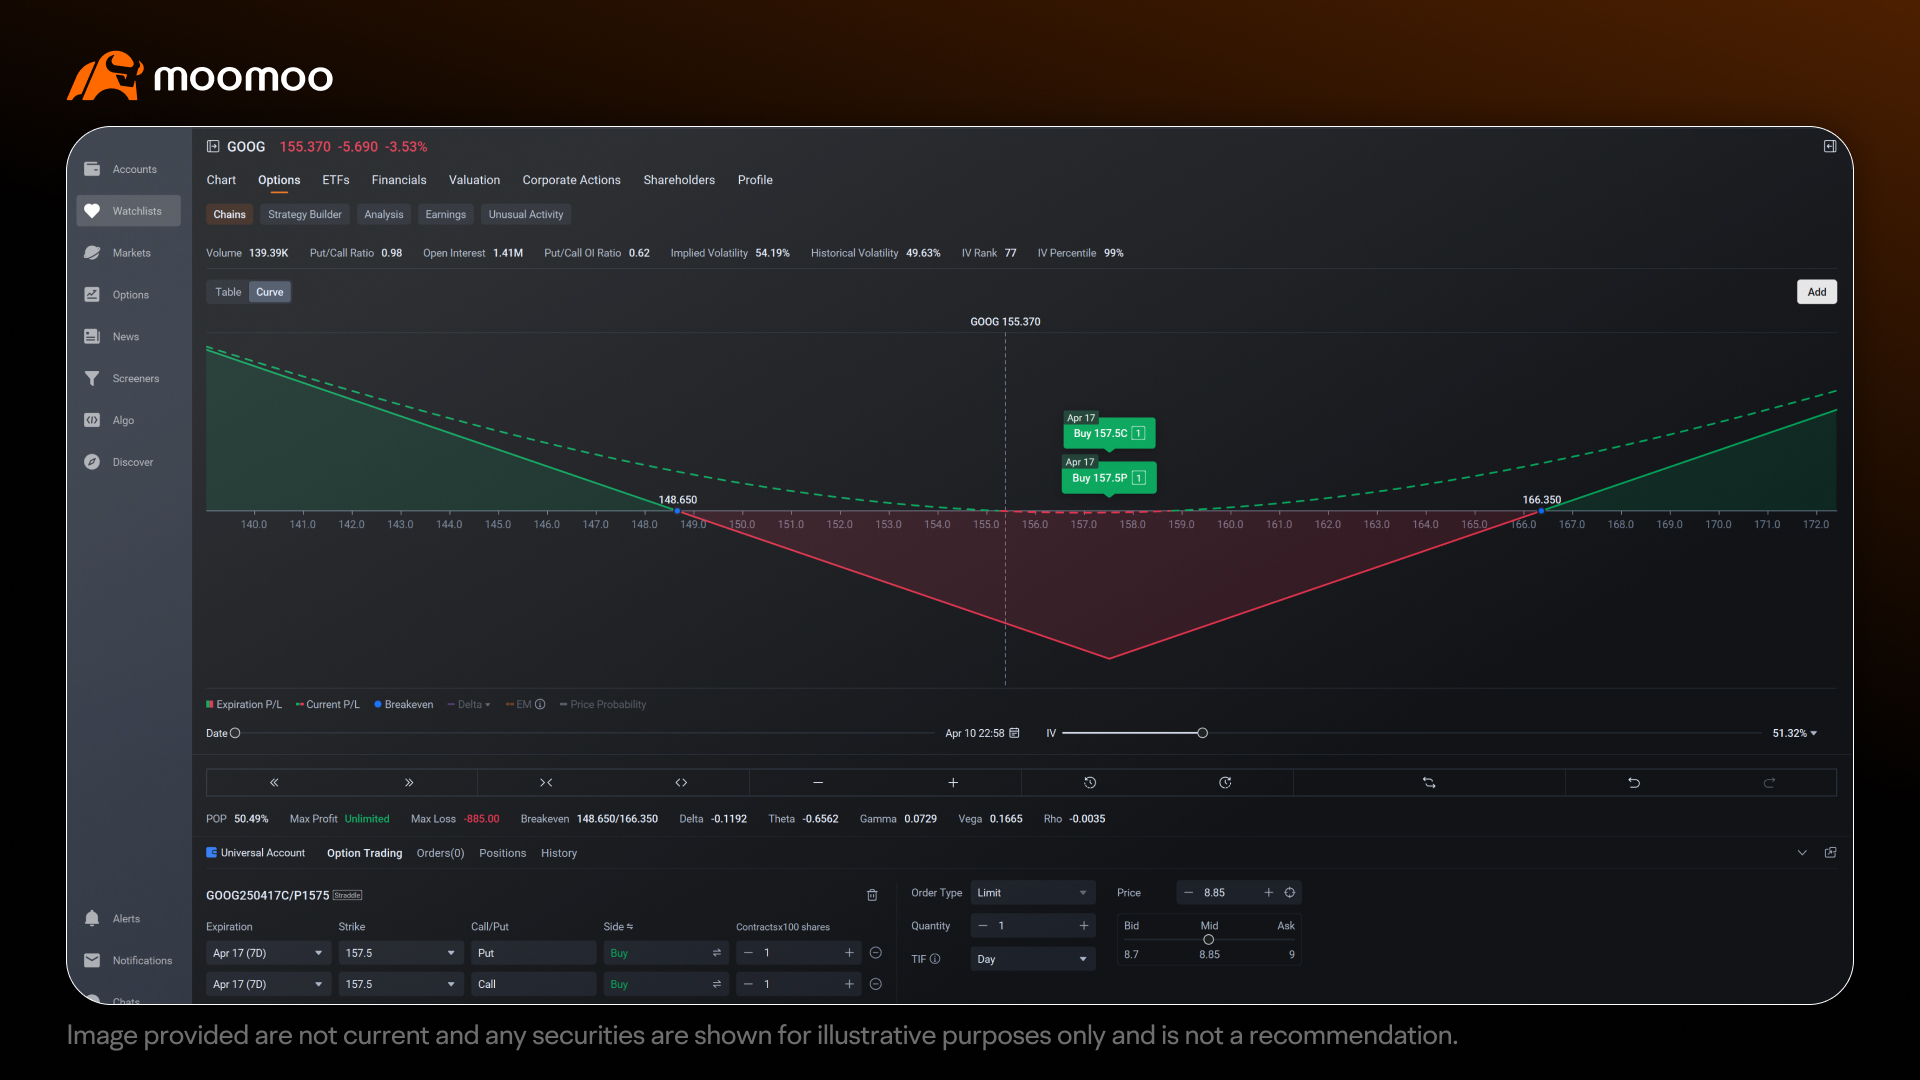
Visualizing, Simulating, and Finalizing the Trade: After selecting a strategy, you can click "Trade" to access the options curve interface. This allows you to further adjust the strike prices and expiration dates, visualize the potential profit/loss diagram, and review key metrics like projected probability of profit, theoretical maximum profit, theoretical maximum loss, and breakeven points. You might then simulate your setup using the options curve to see how it might perform under different scenarios—for example, adjusting the date to see how the P/L graph looks after a few days, or modifying the implied volatility to observe the impact of an IV drop or rise on the P/L graph—helping you ensure you’re comfortable with the trade.
Example Use Case
If you expect a large price move in either direction due to an upcoming earnings announcement, you might select a "Directional" outlook in the Strategy Builder. Next, you can input criteria such as expected move, target price, budget, and expiration date, adjusting the Max Return/Max Probability slider to suit your preference. The Strategy Builder will then display strategies like Long Straddle or Long Strangle, along with their key metrics. You might choose a strategy, such as a Long Straddle, which involves buying an ATM call and an ATM put at the same strike. After selecting the strategy, you can click "Trade" to access the options curve interface, where you can further adjust the strikes and expiration, visualize the payoff diagram, and review metrics.
7. Managing the Post-Earnings IV Crush
The Challenge: IV Drops After Earnings
After an earnings announcement, the uncertainty that drove IV higher typically resolves, generally leading to a sharp decline in IV known as the IV crush. This drop can significantly reduce option premiums, even if the underlying stock moves in your favor, potentially impacting the profitability of long Vega positions.
Commonly Used Strategies to Manage IV Crush Risk
Exiting Before Earnings: You might consider closing your position 1-2 days before the earnings announcement to capture the IV expansion and avoid the IV crush. This approach can be an effective way to protect potential gains that resulted from the pre-earnings volatility spike.
Using Spreads to Limit Risk: Strategies such as butterflies, debit spreads, etc, can reduce the impact of IV crush by combining long and short options, potentially lowering the overall cost and risk.
Scaling Out Early: If IV rises significantly in the days leading up to earnings, you might consider taking partial profits to lock in gains while leaving a smaller position to potentially capture any additional upside.
8. Conclusion
Earnings season can present opportunities to explore IV expansion through long Vega strategies, allowing traders to potentially benefit from rising option premiums. By leveraging moomoo’s Earnings tools to analyze historical data, exploring various strategies, and testing setups in a demo environment, traders can position themselves to navigate earnings season more effectively. However, it’s important to remain mindful of risks, such as inconsistent IV patterns, the post-earnings IV crush, and unpredictable market conditions, as there is no guarantee of profitability due to factors like unexpected price movements or changes in volatility. Balancing preparation with risk management can help traders approach earnings season with a more informed approach.
Disclaimer
Options trading entails significant risk and is not appropriate for all customers. It is important that investors read Characteristics and Risks of Standardized Options before engaging in any options trading strategies. Opening new options positions close to or on their expiration date comes with substantial risk of losses for reasons that include potential volatility of the underlying security and limited time to expiration. Options transactions are often complex and may involve the potential of losing the entire investment in a relatively short period of time. Certain complex options strategies carry additional risk, including the potential for losses that may exceed the original investment amount. Supporting documentation for any claims, if applicable, will be furnished upon request.
The use Option Strategy Builder is for informational purposes only and should not be considered a personalized recommendation or investment advice. The P/L Analysis performs hypothetical calculations based on model assumptions and other inputs you select, which may not reflect actual market conditions and do not guarantee future results.
Maximum potential loss and profit for options are calculated based on the single leg or an entire multi-leg trade remaining intact until expiration with no option contracts being exercised or assigned. These figures do not account for a portion of a multi-leg strategy being changed or removed or the trader assuming a short or long position in the underlying stock at or before expiration. Therefore, it is possible to lose more than the theoretical max loss of a strategy.
This presentation is for informational and educational use only and is not a recommendation or endorsement of any particular investment or investment strategy. Investment information provided in this content is general in nature, strictly for illustrative purposes, and may not be appropriate for all investors. It is provided without respect to individual investors’ financial sophistication, financial situation, investment objectives, investing time horizon, or risk tolerance. You should consider the appropriateness of this information having regard to your relevant personal circumstances before making any investment decisions. Past investment performance does not indicate or guarantee future success. Returns will vary, and all investments carry risks, including loss of principal. moomoo makes no representation or warranty as to its adequacy, completeness, accuracy or timeliness for any particular purpose of the above content.
Moomoo is a financial information and trading app offered by Moomoo Technologies Inc. Securities offered through moomoo Financial Inc, Member FINRA/SIPC.
In Singapore, investment products and services available through the moomoo app are offered through Moomoo Financial Singapore Pte. Ltd. regulated by the Monetary Authority of Singapore (MAS). Moomoo Financial Singapore Pte. Ltd. is a Capital Markets Services Licence (License No. CMS101000) holder with the Exempt Financial Adviser Status. This advertisement has not been reviewed by the Monetary Authority of Singapore.
In Australia, financial products and services available through the moomoo app are provided by Moomoo Securities Australia Limited, an Australian Financial Services Licensee (AFSL No. 224663) regulated by the Australian Securities and Investment Commission (ASIC). Please read and understand our Financial Services Guide, Terms and Conditions, Privacy Policy, Options PDS, Target Market Determination and other disclosure documents which are available on our website https://www.moomoo.com/au.
In Canada, order-execution only services available through the moomoo app are provided by Moomoo Financial Canada Inc., regulated by the Canadian Investment Regulatory Organization (CIRO).
In Malaysia, investment products and services available through the moomoo app are offered through Moomoo Securities Malaysia Sdn. Bhd.("Moomoo MY") regulated by the Securities Commission of Malaysia (SC). Moomoo Securities Malaysia Sdn. Bhd.is a Capital Markets Services Licence (License No. eCMSL/A0397/2024) holder. This advertisement has not been reviewed by the SC.
Moomoo Technologies Inc., Moomoo Financial Inc., Moomoo Financial Singapore Pte. Ltd., Moomoo Securities Australia Limited.
This presentation is for informational and educational use only and is not a recommendation or endorsement of any particular investment or investment strategy. Investment information provided in this content is general in nature, strictly for illustrative purposes, and may not be appropriate for all investors. Read more