Decoding Chart Types: Choosing the Right View
Decoding Chart Types: Choosing the Right View
If you are new to trading like Alex, choosing the right chart to trade can be confusing or overwhelming.
By the end of this session, you’ll know the multiple chart types to use on moomoo to fit your unique trading style
Chart Types - Finding the Right Fit

Let’s explore the most popular chart types:
Line Chart: Simple and clean, this chart connects closing prices over time. Perfect for long-term trends and price comparison when you don’t need the noise of intraday movements.
Area Chart: Think of this as a line chart with more visual impact. The area under the line is filled, making it great for quickly spotting trends and changes in momentum over time.
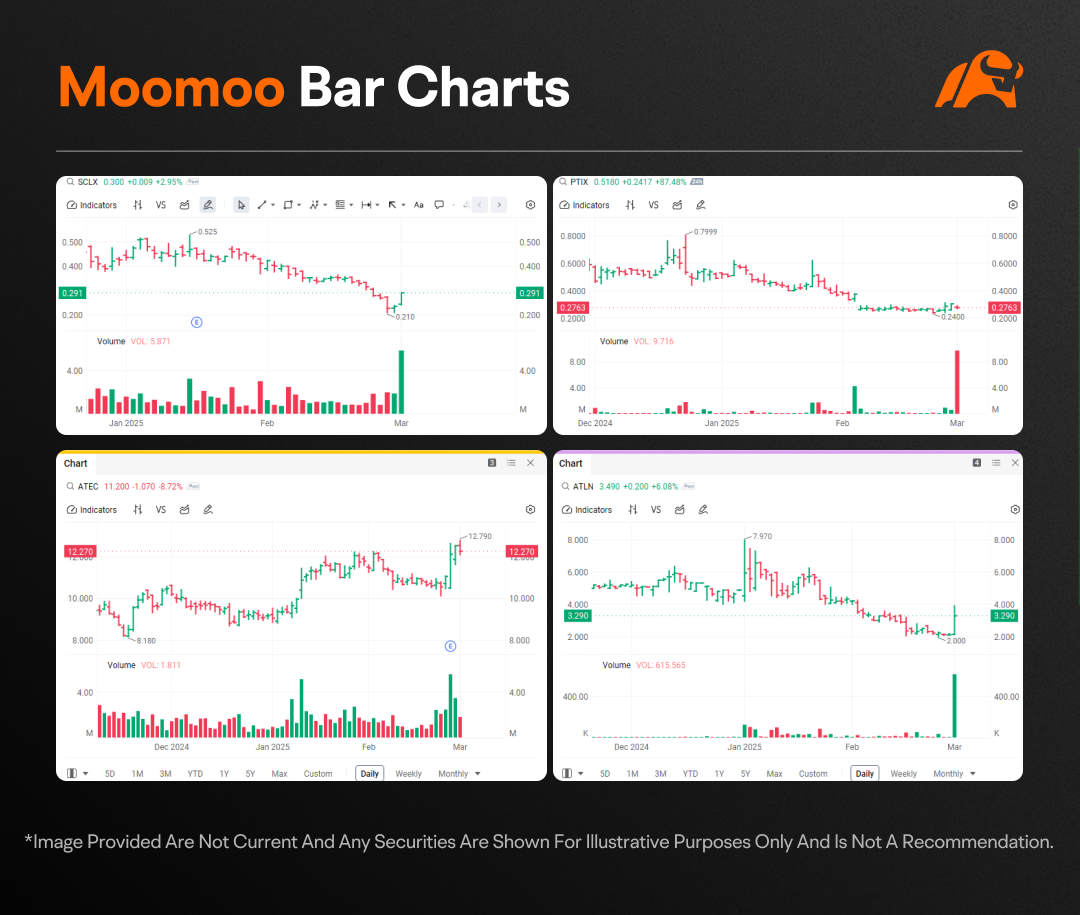
Bar Chart: Adds more detail. It shows the open, high, low, and close prices in each bar. Great for pinpointing key price levels.
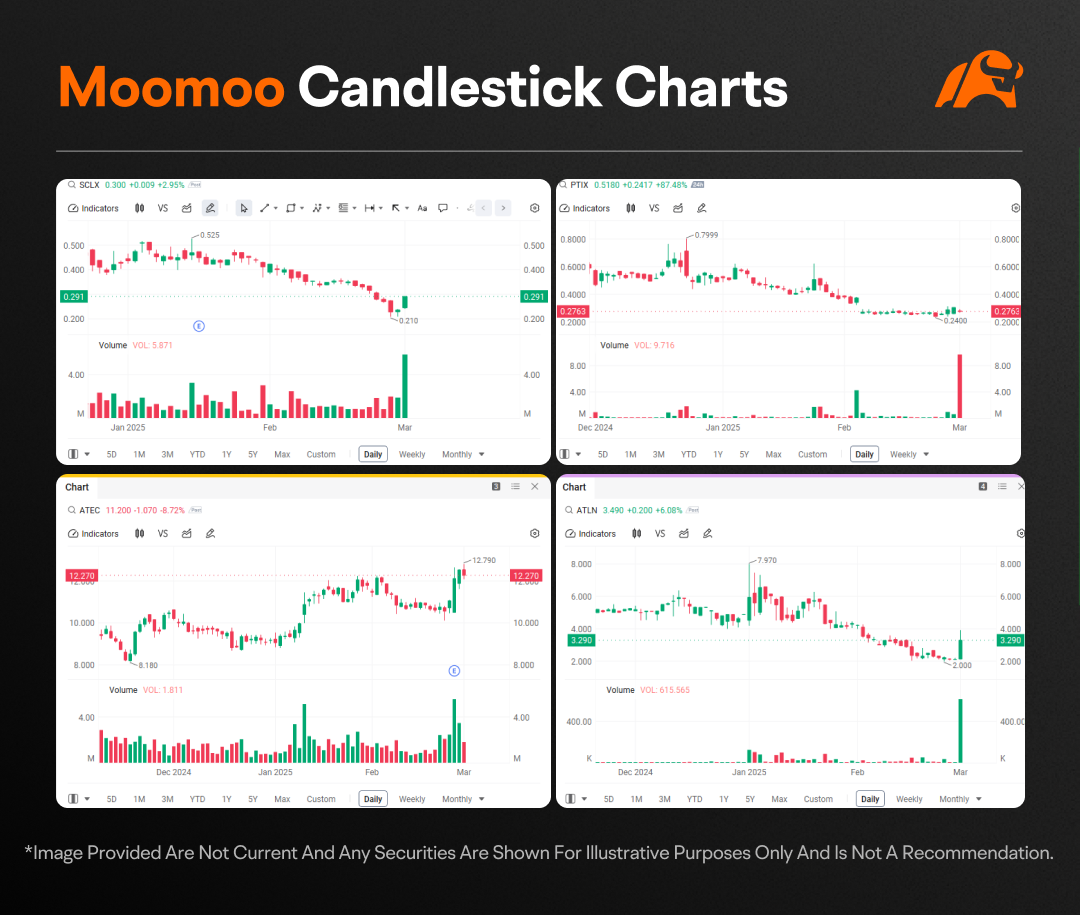
Candlestick Chart: A trader’s favorite! With colorful ‘bodies’ and ‘wicks,’ it provides a clear picture of price action, momentum, and market sentiment.
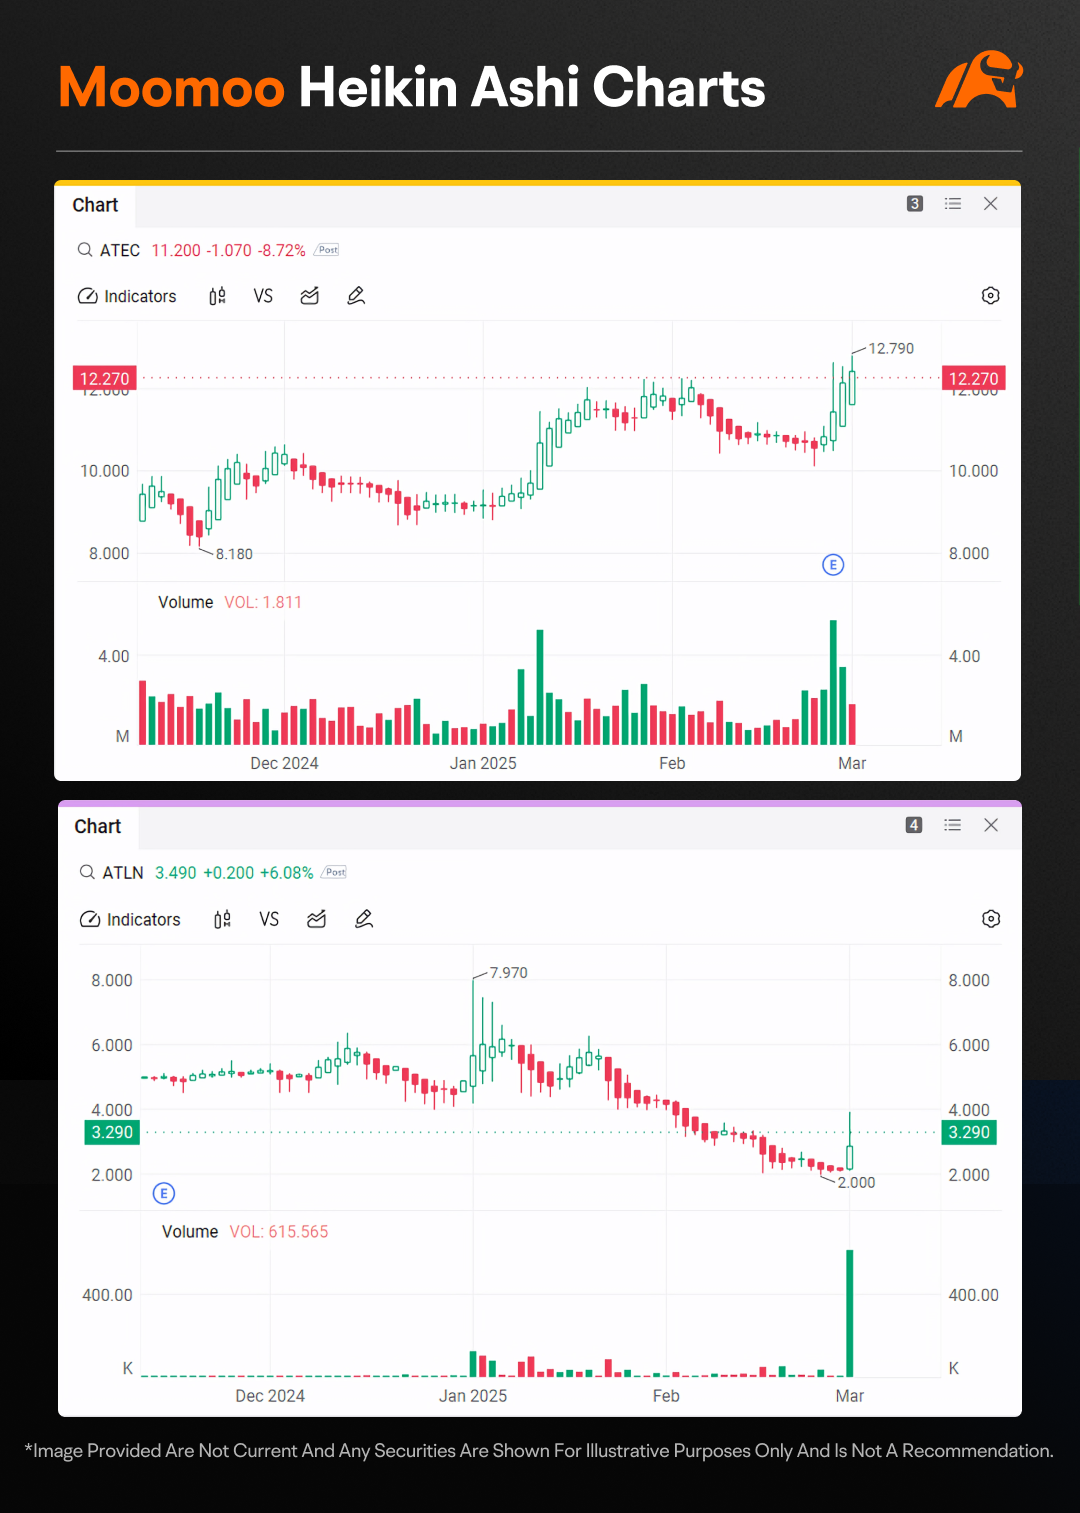
Heikin Ashi Chart: A game-changer for trend traders. It smooths out market noise, making trends easier to identify.
Real World Application of Each Chart Types
Here are examples on how Alex can use moomoo charts to find his next best healthcare stock to trade using a top down analysis approach.

Step 1: Market Trend Analysis with Line Chart
Alex opens the moomoo platform and pulls up a Line Chart to analyze price trends across various market sectors, such as healthcare, technology, energy, and basic materials. Using the Line Chart, he observes that the healthcare sector has shown relatively strong performance with a consistent upward trend over the past four months compared to the other sectors he reviewed, which have generally displayed flat or downward trends during the same period. This observation helps him consider potential opportunities in healthcare stocks as part of his broader investment strategy. The Line Chart’s clear presentation allows him to focus on long-term trends without the noise of intraday fluctuations.
Why Line Chart?
Useful for identifying long-term price trends.
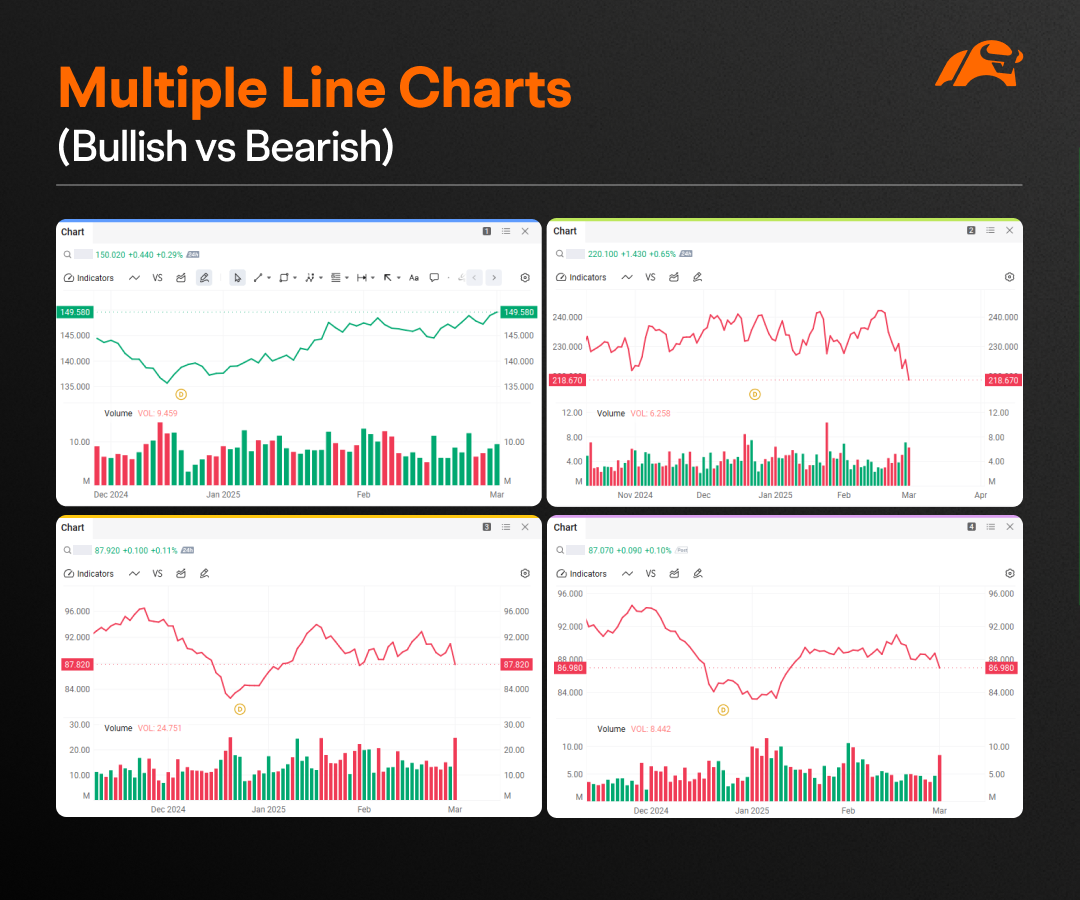
Helpful for comparing price movements across sectors or individual stocks on the same chart or multiple charts.

Step 2: Sector Momentum with Area Chart
Alex switches to an Area Chart to analyze related stocks within the healthcare sector. The chart shows a filled shaded green region under the line, highlighting the sector’s performance which indicates more potential than a filled shaded red region. The larger shaded region indicates a period of stronger upward momentum wheras the smaller shaded region indicates a smaller price changes. The Area Chart’s visual representation helps him understand momentum shifts alongside volume indicators. This can help him navigate market dynamics and evaluate investment strategies according to his risk tolerance and investment goals.
Why Area Chart?
Highlights momentum shifts visually together with volume indicators.
Easy to compare overall sector performance with multiple sectors/subsectors.
Step 3: Stock Selection with Bar Chart
Alex selects a few top-performing healthcare technology stocks, which is a sub-sector of healthcare stocks. He further examines their Bar Charts to evaluate volatility and key price levels from opening to closing in the most recent bars.
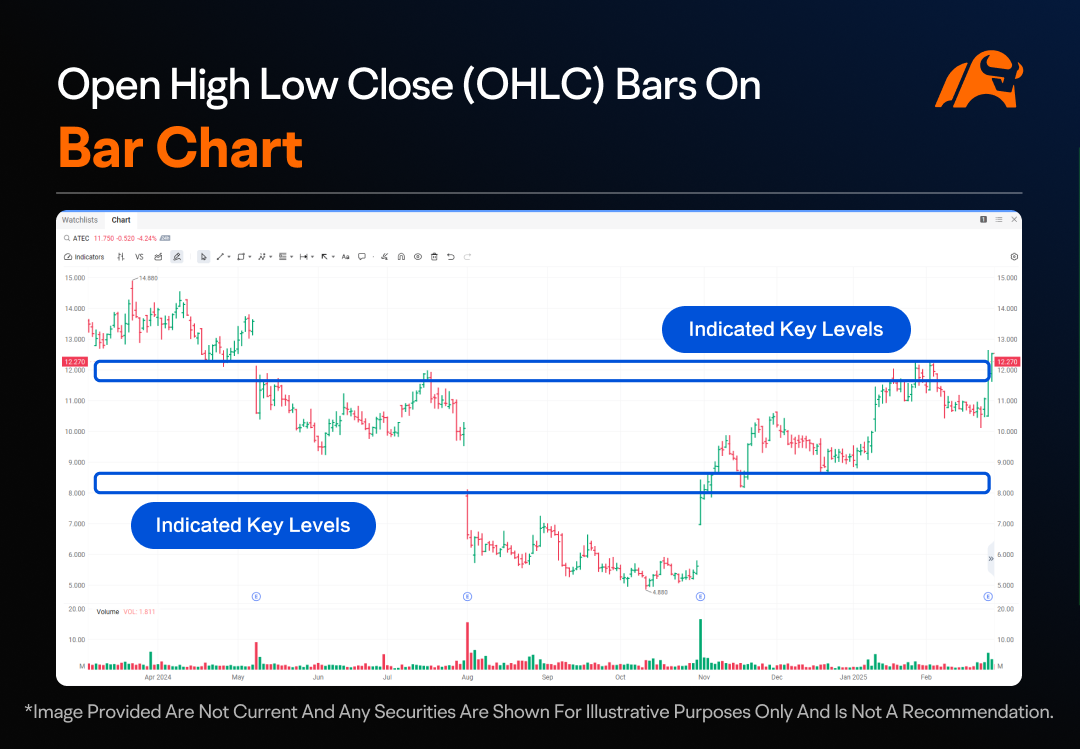
Using the Bar Chart, he analyzes the shortlisted stocks with the bar chart’s open, high, low, and close data to help him identify which stocks have a close bar right ABOVE the indicated key support levels. From this comparison, he found 4 stocks' most recent bar closing above the support level.
Why Bar Chart?
Shows precise price levels (open, high, low, close).
Useful for identifying potential support and resistance.
Step 4: Price Action Analysis with Candlestick Chart
Alex switches to the Candlestick Chart for stocks that displayed top performance over the previous 3 months, and found the bullish engulfing chart pattern, a green candle that is 2-3 times larger than the previous red candle, indicating a potential reversal at indicated support zone. This gives Alex more confidence to plan his entry next for the shortlisted stocks that displayed this candlestick pattern.
Why Candlestick Chart?
Offers a detailed view of market price action.
Highlights key patterns like dojis and engulfing candles easily
Step 5: Trend Confirmation with Heikin Ashi Chart
Alex switches to the Heikin Ashi Chart to further analyze the trend for 2 shortlisted stocks within the healthcare sector that have displayed a bullish engulfing chart pattern. The Heikin Ashi Chart shows that one stock displayed 4 consecutive bullish (green) bars following a shift from bearish (red) bars, while the other stock showed only 1 bullish (green) bar after a similar shift. While the Candlestick Chart provides detailed price action, the trend can sometimes be less clear. In contrast, the Heikin Ashi Chart’s bar colors make it easier for traders, like Alex, to objectively assess the trend, even with limited experience.
Why Heikin Ashi Chart?
Simplifies trend identification through clear bar colors.
Helps traders assess trend direction objectively, even with limited experience.

To gain additional confirmation of the trend, Alex returns to the Candlestick Chart and adds his preferred technical indicator MA and MACD. This step helps him confirm the trend change and reinforces his conviction that ATEC has the clearest bullish signals out of all stocks with the candlestick closing above 30 MA and 200 MA, and MACD histogram showing green instead of red, with the MACD lines staying above 0.
He will then proceed to use the Candlestick Chart to perform further technical analysis, such as studying price action, volume, support and resistance, and trendlines, before planning his entry.
After completing his top-down analysis, Alex continued to monitor his trades in coming days using Candlestick and Heikin Ashi charts interchangeably to try to ensure he only exits when the trend is broken.
Moomoo Charting
Since Alex has successfully learned how to do this, now it's your turn to get started with the same exercise using the moomoo chart to explore the different chart types.
Download the latest moomoo software and navigate to the ‘Chart Settings’ menu of a particular chart
Choose between Line, Bar, Area, Candlestick, or Heikin Ashi charts.
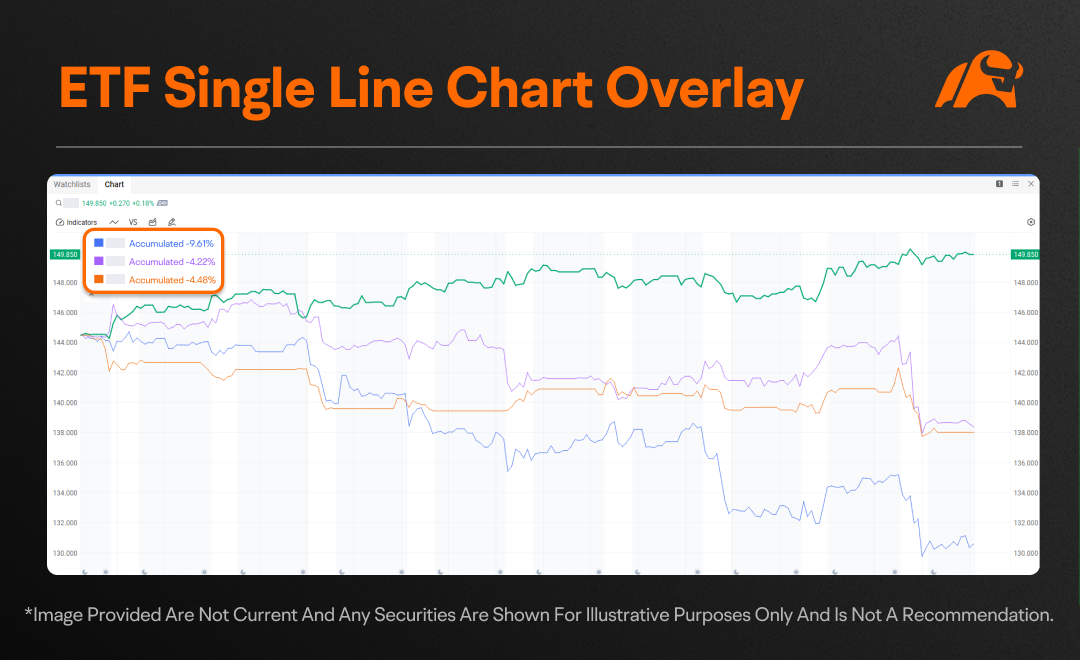
For line chart, you can configure as single chart (overlay) or multi charts with 'custom' tab to compare different sector's price changes or growth at the same time.
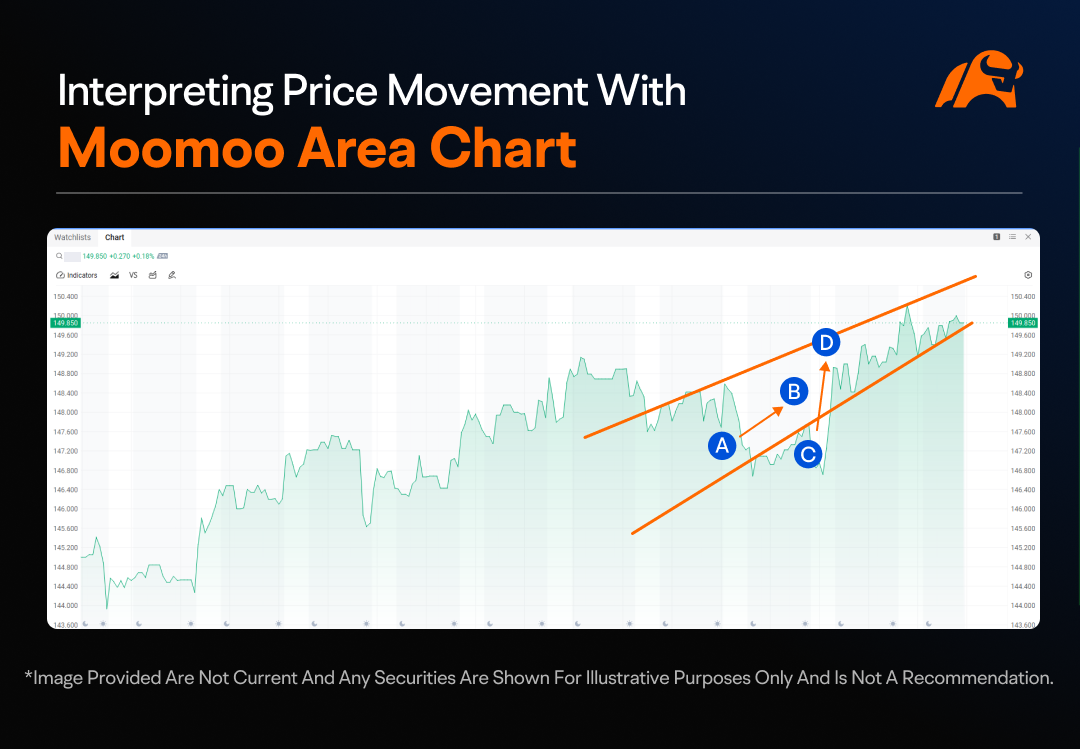
For an area chart, you can interpret price movements by evaluating the steepness of price changes. For example, the uptrend from point C to point D is steeper compared to the trend from point A to point B. Additionally, potential trendline support and resistance levels can be easily identified within the two red lines, without the distractions of market noise.
For bar chart, it adds more detail. It shows the open, high, low, and close prices in each bar and it's great for identifying key price levels.
For the candlestick chart, you have a choice of hollow candle chart, candlestick chart and four style candles chart to see each candlestick type and size in a different way.
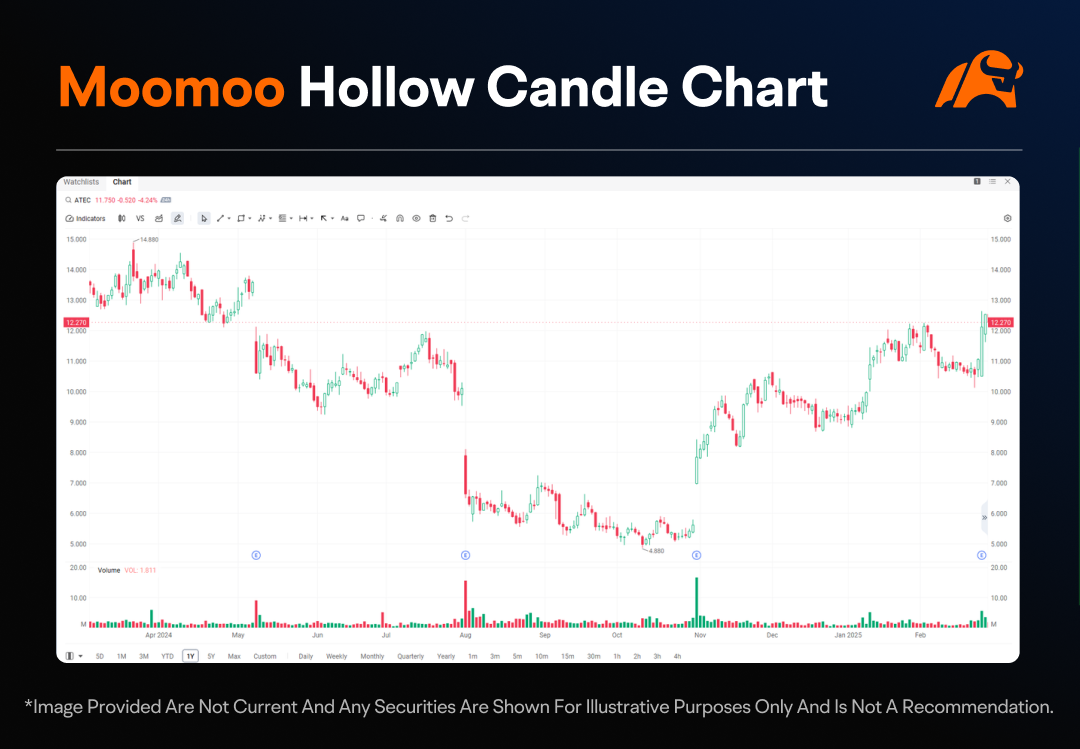
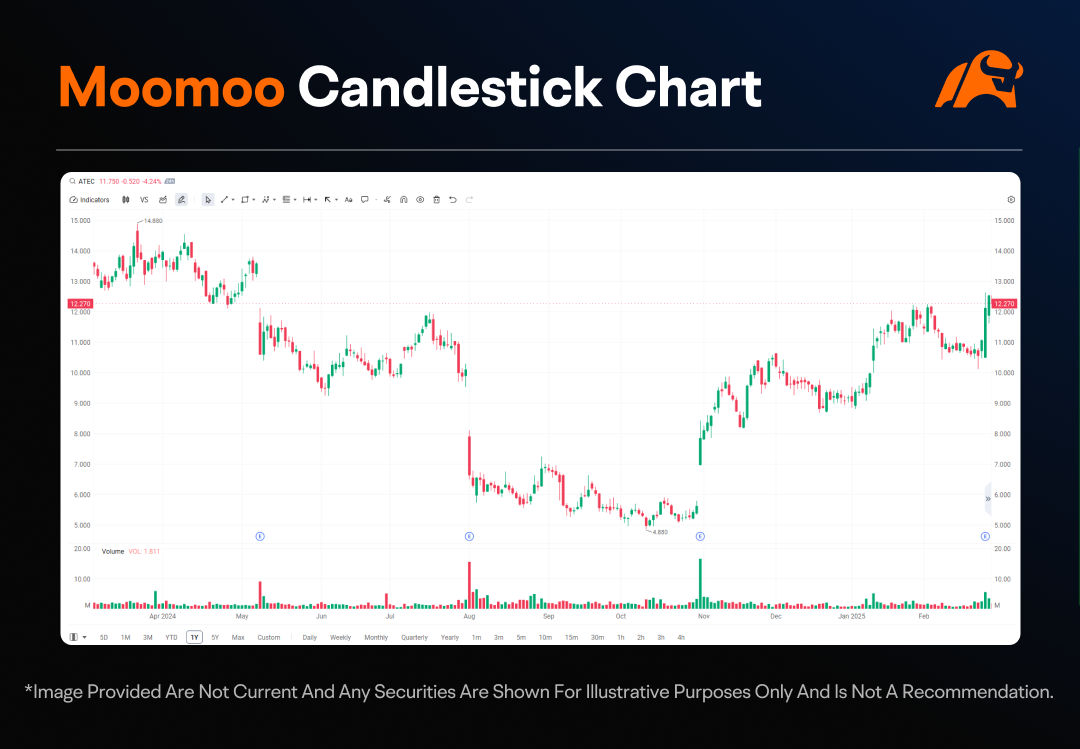
Four style candles chart are a combination of standard candle and hollow candle chart。
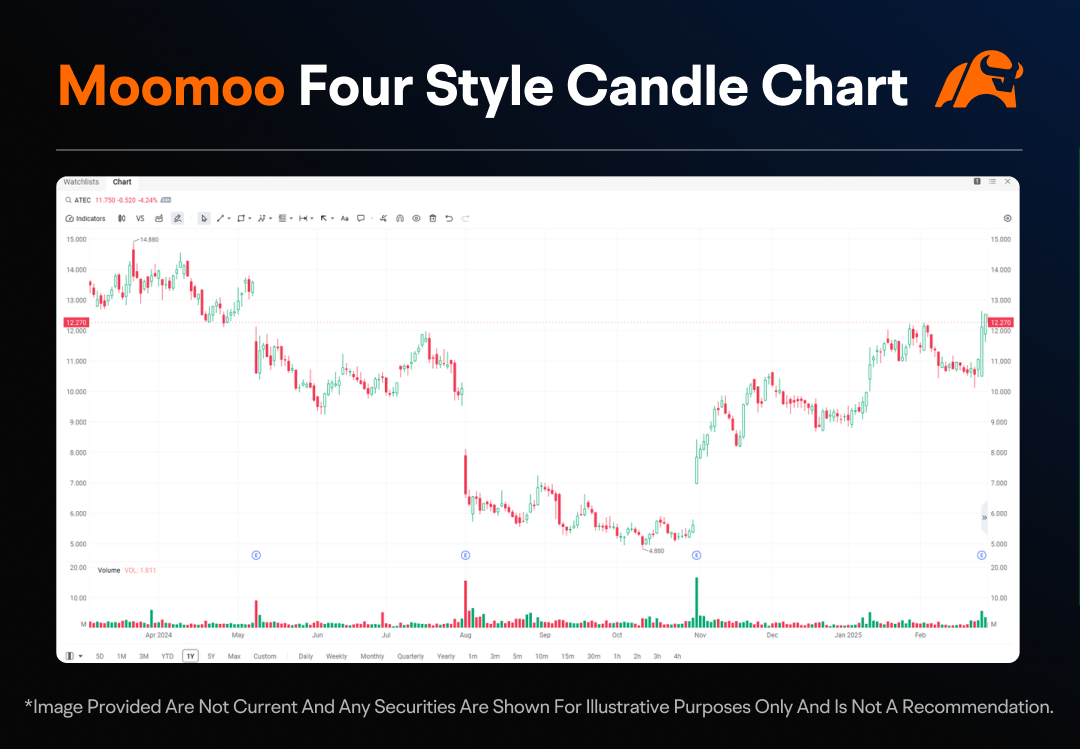
You are welcome to add technical indicators like moving averages for even deeper analysis.
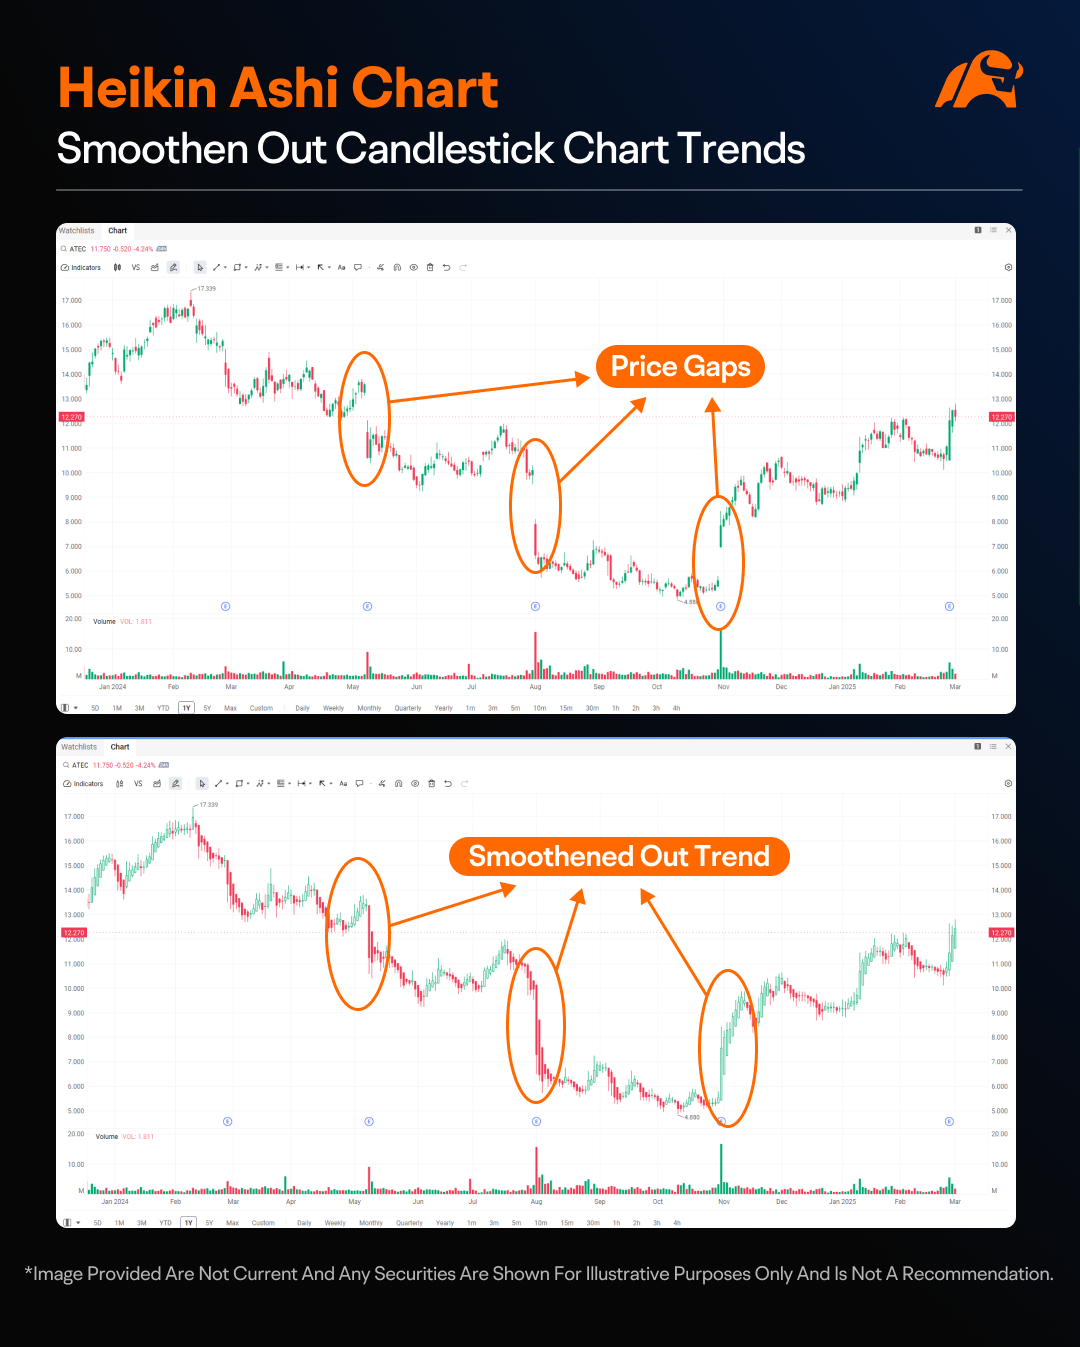
For Heikin Ashi chart, you can smooth out choppy price actions of the Candlestick chart and see the previous trends clearly from the beginning to the end, when was the turning point of a trend and whether the trend was short term or long term when compared with previous trends.
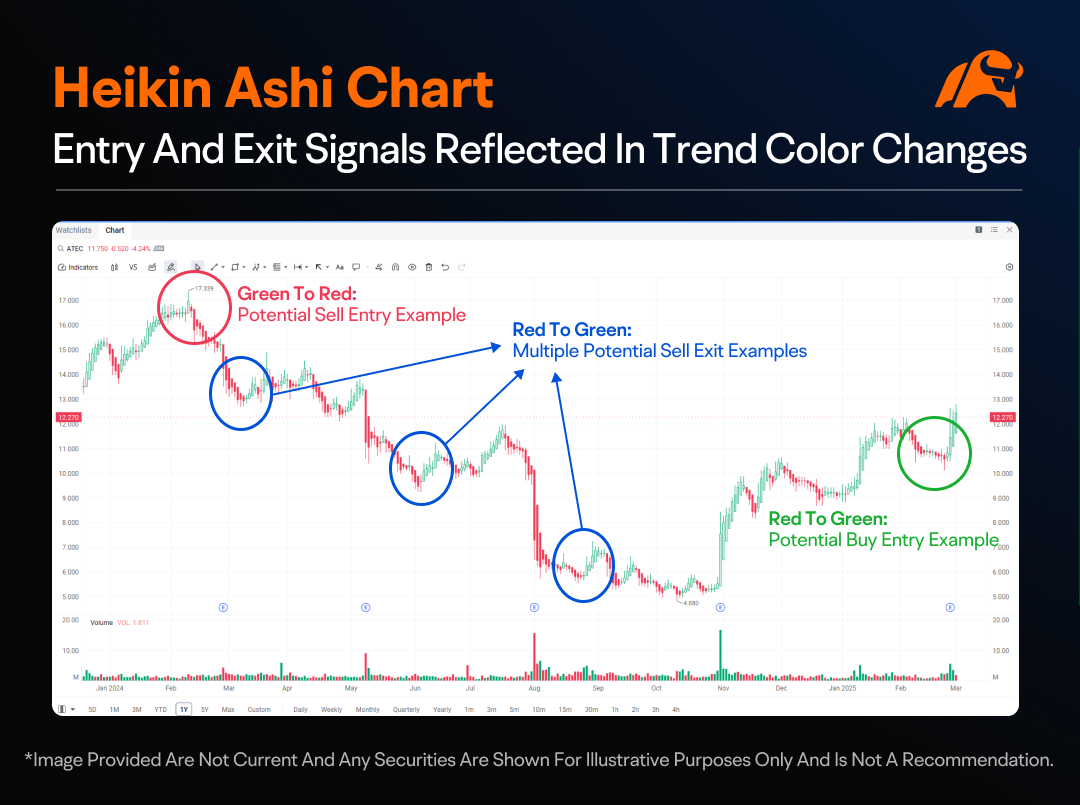
If you are trading with a trend, this chart allows you to manage your exit point more efficiently potentially leading to additional profit.
If you are trading against the trend, this chart allows you to identify the potential end of a trend and a possible reversal.

While each chart serves its purpose, the Candlestick Chart remains the go-to choice for both retail and professional traders. Its ability to reveal detailed price action and evaluate market sentiment makes it an invaluable tool for analyzing trends, spotting patterns, and timing entries and exits. However, it is important to note that candlestick analysis should be used as a supplement to a broader investment strategy. Relying solely on technical analysis may not be advisable, as other factors such as macroeconomic conditions, company fundamentals, and market news also play a crucial role in making well-informed trading decisions.
Stay on next to learn how to use different timeframes on moomoo charts so you can trade with your preferred timeframes at your convenience!
Disclaimer (US)
This presentation discusses technical analysis, other approaches, including fundamental analysis, may offer very different views. Any examples provided are for illustrative purposes only and are not intended to be reflective of the results you can expect to achieve. Specific security charts used are for illustrative purposes only and are not a recommendation, offer to sell, or a solicitation of an offer to buy any security. All investing involves risk, including the potential loss of principal, and there can be no guarantee that any investing strategy will be successful.
Investing in limited economic sectors involves greater risk and potentially greater return than investing in more diversified investment strategies. To the extent that the investment strategy is concentrated in a limited number of economic sectors, those investments may be subject to legislative or regulatory changes, adverse market conditions and/or increased competition affecting those economic sectors. The prices of the securities of companies in those sectors may fluctuate widely.
The moving average convergence divergence (MACD) is an oscillator in which entry and exit signals trigger when the indicator moves above or below the zero line.
Important Information: Before investing in an ETF, you should read both its summary prospectus and its full prospectus, which provide detailed information on the ETF’s investment objective, principal investment strategies, risks, costs, and historical performance (if any). You can find prospectuses on the websites of the financial firms that sponsor a particular ETF, as well as through your broker.
A Word About Risk: Investment returns will fluctuate and are subject to market volatility, so that an investor's shares, when redeemed or sold, may be worth more or less than their original cost. ETFs are subject to market volatility and the risks of their underlying securities, which may include the risks associated with investing in smaller companies, international securities, commodities, fixed income, and more. An ETF may trade at a premium or discount to its net asset value (NAV).
This presentation is for information and educational use only and is not a recommendation or endorsement of any particular investment or investment strategy. Investment information provided in this content is general in nature, strictly for illustrative purposes, and may not be appropriate for all investors. It is provided without respect to individual investors' financial sophistication, financial situation, investment objectives, investing time horizon, or risk tolerance. You should consider the appropriateness of this information having regard to your relevant personal circumstances before making any investment decisions. Past investment performance does not indicate or guarantee future success. Returns will vary, and all investments carry risks, including loss of principal. All participants shall be responsible for the comparison and consideration of any relevant fees, charges and costs involved before investing.
Moomoo is a financial information and trading app offered by Moomoo Technologies Inc.
In the U.S., investment products and services available through the moomoo app are offered by Moomoo Financial Inc., a broker-dealer registered with the U.S. Securities and Exchange Commission (SEC) and a member of Financial Industry Regulatory Authority (FINRA)/Securities Investor Protection Corporation (SIPC).
Disclaimer (Other Markets - SG/AU/CA/MY)
This presentation is for information and educational use only and is not a recommendation or endorsement of any particular investment or investment strategy. Investment information provided in this content is general in nature, strictly for illustrative purposes, and may not be appropriate for all investors. It is provided without respect to individual investors' financial sophistication, financial situation, investment objectives, investing time horizon, or risk tolerance. You should consider the appropriateness of this information having regard to your relevant personal circumstances before making any investment decisions. Past investment performance does not indicate or guarantee future success. Returns will vary, and all investments carry risks, including loss of principal. All participants shall be responsible for the comparison and consideration of any relevant fees, charges and costs involved before investing.
Moomoo is a financial information and trading app offered by Moomoo Technologies Inc.
In Singapore, investment products and services available through the Moomoo app are offered through Moomoo Financial Singapore Pte. Ltd. regulated by the Monetary Authority of Singapore (MAS). Moomoo Financial Singapore Pte. Ltd. is a Capital Markets Services Licence (License No. CMS101000) holder with the Exempt Financial Adviser Status. This advertisement has not been reviewed by the Monetary Authority of Singapore.
In Australia, financial products and services available through the Moomoo app are provided by Moomoo Securities Australia Ltd, an Australian Financial Services Licensee (AFSL No. 224663) regulated by the Australian Securities and Investment Commission (ASIC). Please read and understand our Financial Services Guide, Terms and Conditions, Privacy Policy and other disclosure documents which are available on our website https://www.moomoo.com/au.
In Canada, order-execution only services available through the Moomoo app are provided by Moomoo Financial Canada Inc., regulated by the Canadian Investment Regulatory Organization (CIRO).
In Malaysia, investment products and services available through the Moomoo app are offered through Moomoo Securities Malaysia Sdn. Bhd. ("Moomoo MY")regulated by the Securities Commission of Malaysia (SC). Moomoo Securities Malaysia Sdn. Bhd. is a Capital Markets Services Licence (License No. eCMSL/A0397/2024) holder. This advertisement has not been reviewed by the SC.
Moomoo Technologies Inc., Moomoo Financial Inc., Moomoo Financial Singapore Pte. Ltd., Moomoo Securities Australia Ltd, Moomoo Financial Canada Inc., and Moomoo Securities Malaysia Sdn. Bhd. are affiliated companies.
This presentation is for informational and educational use only and is not a recommendation or endorsement of any particular investment or investment strategy. Investment information provided in this content is general in nature, strictly for illustrative purposes, and may not be appropriate for all investors. Read more