Introduction to Elliott Wave Theory
01 What is the Elliott Wave Theory?
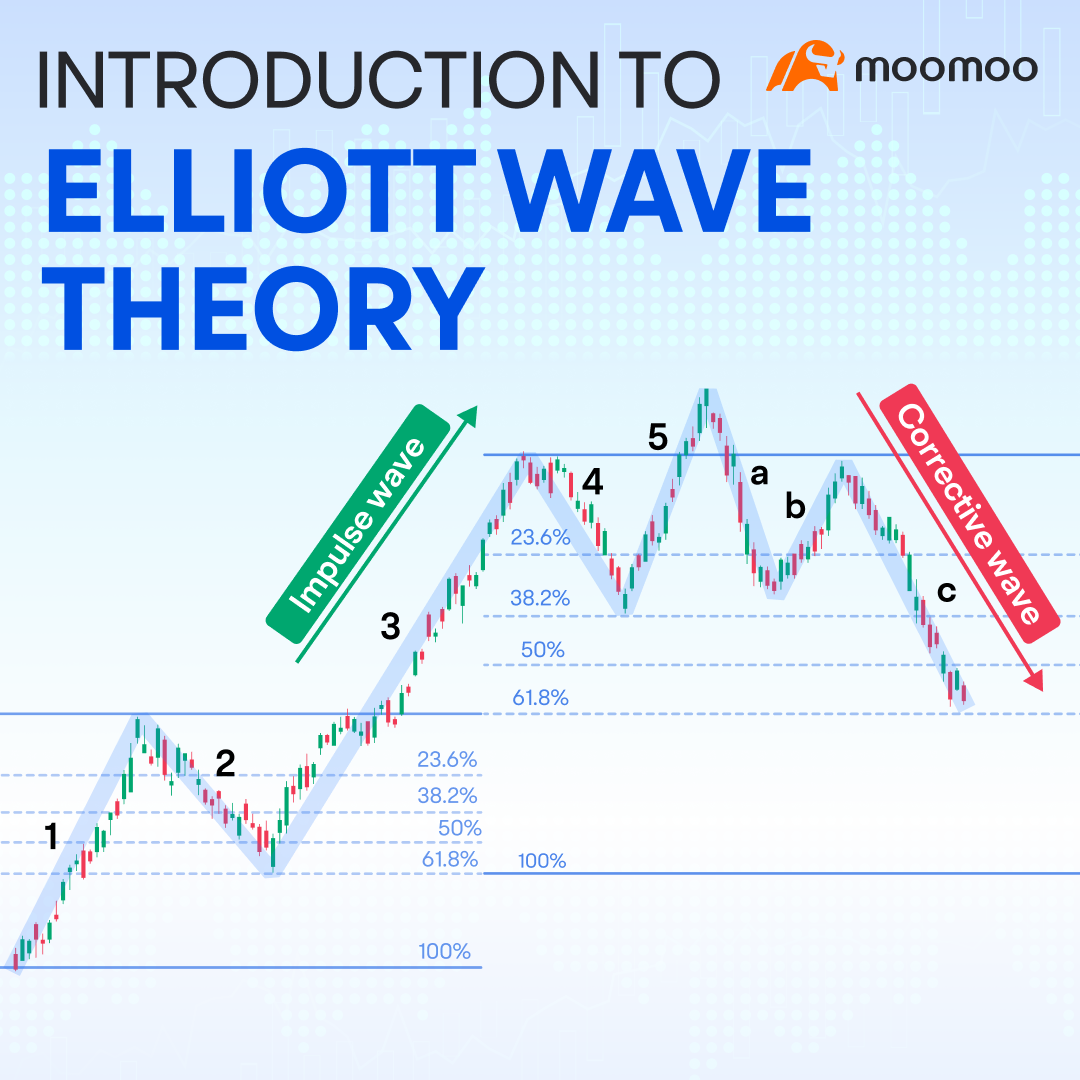
Elliott Wave Theory is a form of technical analysis developed by stock market analyst Ralph Nelson Elliott that describes a regular and repeated price movement pattern in the financial market.
The wave theory was originally applied to major stock market averages, particularly the Dow Jones Industrial Average. According to the theory, a wave represents a section of price movements from one change of direction to another, and a complete market cycle has eight waves.
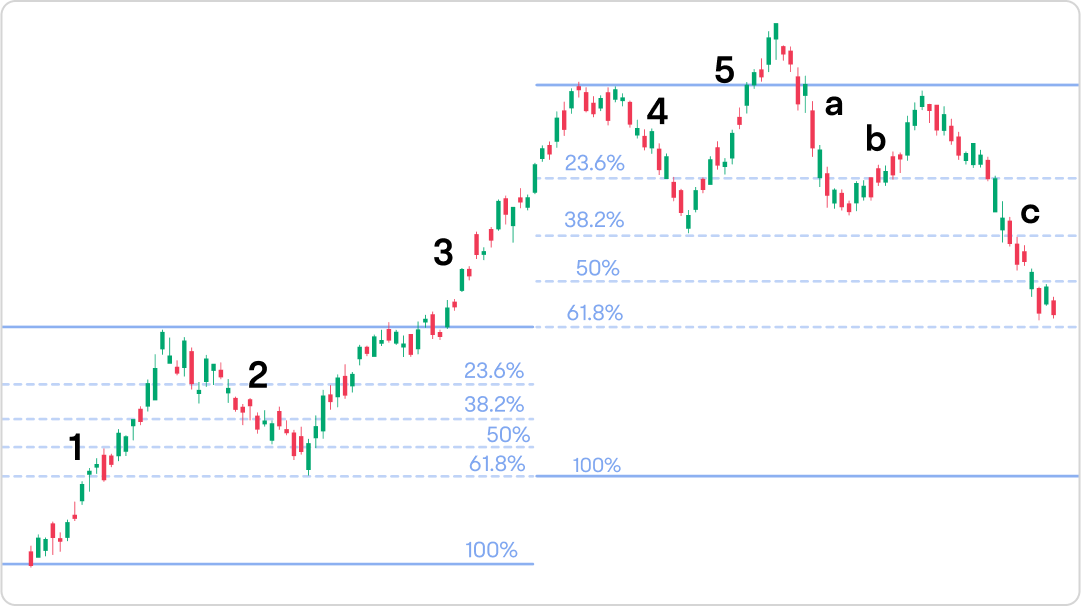
For example, in a bull market, the cycle moves in the following patterns:
1 = up, 2 = down, 3 = up, 4 = down, and 5 = up.
This five-wave pattern is called the “impulse wave,” indicating the direction of the market trend.
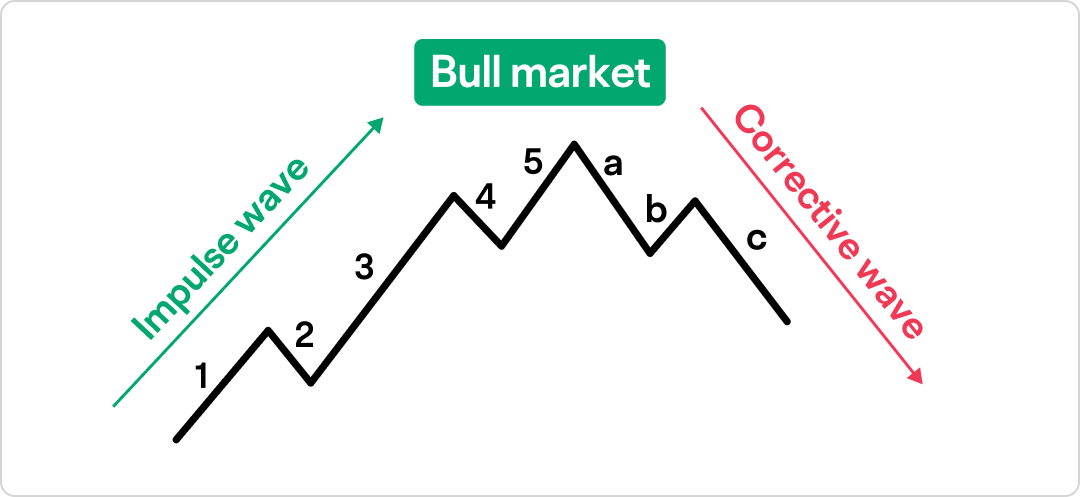
The impulse wave is followed by a “corrective wave” with three components:
a = down, b = up, and c = down.
According to Elliott, the market repeats this 5-3 wave pattern again and again, and each wave could be broken down into smaller and smaller subwaves.
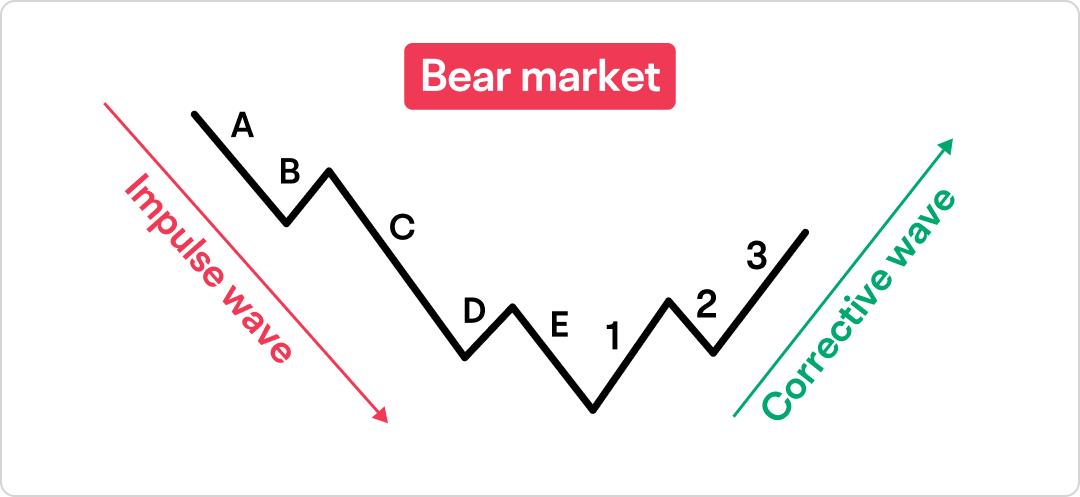
In a bear market, the 5-3 structure will be a five-wave down pattern followed by a three-wave up pattern, with the impulse waves typically labeling A through E, and the corrective waves labeling 1, 2, and 3.
02 Characteristics of each wave (in a bull market)
Wave 1 is the beginning of the impulse phase and displays an increase in price.
Wave 2 moves down, retracing a portion but not all of the gain in Wave 1. Common percentage retracements could be the Fibonacci ratios like 61.8%.
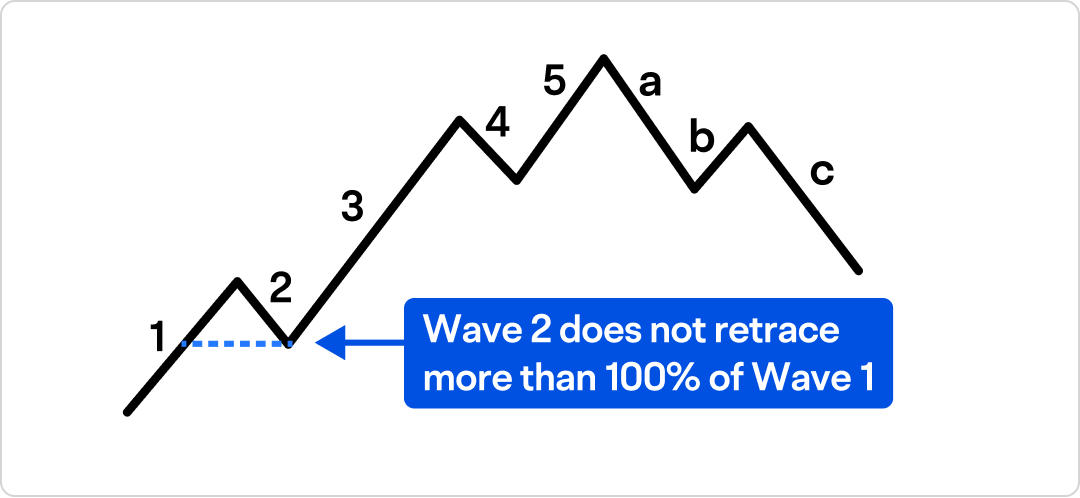
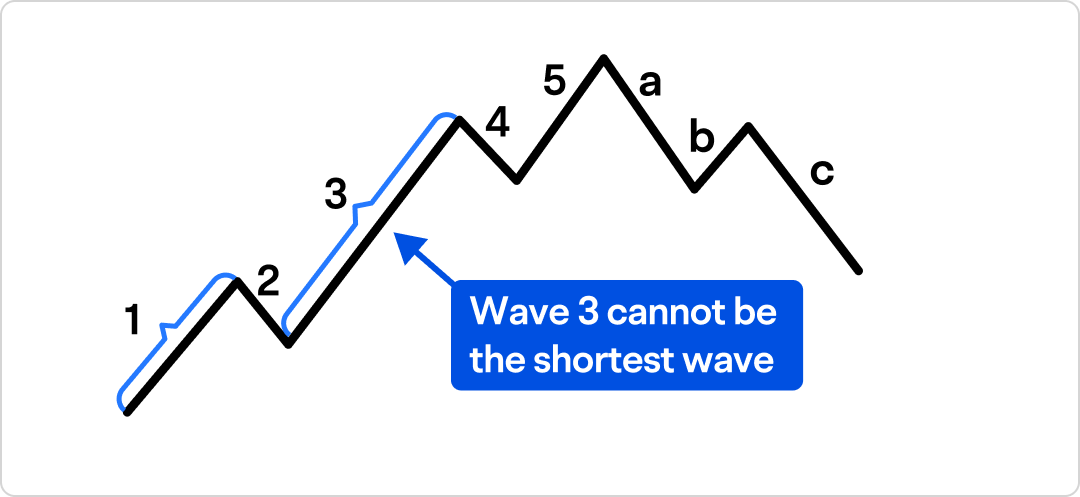
Wave 3 travels higher than Wave 1 and has strong volume and price movement. Most of the upward price movement in a market cycle typically occurs in Wave 3. Wave 3 should not be the shortest wave.
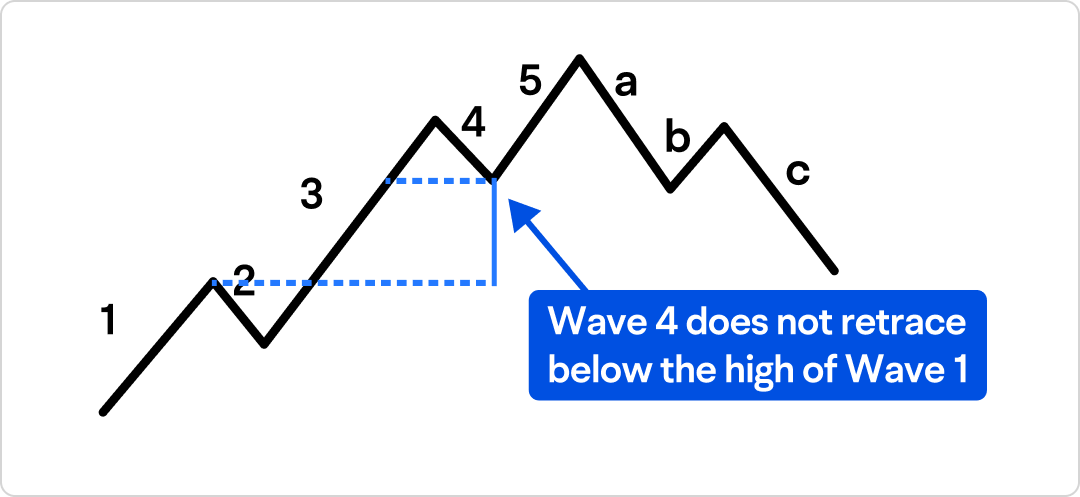
Wave 4 is also a correction. It commonly retraces 38.2% of the gain in Wave 3, which is an important Fibonacci ratio.
Wave 5 is the last impulse wave of a market cycle and is typically less significant than Wave 3. Wave 5 may become overstretched when the euphoria overtakes the market. After the completion of Wave 5, the market moves into the corrective phase.
Wave a is a down wave.
Wave b is an up wave. Wave b is a false rally and is often called a “bull trap.”
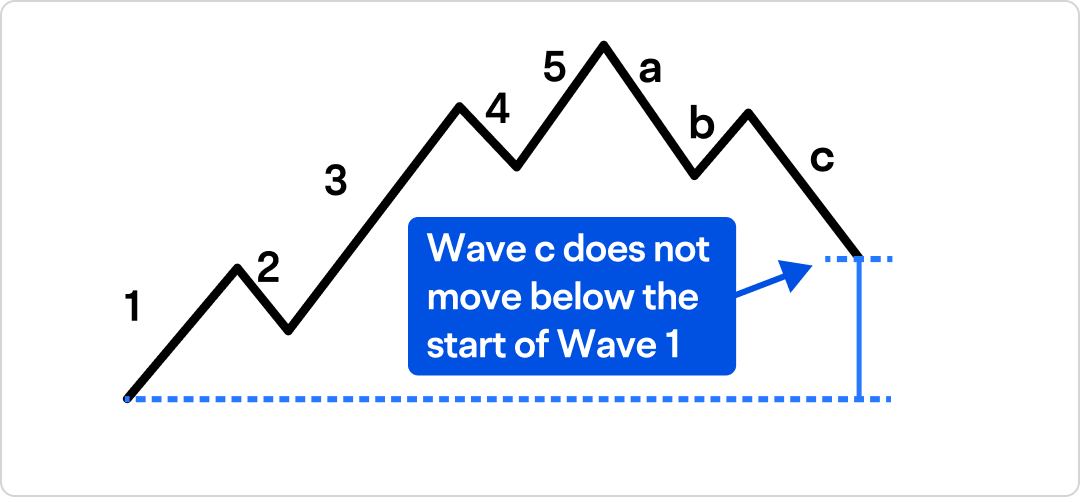
Wave c is the final corrective wave and should finish higher than the start of Wave 1.
03 What to look for?
Three important aspects of Elliott's wave theory: pattern, ratio, and time.
These aspects might help traders gain insights into market trends.
Pattern refers to the five-wave impulse move and the three-wave corrective move that comprise the most important element of the theory.
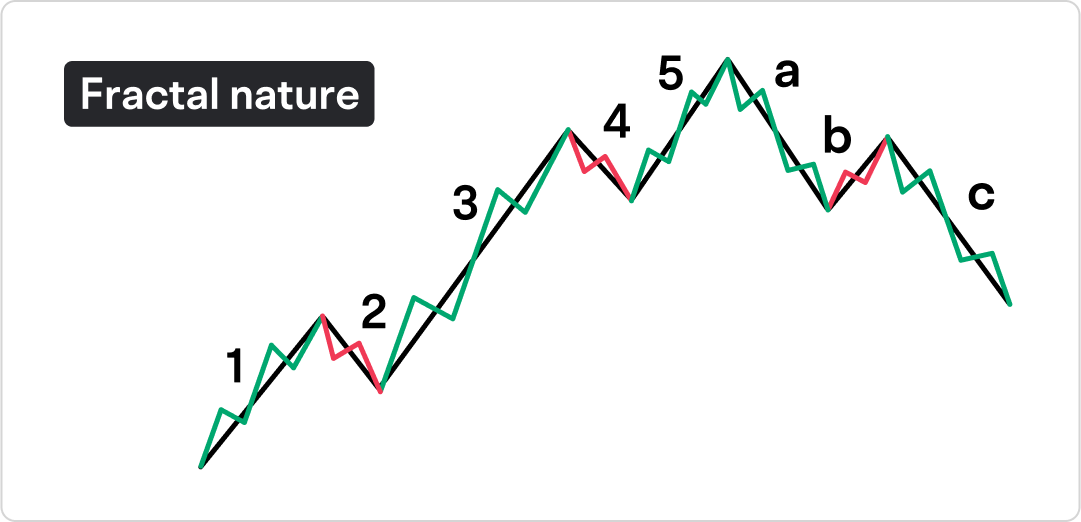
The Elliott Wave theory views market cycles as following a fractal-like wave pattern. A complete market cycle has eight waves. Each wave in the direction of the main trend consists of 5 subwaves, and counter-waves consist of 3 subwaves.
Ratio is used to help identify potential price retracement levels by measuring the relationships between the waves.
For example, in a bull market, Fibonacci ratios might be applied as follows:
Wave 2 often retraces 50% or 61.8% of the gain in Wave 1.
Wave 3 normally moves prices 161.8% higher than the peak price of Wave 1.
Wave 4 commonly reverses 23.6% or 38.2% of the gain in Wave 3.
Time, though considered to be less reliable, can be used to help estimate the potential length of certain waves. For example, on a daily chart, traders might count forward the number of days from the end of a wave with the expectation that future turning points of the wave pattern might occur on Fibonacci days, that is, on the 13th, 21st, or 34th trading day in the future.
04 Pros and cons of the theory
Pros:
The Elliott Wave Theory provides a framework for understanding market patterns and trends.
The theory is widely used in the financial market, and the wave patterns can still be observed on price charts in the modern trading environment.
It might help traders identify market cycles and forecast potential market movements.
Cons:
The theory is a subjective concept. Different traders usually identify different wave patterns, and there is no universally correct answer.
There are a great number of different rules and guidelines that can be take into consideration, adding greater complexity to the theory.
Identifying waves can be quite difficult and wave counts in practice can take a good deal of time to develop.
This presentation discusses technical analysis, other approaches, including fundamental analysis, may offer very different views. The examples provided are for illustrative purposes only and are not intended to be reflective of the results you can expect to achieve.
All investing involves risk, including the potential loss of principal, and there can be no guarantee that any investing strategy will be successful.
This presentation is for informational and educational use only and is not a recommendation or endorsement of any particular investment or investment strategy. Investment information provided in this content is general in nature, strictly for illustrative purposes, and may not be appropriate for all investors. Read more