What do overbought and oversold mean?
01 What are overbought and oversold?
“There’s no bad stock, there’s only bad price.” You've probably heard something like this in technical analysis.
This could mean when a stock is considered too expensive, a pullback can be expected and the price might decline. Conversely, when a stock is considered too cheap, a bounce can be expected and the price might advance.
In technical analysis, the terms “expensive” or “cheap” are not used to describe securities; instead, the focus is on potential market imbalances, known as overbought or oversold.
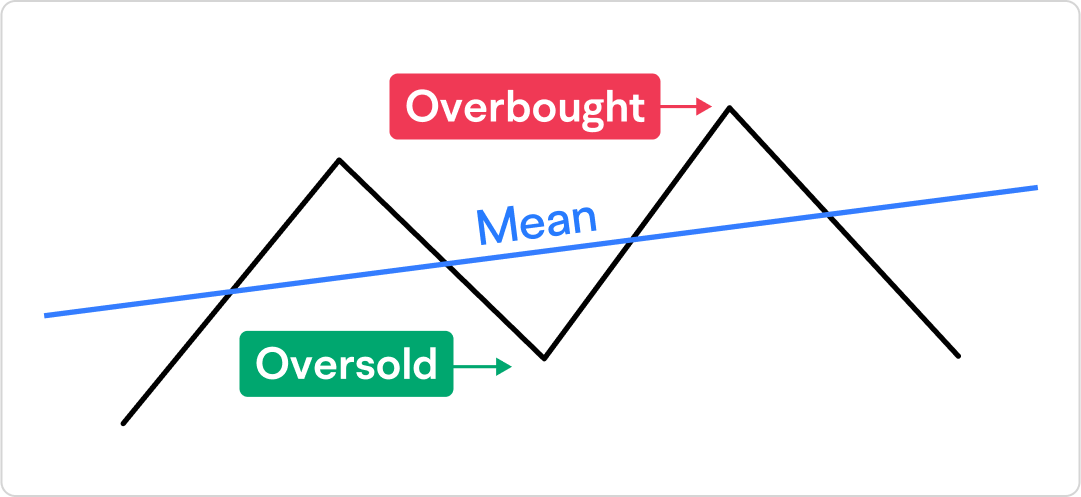
Overbought and oversold conditions refer to the state of a market or security when its price has moved too far in one direction. Overbought describes a period of time where there has been a significant and consistent upward move in price without much pullback. Oversold is just the opposite.
Many people believe that when a market is overbought, it is time to sell, and when it’s oversold, it is time to buy. However, this is not always the case.
02 How to identify overbought and oversold levels?
There are many range-bound technical indicators that can be used to potentially identify overbought and oversold levels. One of the most widely used is the relative strength index (RSI).
The RSI is a momentum-based oscillator, which measures the speed of price movements and oscillates between 0 and 100.
An RSI value above 70 traditionally represents an overbought situation, and a potential sell signal might occur when the RSI falls back below 70. Similarly, an RSI value below 30 typically indicates an oversold situation, and a potential buy signal might occur when the RSI crosses back above 30.
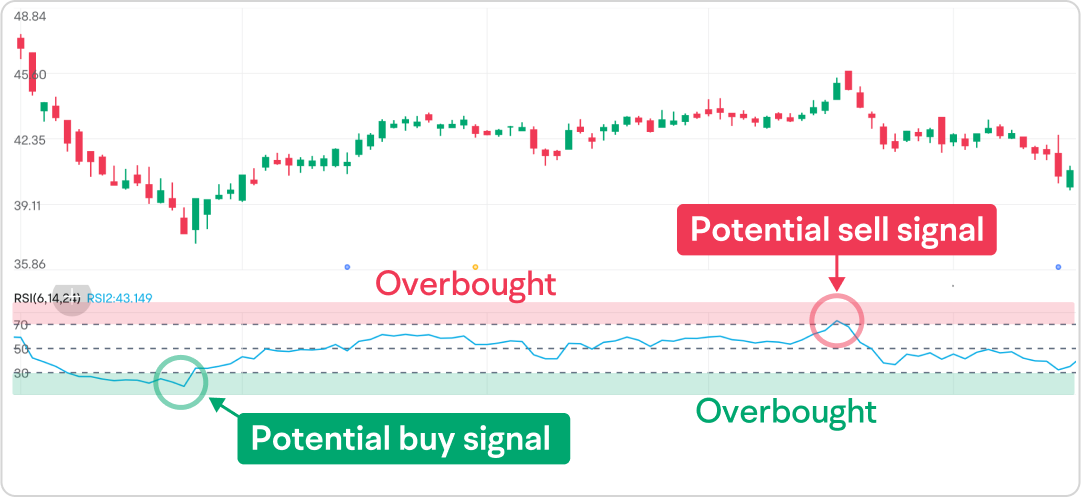
This rule may be more effective in a ranging market. In a strong trending market, however, things could be quite different because the RSI can stay overbought or oversold for extended periods of time.
Many technical traders also use support and resistance levels to help identify overbought and oversold conditions.
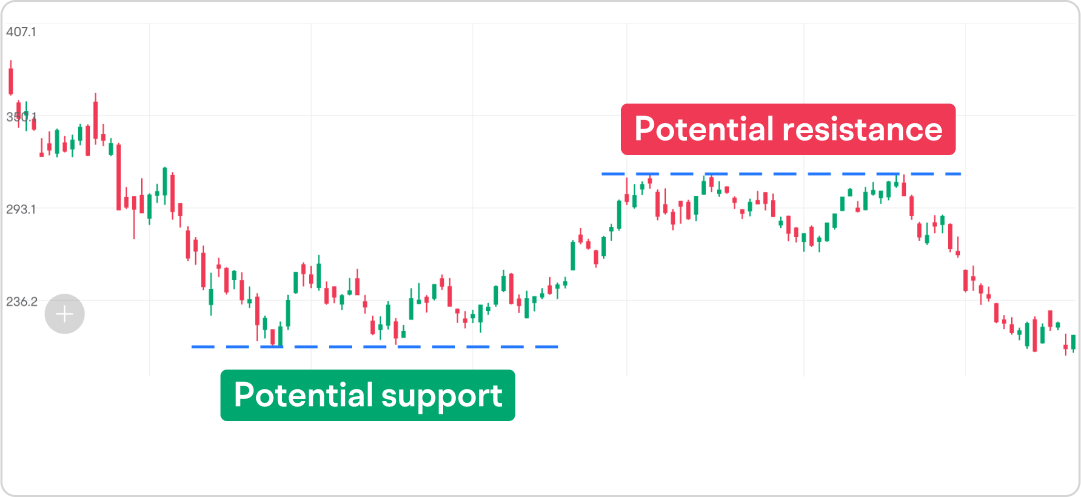
Generally, when the price reaches a potential support level, it is considered oversold, and when it reaches a potential resistance level, it is considered overbought, indicating a potential retracement or reversal.
03 Case study
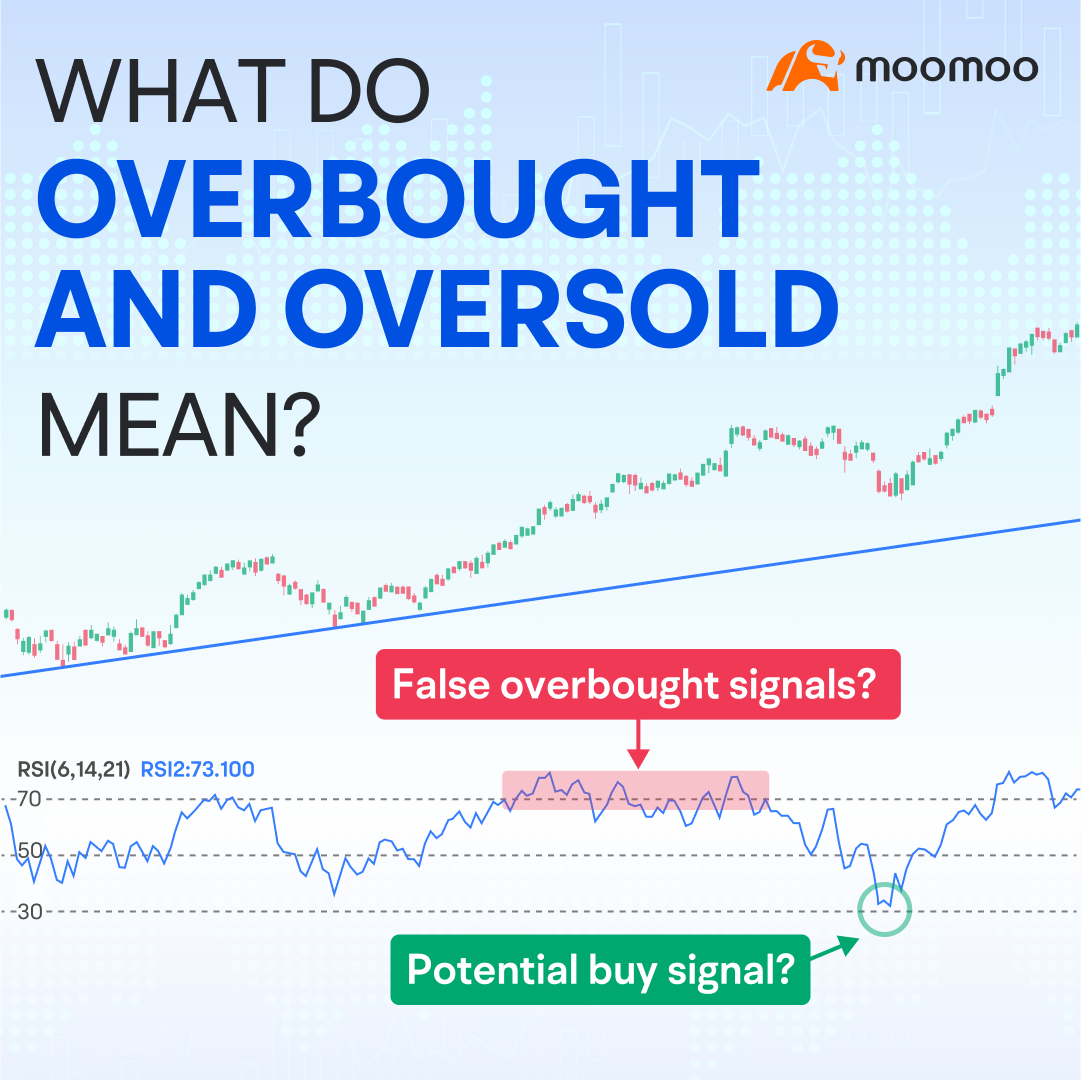
Chart 1 shows an example of an overbought stock with the 14-day RSI rising above 70. The stock is in a strong uptrend, and pullbacks are short-lived.
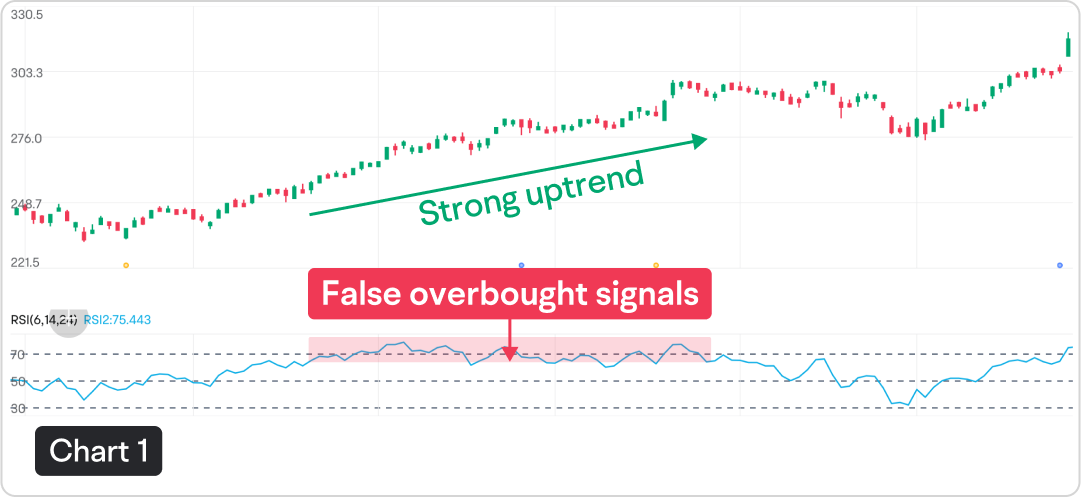
In this situation, betting on a potential price decline when the RSI crosses back below 70 could be risky because it is a counter-trend strategy against an extremely strong uptrend.
A more sound approach, however, is trend-following. This is what some traders would call “buying pullbacks in uptrends” or “selling pullbacks in downtrends.”
Chart 2 shows an example of buying a pullback in an uptrend. If the uptrend line holds, a potential buy signal could occur when the RSI drops near the 30, indicating oversold territory.
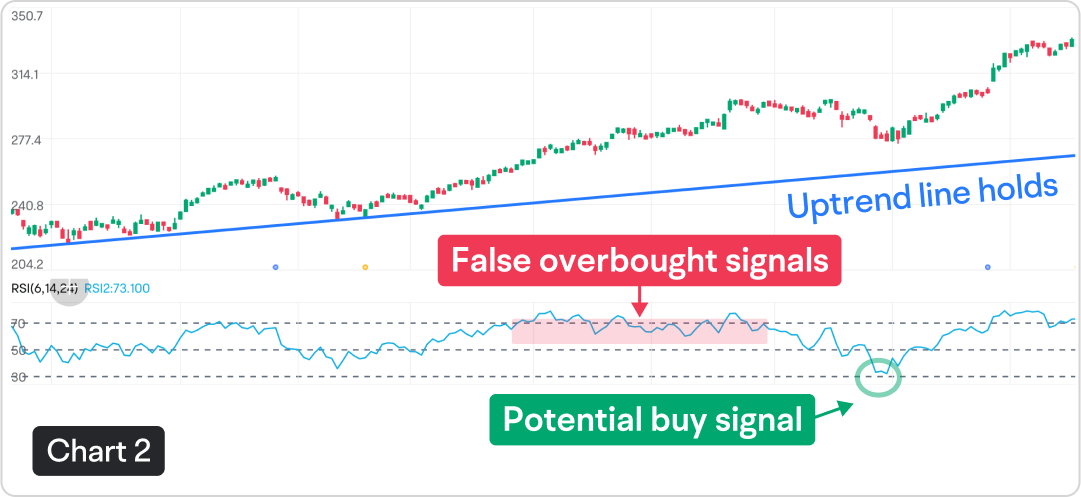
In this case, the trend line can help traders identify the potential trading direction, while the RSI indicator might provide potential trading signals.
Chart 3 shows using a support level to potentially confirm an oversold market condition and a price reversal.
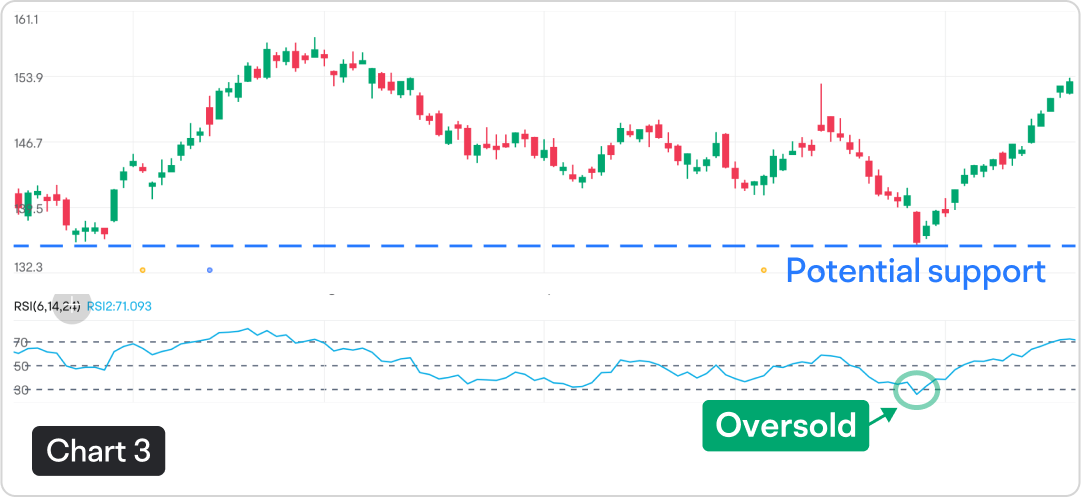
When the 14-day RSI declines below 30, the stock is considered oversold. What’s more, the market reaches a potential support level, increasing the likelihood of a potential rebound in price.
In summary, the identification of overbought or oversold conditions doesn’t automatically predict a price retracement or reversal; it merely signals that the current market trend is notably strong. Therefore, identifying overbought and oversold conditions can sometimes be part of a trend-following strategy.
This presentation discusses technical analysis, other approaches, including fundamental analysis, may offer very different views. The examples provided are for illustrative purposes only and are not intended to be reflective of the results you can expect to achieve.
All investing involves risk, including the potential loss of principal, and there can be no guarantee that any investing strategy will be successful.
This presentation is for informational and educational use only and is not a recommendation or endorsement of any particular investment or investment strategy. Investment information provided in this content is general in nature, strictly for illustrative purposes, and may not be appropriate for all investors. Read more