How to Identify a Dark Cloud Cover
Ominous clouds gathering in the sky are nature's warning signs of an approaching downpour, prompting people to take cover and stay safe.
Similarly, in the stock market, the appearance of a "dark cloud cover" candlestick pattern can act as a cautionary signal for investors, indicating a potential price decline ahead and prompting them to consider selling their holdings.
This week we’ll walk you through a bearish reversal candlestick pattern: the dark cloud cover.
What is a dark cloud cover?
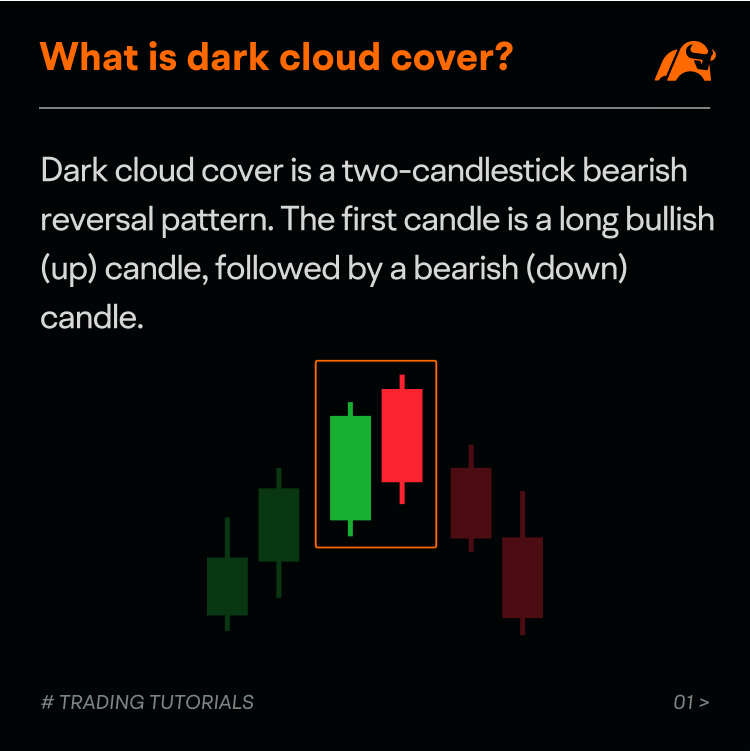
The dark cloud cover is a two-candlestick bearish reversal pattern forming after an upward trend.
The first candle is a long bullish (up) candle, followed by a bearish (down) candle. The bearish candle opens above the body of the first candle and closes below its midpoint.
Imagine a bright sunny day suddenly being overshadowed by dark clouds — that's why it's called "dark cloud cover."
When this pattern appears, it could signal that prices have reached a peak or resistance level.
How does a dark cloud cover occur?
The dark cloud cover pattern often appears during an uptrend, indicating a potential price decline.
Here's how it works:
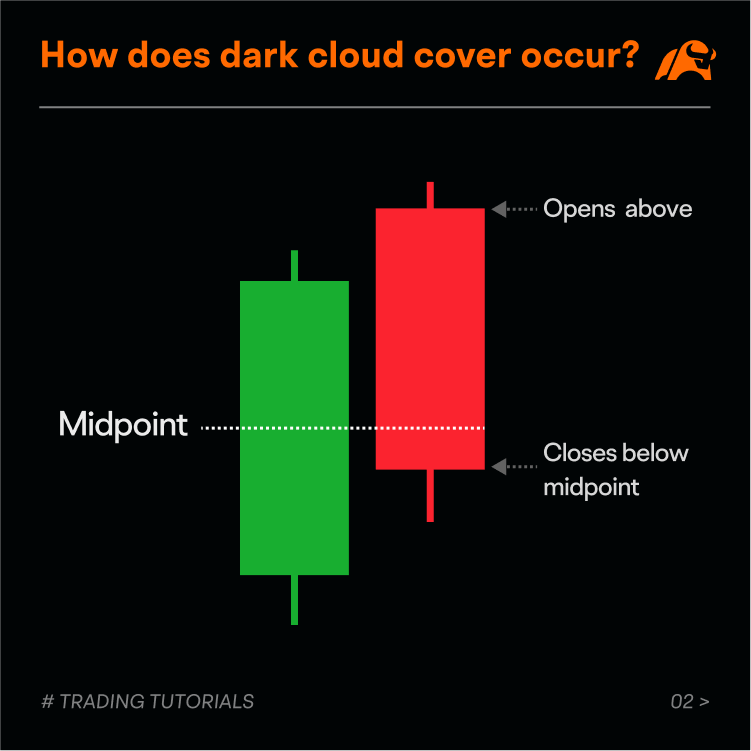
● The first candlestick is a long bullish (up) candle, showing the market's continuation of the upward trend with strong buying sentiment.
● The next day, the stock price opens with a gap up, suggesting continued optimism.
● However, as time passes, the price fails to sustain its upward movement and starts to consolidate downward.
● Finally, the closing price falls below the midpoint of the first candle's body, forming a bearish (down) candle.
This pattern indicates a weakening of upward momentum and a possible shift in control from the bulls to the bears. It could indicate that the uptrend is nearing its end and a bearish trend might follow.
It's important to note that additional technical indicators are needed to validate the trend reversal.
How to identify a dark cloud cover?
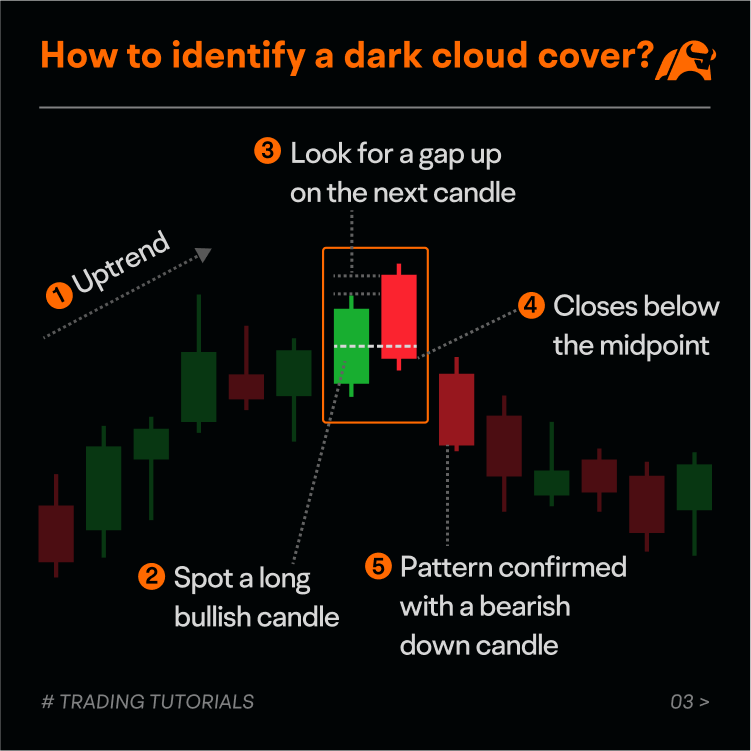
In real trading, we may recognize the dark cloud cover pattern as a reversal signal in the following steps:
1. Identify the uptrend: Look for a clear upward trend before the appearance of the pattern. This means prices have been consistently rising over a period of time.
2. Spot a long bullish candle: The first candlestick should be a bullish (up) candle with a sizable body, indicating strong positive sentiment.
3. Look for a gap up on the next candle: The second candle's opening price should be higher than the previous bullish candle's closing price, creating an upward gap. A larger gap suggests a potentially stronger reversal.
4. Wait for a bearish candle closing below the midpoint: The second candlestick's closing price must be below the midpoint of the first candle's body, forming a bearish (down) candle. The steeper the price drops, the stronger the potential reversal.
5. Validate the reversal signal: The price movement of the third candlestick may offer some confirmation. If it is a bearish (down) candle, it could indicate the start of a bearish market phase.
Case study
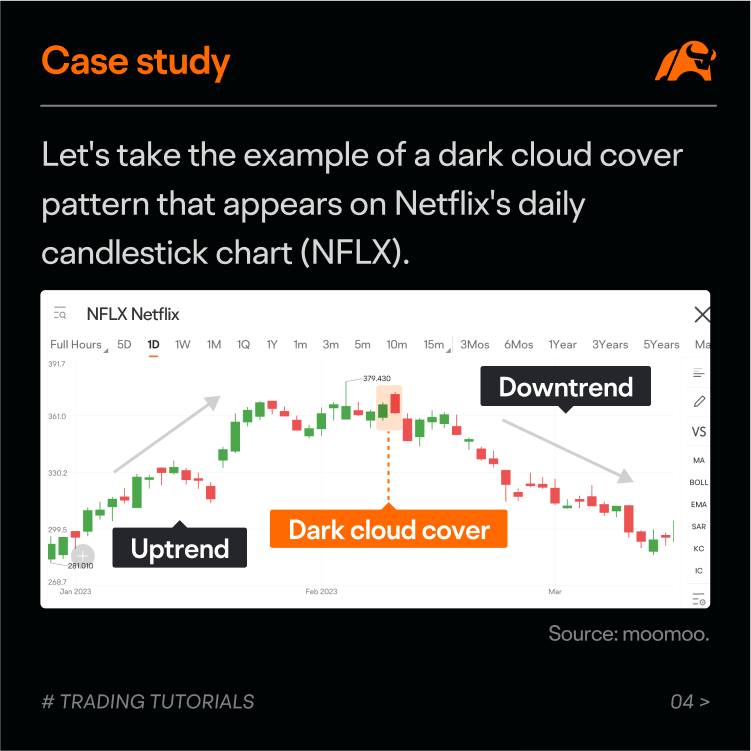
Let's take the dark cloud cover pattern that appears on Netflix's daily candlestick chart (NFLX) as an example.
On the chart, you can see that the stock price experiences a significant upward trend, indicating strong bullish sentiment in the market.
At the top of the uptrend, a dark cloud cover pattern emerges. The first candle is a large bullish candle, and the second candle is a bearish candle. The second candle opens above the previous close and closes below the midpoint of the first candle's body.
The occurrence of this pattern may indicate that the uptrend may be reversing.
To confirm the reversal signal, you can refer to the price action of the third candle. The chart shows that the third candlestick is a bearish candle, confirming that the price may go downward.
After that, the price trend reverses, and the stock price experiences a downward trend.
Summary
The dark cloud cover is a two-candlestick bullish reversal pattern forming after an uptrend.
The pattern might help traders confirm a potential exit point from a long trade.
When trading candlestick patterns, don’t forget to factor in other technical methods.
Disclaimer:
This presentation discusses technical analysis. Other approaches, including fundamental analysis, may offer very different views. The examples provided are for illustrative and educational purposes only and are not intended to be reflective of the results you can expect to achieve.
This presentation is for informational and educational use only and is not a recommendation or endorsement of any particular investment or investment strategy. Investment information provided in this content is general in nature, strictly for illustrative purposes, and may not be appropriate for all investors. Read more