How to Identify Counterattack Lines?
When two candles close at the same price but have opposite colors, a counterattack lines pattern is formed.
How to interpret this pattern?
This article will guide you through the counterattack lines candlestick pattern.
What are counterattack lines?
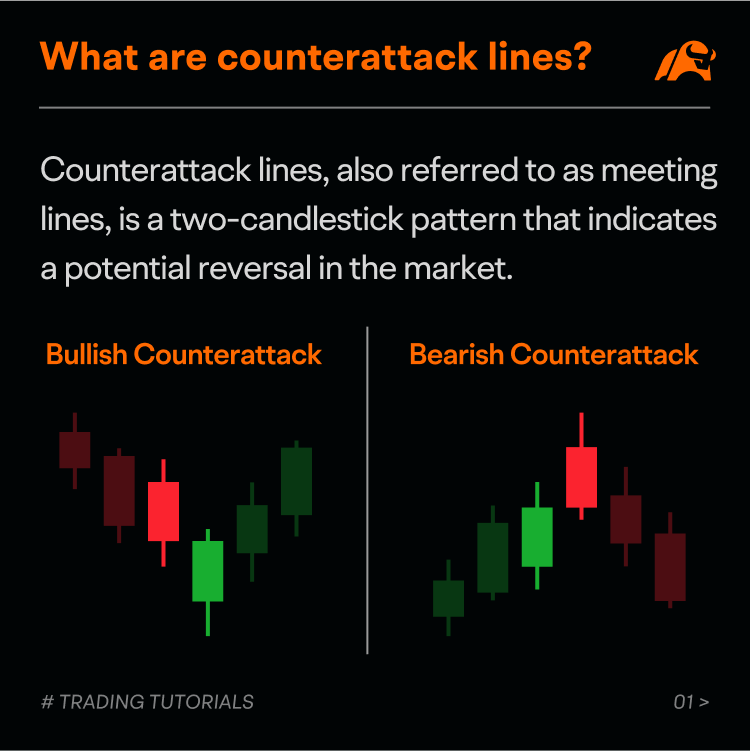
Counterattack lines, also referred to as meeting lines, is a two-candlestick pattern that indicates a potential reversal in the market.
This pattern consists of a bullish candle and a bearish candle that closes at the same price.
There are two types of counterattack lines, depending on their location and market sentiment: bullish counterattack lines and bearish counterattack lines.
Bullish counterattack lines, with the first bearish and the second bullish, signal a potential reversal from a downtrend into an uptrend.
Bearish counterattack lines, with the first bullish and the second bearish, signal a potential reversal from an uptrend into a downtrend.
How do counterattack lines occur?
Counterattack lines can occur during an uptrend or downtrend.
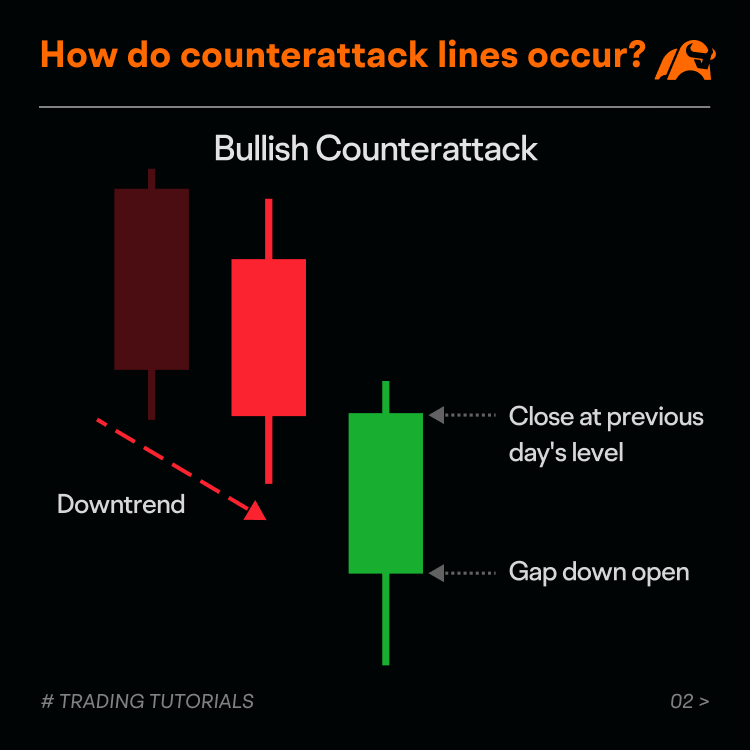
Bullish counterattack lines occur during a downtrend. The first candle of this pattern is a long bearish candle (red), indicating that the bears are in control. The second candle opens lower with a gap but then rises steadily, eventually closing at the same level as the previous day's closing price, forming a long bullish candle (green).
This likely indicates that the bulls regain control on the second day, and there is no significant selling pressure.
Bearish counterattack lines have the opposite characteristics. They appear during an uptrend. The first candle of this pattern is a long bullish candle, and the second candle is a long bearish one. The second candle opens higher with a gap, reaches a new high, then falls steadily, and finally closes near the previous day's closing price.
This likely indicates that the bulls have lost their dominance to the bears.
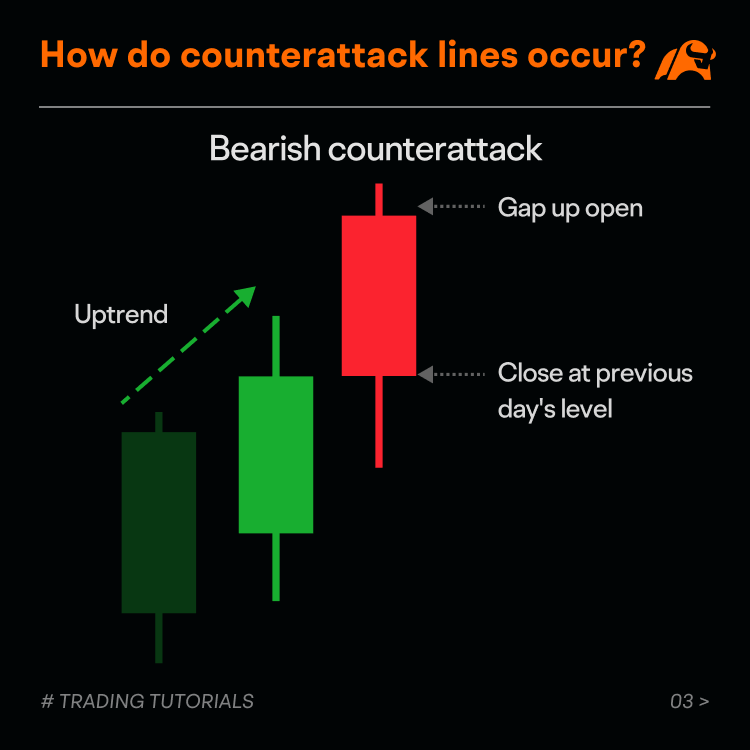
Both patterns have a similar feature: a gap opening in the trend direction at the start of the second candle, followed by a strong move in the opposite direction that closes the gap.
This suggests that there may be a trend reversal as either the bulls or bears are losing control.
However, confirmation is needed to determine the signal.
How to identify counterattack lines?
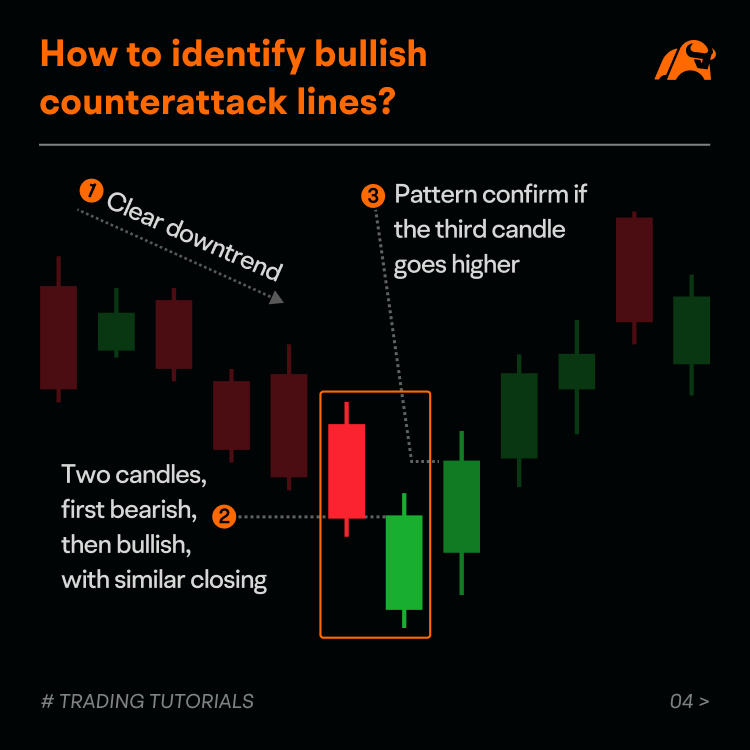
The bullish counterattack lines pattern has the following characteristics:
1. Clear downtrend: There must be a strong downtrend in the market for the formation of the bullish counterattack pattern.
2. The first bearish candle and the second bullish candle have a similar closing price: the first candle is bearish and has a long body with little or no upper shadow. The second candle must be bullish with a long body (ideally, it is similar in size to the first candle). Additionally, the second candle must close near the first candle's closing price.
3. The pattern is confirmed if the third candle goes higher: To confirm the pattern's reversal signal, you can observe the price action of the third candle. For instance, after a bullish reversal, the price is expected to rise.
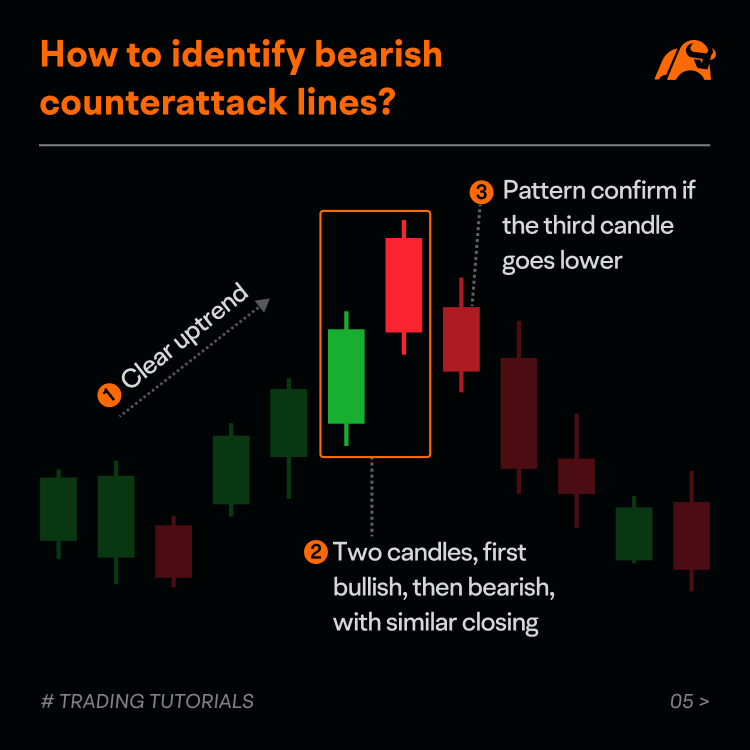
Now let's look at the characteristics of bearish counterattack lines:
1. Clear uptrend: There must be a strong uptrend in the market for the formation of the bearish counterattack pattern.
2. The first bullish candle and the second bearish candle have a similar closing price: The first candle is bullish and has a long body with little or no upper shadow. The second candle must be bearish with a long body (ideally, it is similar in size to the first one). Additionally, the second candle must close near the first candle's closing price.
3. The pattern is confirmed if the third candle goes lower: To confirm the pattern's reversal signal, you can look at the price action of the third candle. For instance, after a bearish reversal, the price is expected to fall.
Case study
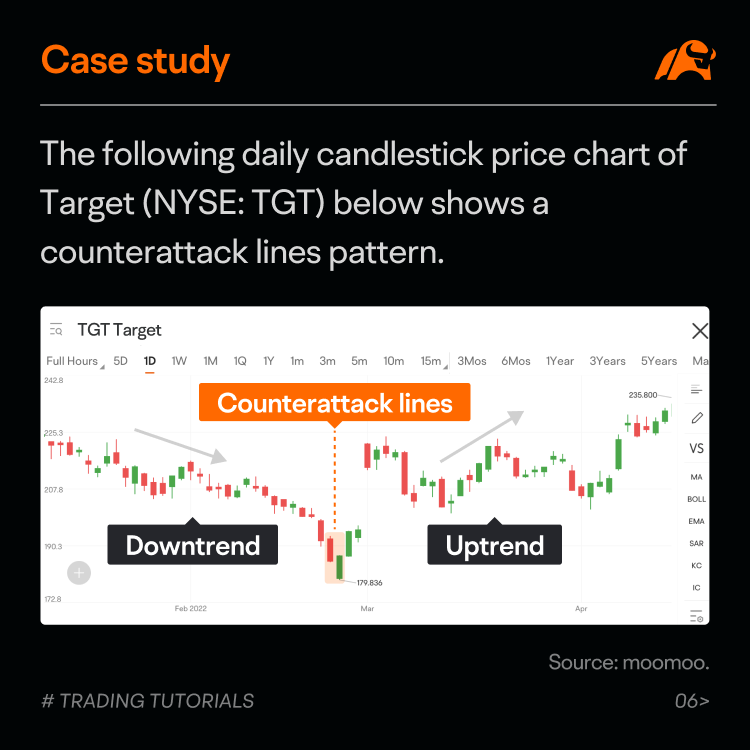
The following daily candlestick price chart of Target (NYSE: TGT) below shows a counterattack lines pattern.
On the chart, we can see a strong downtrend, indicating a significant selling sentiment.
However, a bullish counterattack lines pattern emerged at the bottom. It had a long bearish candle followed by a bullish candle with a real body similar to the first candle in size, and both candles had similar closing prices. This pattern suggested a potential trend reversal.
To confirm the signal, a trader could observe the price action of the third candle. In this case, the price increased on the third day, providing confirmation of a bullish reversal. The stock price reversed its trend and increased afterward.
Summary
The counterattack lines pattern is relatively uncommon to identify on candlestick charts.
However, the pattern will not always work, and sometimes it may fail.
When it does appear, traders should consider combining this pattern with other types of technical analysis to help confirm trends and identify potential opportunities.
Disclaimer:
This presentation discusses technical analysis. Other approaches, including fundamental analysis, may offer very different views. The examples provided are for illustrative and educational purposes only and are not intended to be reflective of the results you can expect to achieve.
This presentation is for informational and educational use only and is not a recommendation or endorsement of any particular investment or investment strategy. Investment information provided in this content is general in nature, strictly for illustrative purposes, and may not be appropriate for all investors. Read more