How to Identify a Morning Star?

The term "Morning Star" is commonly used to refer to the planet Venus when it appears in the eastern sky before sunrise. This occurrence signals the end of the night and the beginning of a new day, which is why it has been given this name.
In technical analysis, a morning star pattern often appears in a market bottom, suggesting a potential trend reversal from bearish to bullish.
This week we’ll walk you through the morning star candlestick pattern.
What is a morning star?
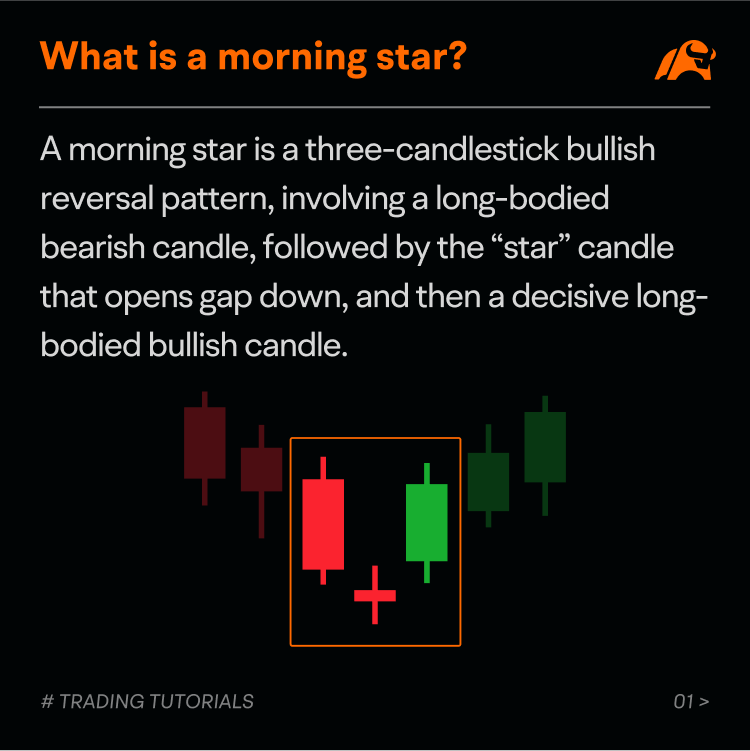
A morning star is a three-candlestick bullish reversal pattern formed after a downward trend.
The pattern involves a long-bodied bearish candle, followed by the “star” candle that opens gap down, and then a decisive long-bodied bullish candle.
The last candle opens gap up and closes above the midpoint of the first candle’s body, suggesting a bullish trading bias, which might result in a potential trend reversal from bearish to bullish.
How does a morning star occur?
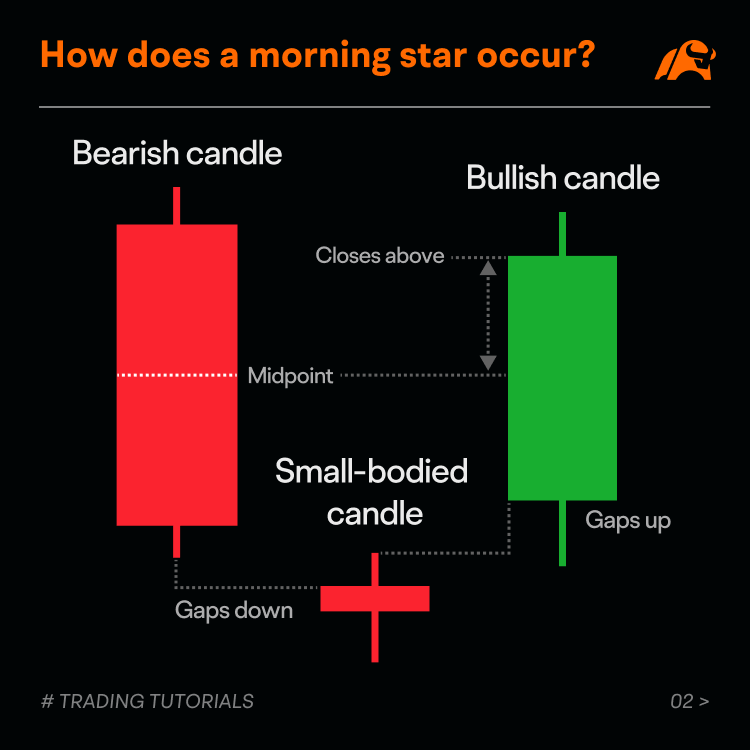
A morning star typically occurs at the bottom of a downtrend, where the price has been moving lower.
The first candle of the pattern shows a strong bearish sentiment in the market, suggesting the price might dip further.
The second candle opens gap down and dips even lower, showing a continuation of bearish sentiment in the early session.
As the session progresses, however, the bulls start to accumulate and the bears hesitate. At the end of the session, the price closes just above or below the opening price, suggesting indecisiveness in the market.
The third decisive candle opens gap up and closes above the midpoint of the first candle’s body. This suggests the bulls are able to take over the market and a potential trend reversal might occur.
How to identify a morning star?
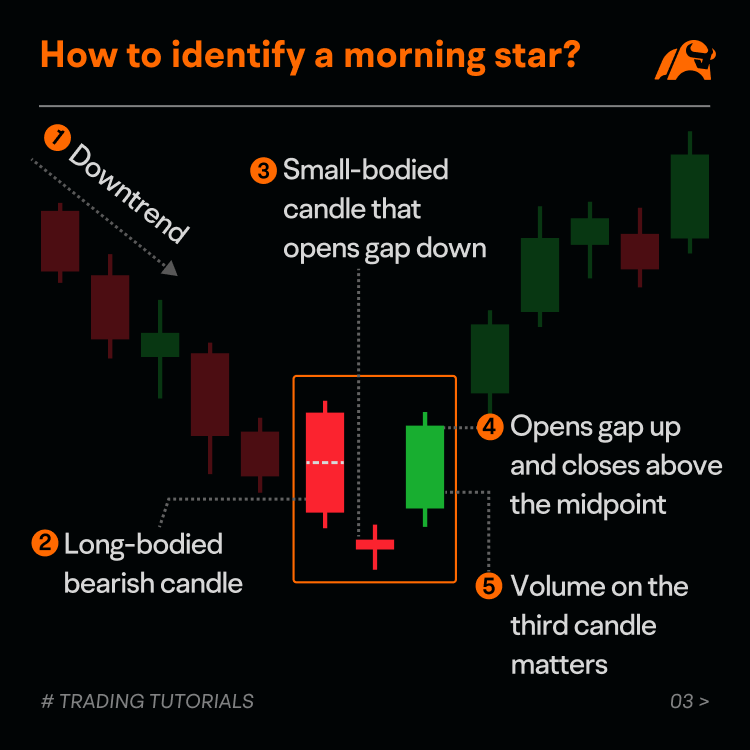
To potentially identify a morning star pattern, traders might consider some characteristics.
● Downtrend
The first step is to look for a downtrend, where a market bottom might occur.
● The first candle
The pattern’s first candle should be a long-bodied bearish candle, which continues the prior downtrend.
● The second candle
The second candle should be a small-bodied candle, either bearish or bullish, and open gap down. It is worth noting that the pattern’s low is typically seen on the second candle.
● The third candle
The third candle should be a long-bodied bullish candle with a gap up and the closing price above 50% of the first candle’s body.
● Volume
The high volume on the third candle is often considered a confirmation of the pattern.
Case study
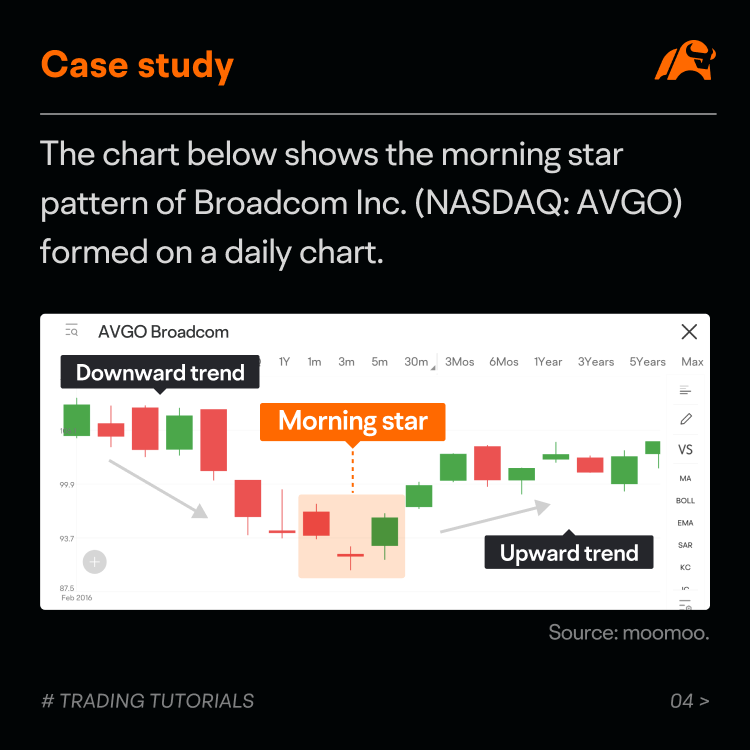
The chart below shows the morning star pattern of Broadcom Inc. (NASDAQ: AVGO) formed on a daily chart.
The stock had been moving down before the morning star showed up.
The first candle of the pattern continued the downward price movement.
The second candle of the pattern, the “star”, showed indecisiveness in the market with a small movement in price.
The last candle of the pattern opened above the previous high and rose significantly higher, indicating a potential bullish trading bias in the coming days.
Summary
The morning star is a three-candlestick bullish reversal pattern formed in a market bottom.
The pattern might help traders spot a potential entry point for a long trade, although an ideal morning star pattern may not always occur.
When trading candlestick patterns, it is important to factor in other technical methods.
This presentation is for informational and educational use only and is not a recommendation or endorsement of any particular investment or investment strategy. Investment information provided in this content is general in nature, strictly for illustrative purposes, and may not be appropriate for all investors. Read more