How to Identify an Engulfing Pattern
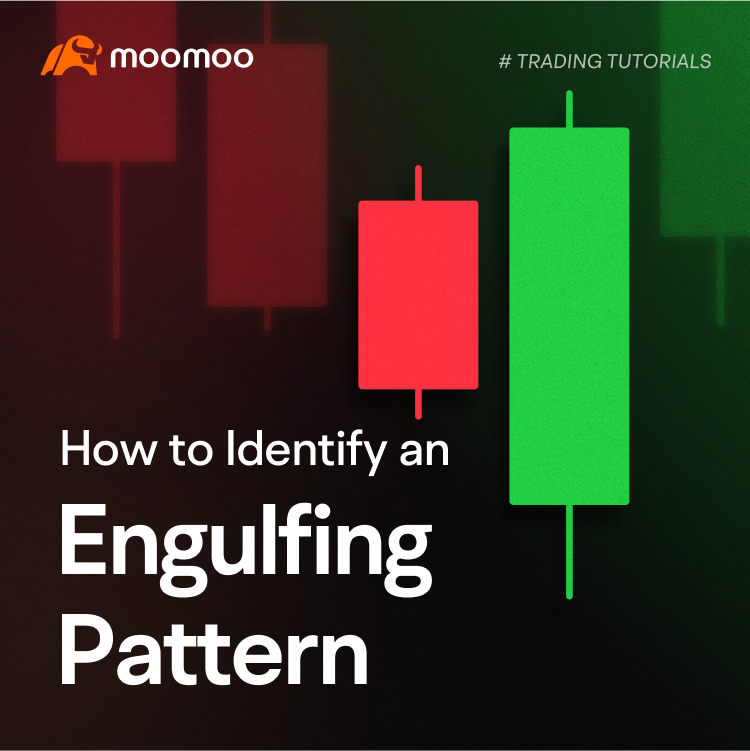
Traders might argue that a large bullish candle suggests bullish sentiment in the market, while a large bearish candle indicates a bearish trading bias.
However, context matters. When forecasting potential market trends, traders often take candlestick patterns as a starting point and factor in other methods.
This week we’ll walk you through a classic two-candlestick pattern: the engulfing pattern.
What is an engulfing pattern?
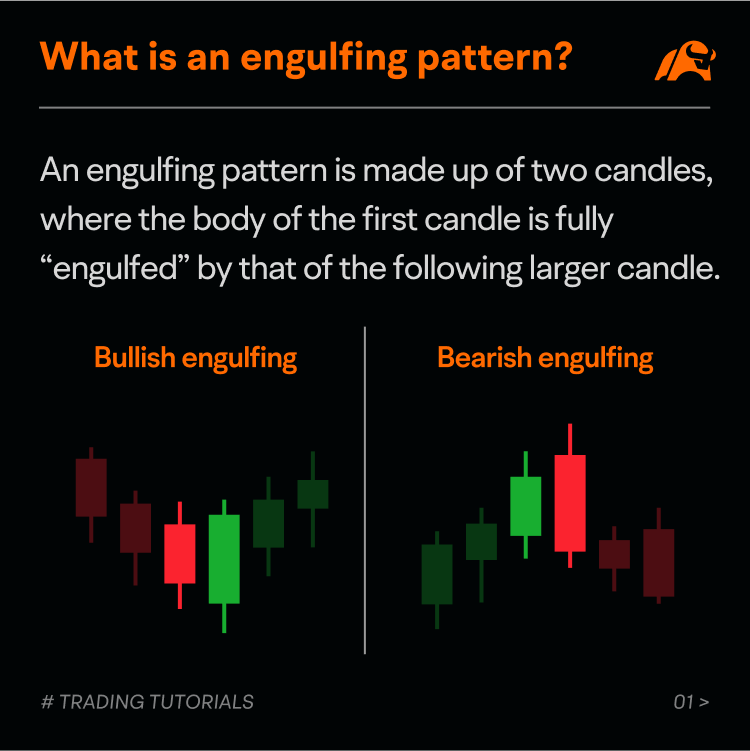
An engulfing pattern is made up of two candles, where the body of the first candle is fully “engulfed” by that of the following larger candle.
There are two types of engulfing patterns: bullish engulfing and bearish engulfing. They’re opposite to each other.
For a bullish engulfing pattern, the first candle is bearish while the second is bullish. It is considered a bullish reversal pattern, especially when forming at a market bottom.
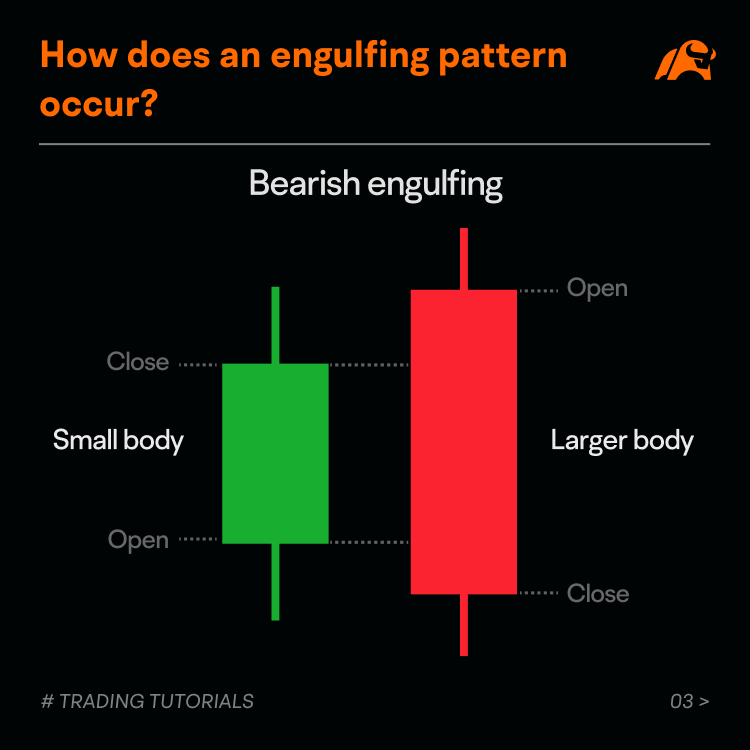
Conversely, a bearish engulfing pattern shows a bullish candle is engulfed by the following larger bearish ones, indicating a potential price downward move.
How does an engulfing pattern occur?
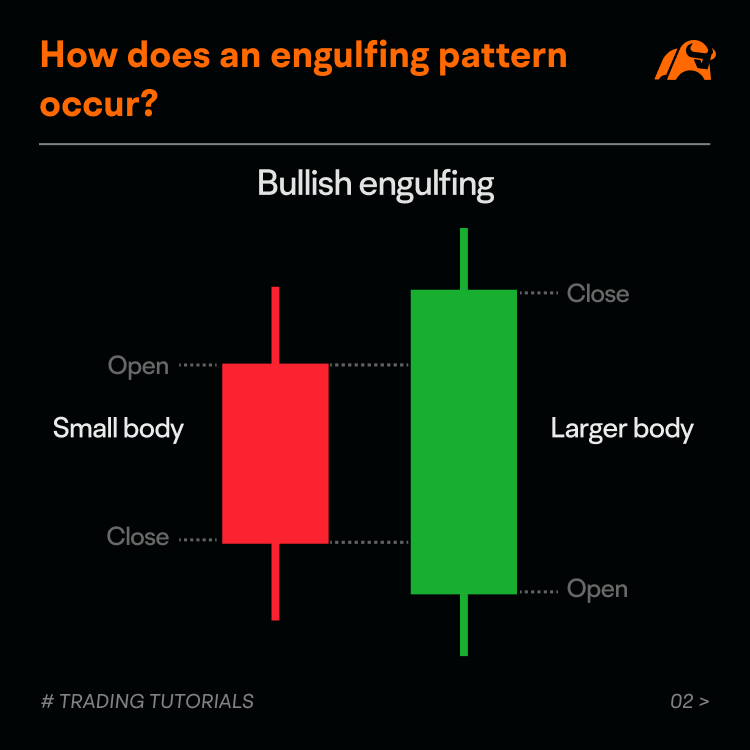
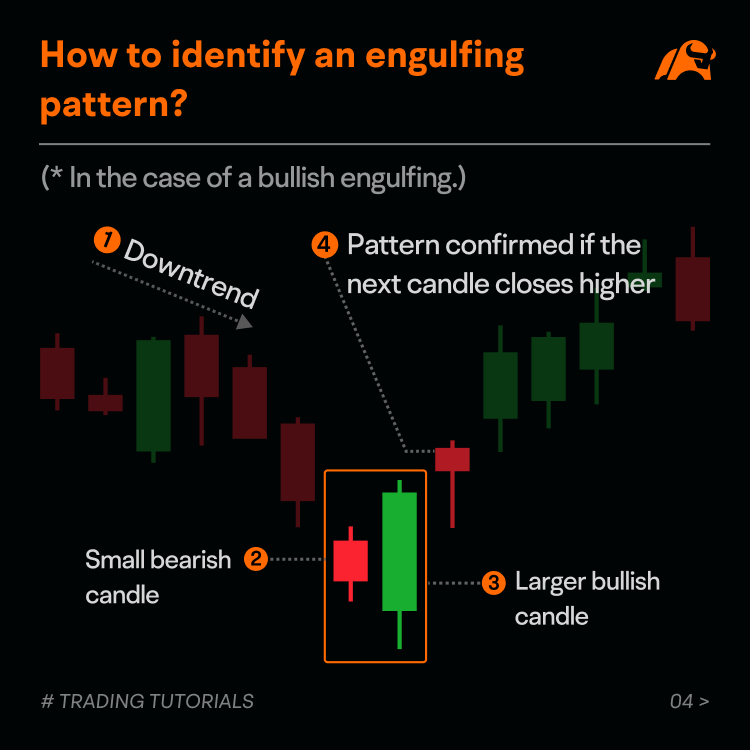
A bullish engulfing pattern is usually found after a downward trend.
The first candle shows some bearish sentiment in the market following the downward price action.
The second candle opens lower than the previous close, but it closes higher than the previous open.
This suggests the bulls can absorb selling pressure on the day and a bullish reversal might be on the horizon.
While the shadows of each candle do not matter, the second candle typically has a short upper shadow, indicating some upward momentum in price when closing.
The bullish signal might be confirmed if the next candle following the pattern closes higher.
On the contrary, a bearish engulfing pattern is usually found at a market top.
How to identify an engulfing pattern?
Traders might consider the following characteristics when trying to identify an engulfing pattern.
● Price action
A bullish engulfing pattern is usually found at a market bottom, while a bearish engulfing is at the top.
● The first candle
For a bullish engulfing, the first candle should be bearish. For a bearish engulfing, the first candle should be bullish.
● The second candle
The second candle should be different in color from the first one, and it should have a larger body that completely covers the first candle’s body.
● Confirmation
A bullish signal could be confirmed if the candle after the bullish engulfing closes higher. Similarly, a bearish signal could be confirmed if the candle after the bearish engulfing closes lower.
Case study
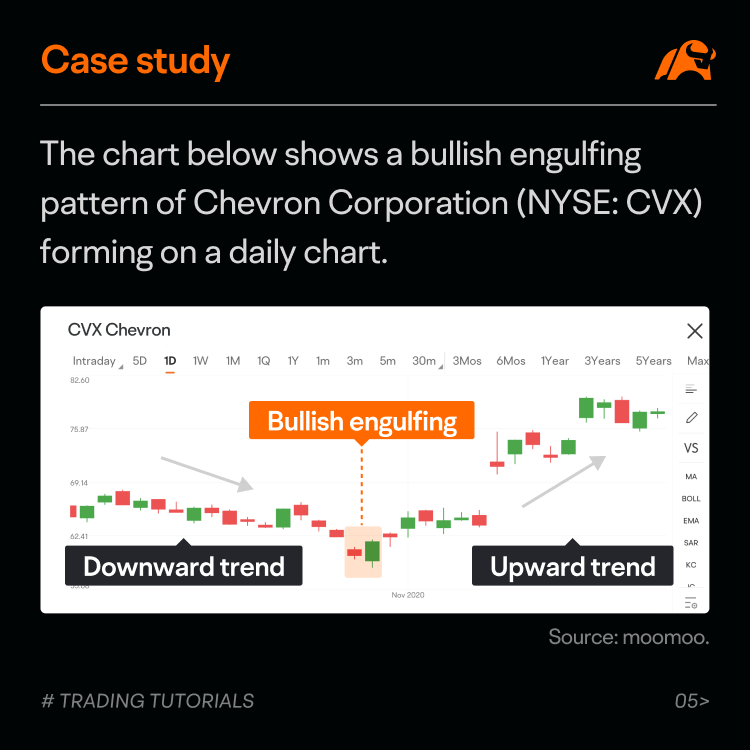
The chart below shows a bullish engulfing pattern of Chevron Corporation (NYSE: CVX) forming on a daily chart.
As you can see, the bullish engulfing pattern showed up at a market bottom, where the price had declined for consecutive days.
The first candle of the pattern, a small bearish one, indicated the continuation of selling pressure in the market, pushing the price to close lower.
The second candle, a much larger bullish one, opened lower than its previous close but closed well above its previous open. It suggested a reversal of market sentiment from bearish to bullish.
On the next day following the engulfing pattern, the price closed higher, helping to confirm the potential bullish signal.
Summary
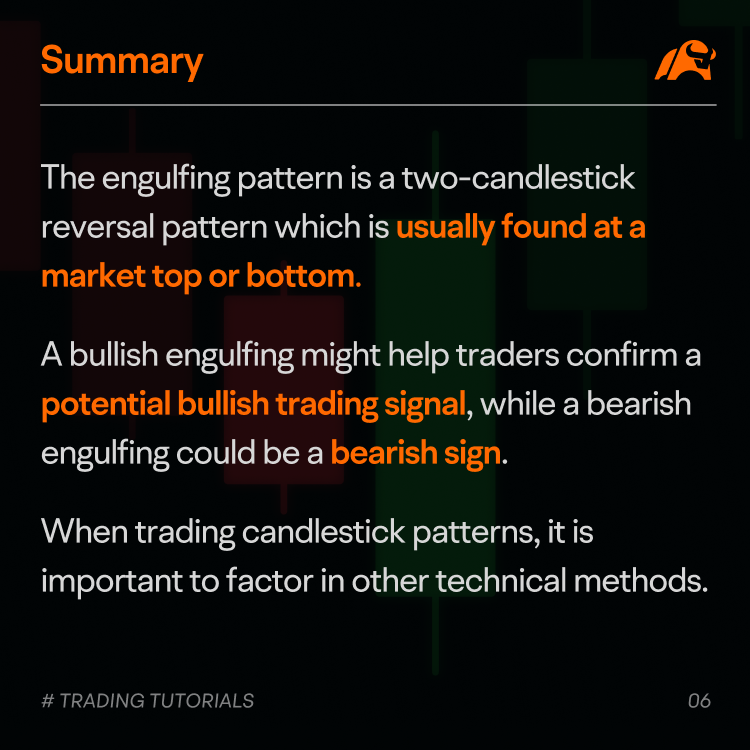
The engulfing pattern is a two-candlestick reversal pattern which is usually found at a market top or bottom.
A bullish engulfing might help traders confirm a potential bullish trading signal, while a bearish engulfing could be a bearish sign.
When trading candlestick patterns, it is important to factor in other technical methods.
This presentation is for informational and educational use only and is not a recommendation or endorsement of any particular investment or investment strategy. Investment information provided in this content is general in nature, strictly for illustrative purposes, and may not be appropriate for all investors. Read more