How to Identify a Spinning Top

The spinning top is one of the most common candlestick patterns.
It can be identified in an uptrend, a downtrend, and even in a sideways market.
So how to interpret this pattern?
In this article, we will walk you through the spinning top candlestick pattern.

What is a spinning top?
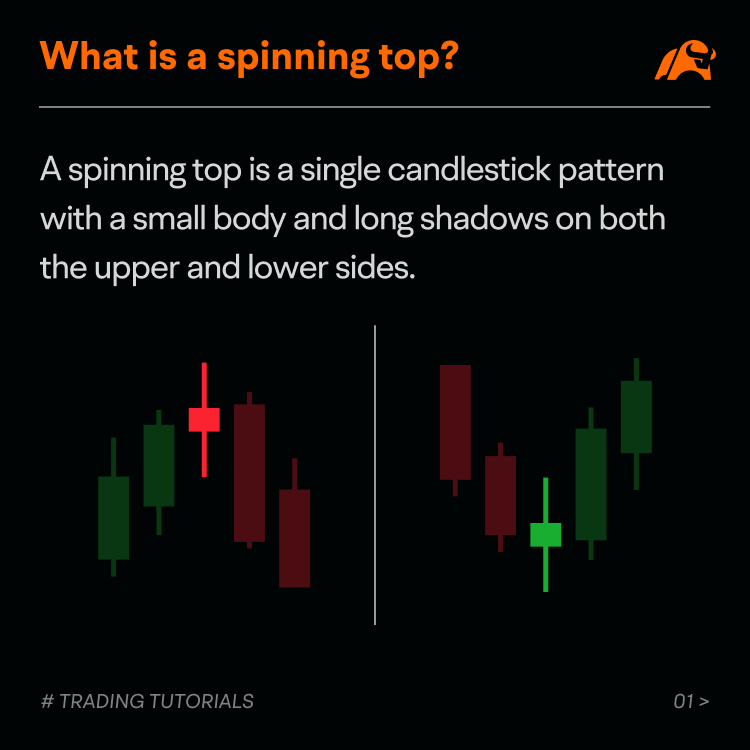
A spinning top is a single candlestick pattern with a small body and long shadows on both the upper and lower sides.
The pattern is considered a neutral pattern as it signals indecision and uncertainty about the asset's future trend.
Some experienced traders may use this candle to help evaluate the probability of a price reversal, especially if it happens in an uptrend or a downtrend.
The spinning top can be either bullish or bearish at the candle close.
How does a spinning top occur?
For investors, it is important to understand the psychology behind a single candlestick.
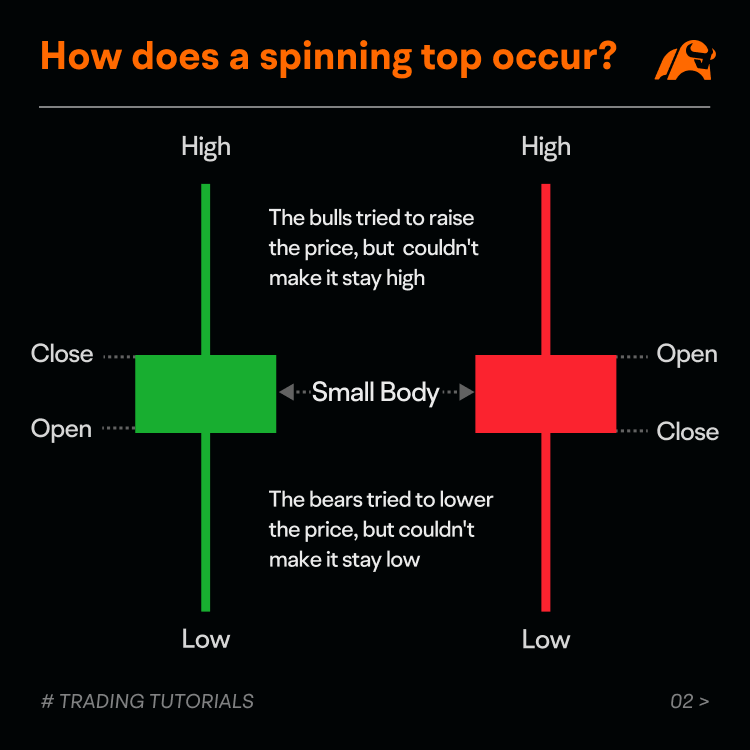
A spinning top indicates a situation where the market is undecided, with neither the bulls nor the bears in control.
A spinning top with extended upper and lower shadows implies that both buyers and sellers attempted to push the price higher and lower, but ultimately failed to establish dominance. In the end, the price closed near where it opened, creating a small body.
This indecision can signal more sideways movements if the spinning top occurs during a period of consolidation.
A spinning top can also appear in both uptrends and downtrends.
If a spinning top occurs at the potential top of an uptrend, it could be a sign that bulls are losing control, and the bullish trend may reverse. Similarly, a spinning top appearing at the base of a downtrend could signal that bears are losing control, and the bearish trend may reverse.
However, further confirmation is needed to help determine which potential outcome the signal may be indicating.
Identify a spinning top in an uptrend
A spinning top is easy to identify in charts, and sometimes it is used by traders to locate a possible trend reversal.
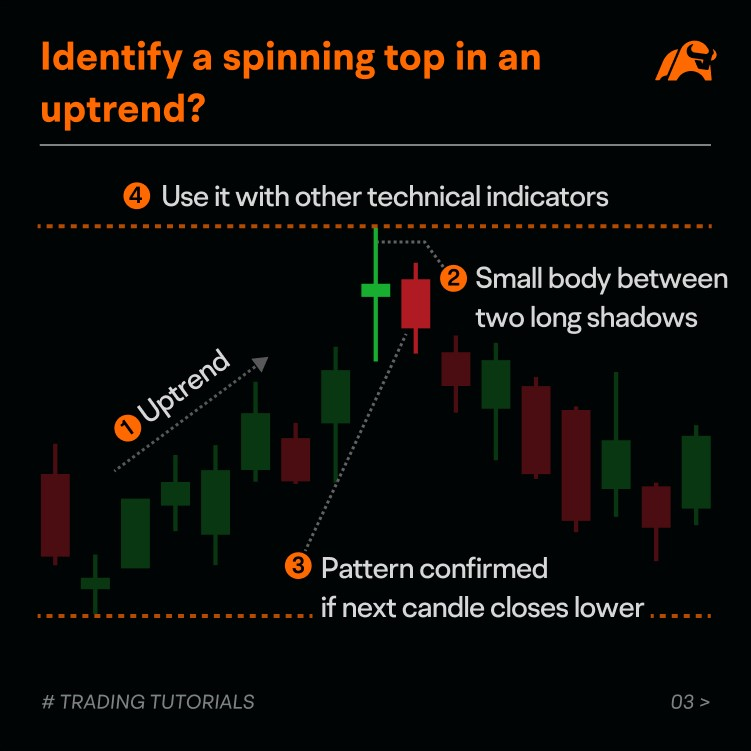
The following features may help you identify a spinning top in an uptrend (downtrends are similar).
Spot an uptrend
A spinning top can occur after a sharp price advance. So there should be a clear uptrend before the pattern occurs. An uptrend means the price makes higher highs over a period of time.
The small body between two long shadows
Look for a single candlestick with a short body between two long shadows at the potential top of the uptrend. The color of the body is not important. It can either be a bullish or bearish candle.
Pattern confirmed if next candle goes lower
A confirmation from the next candle is key to determining whether the uptrend may be reversing itself. In general, the candle that follows the spinning top should be bearish. If it isn't, the reversal is not confirmed, and the trader will need to wait for another signal.
Use it with other technical indicators
It is worth noting that the spinning top is a common candlestick pattern and by itself is not a reliable indicator of a potential trend reversal. So it is better to use it in concert with other technical indicators.
For example, a spinning top candle could be more effective at key price levels of support and resistance. More details will be explained in the case study below.
Case study
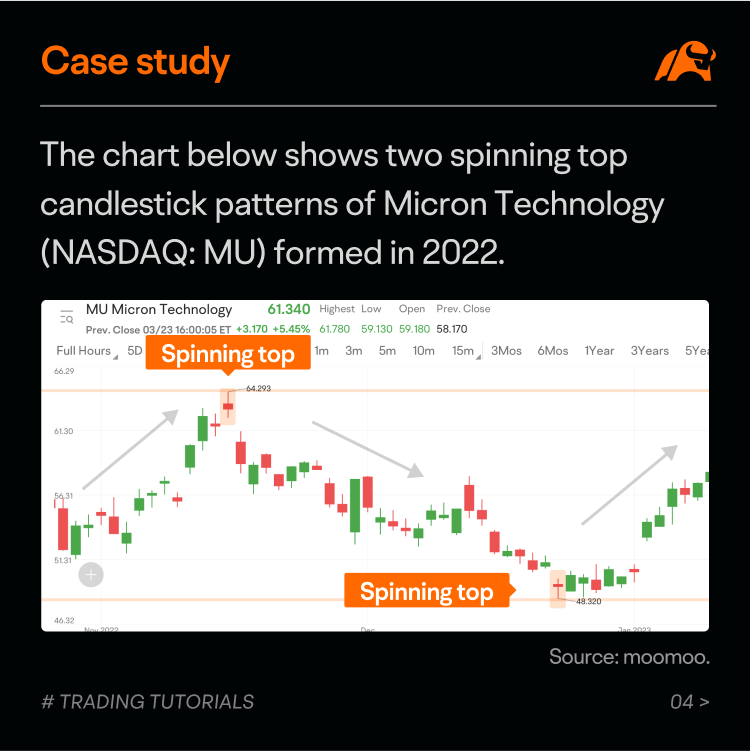
The chart below shows two spinning top candlestick patterns of Micron Technology (NASDAQ: MU) formed in 2022.
MU stock has been trading in a rectangle chart pattern since July 2022. A resistance line can be drawn by connecting the highs, and a support line can be drawn by connecting the lows.
The first spinning top (on the left) occurred after a sharp price advance in October 2022. The price reached the resistance level and failed to break it. The appearance of a spinning top candle showed that the bulls were losing control. Then the price closed lower in the following trading session, providing confirmation of the pattern. After that, the price entered a downtrend.
The second spinning top (on the right) occurred after a price decline in late 2022. The price fell to the support level. The appearance of a spinning top candle at the support level indicated that the bears might have been losing control. The price closed higher in the following trading session, providing confirmation. After that, the price entered an uptrend.
Summary
A spinning top is a neutral candlestick pattern indicating the market's indecision.
It can appear in an uptrend, a downtrend, and a sideways market.
If a spinning top occurs in market consolidation, it typically suggests indecision and sideways movement may continue. If a spinning top occurs in an uptrend or a downtrend, it may signal a potential reversal, but confirmation is required.
Like with all the other technical tools, investment decisions should not be solely based on this single indicator. The spinning top should be used in concert with other signals and indicators.
This presentation discusses technical analysis, other approaches, including fundamental analysis, may offer very different views. The examples provided are for illustrative purposes only and are not intended to be reflective of the results you can expect to achieve.
All investing involves risk, including the potential loss of principal, and there can be no guarantee that any investing strategy will be successful.
This presentation is for informational and educational use only and is not a recommendation or endorsement of any particular investment or investment strategy. Investment information provided in this content is general in nature, strictly for illustrative purposes, and may not be appropriate for all investors. Read more