Introductory Guide to Decode Market Hidden Signal - Technical Analysis
Did you know that many traders face challenges in achieving consistent profits in the market?
However, some find that developing a deeper understanding of market patterns — often analyzed through charts using Technical Analysis — can provide valuable insights into potential price movements.
Today, we're going to explore the merits of this long standing approach and explore how it may enhance your understanding of market trends. Let's dive in!
So, what is Technical Analysis?
It's a method used to identify patterns, trends and potential trading opportunities by analyzing historical market data, such as price movements and trading volumes. Think of it as unlocking the market's story, where every chart tells a tale of emotions, decisions, and possible trading opportunities.
Next commonly asked question is 'Why Consider Technical Analysis?'
3 main reasons:

Reason#1: Used for Centuries to Analyze Market Trends and Patterns
Let me share a story:
It all started in 17th-century Japan when Munehisa Homma, a legendary trader and now known as the "Father of Candlestick Charts," developed candlesticks to track emotions and price movements in the rice markets.
Fast forward to the 19th century, Charles Dow laid the groundwork for modern technical analysis with Dow Theory by showing how price and volume helps identify trends in the stock market.
Here we are today, with modern tools like AI and algorithms, yet technical analysis has become even more popular.
So, why does it still work? The answer is simple: patterns often repeat. Human psychology hasn't change.
The market reflects our collective decisions and emotions. Price discounts everything and tells the objective story of supply and demand.

Reason#2: It's Adaptable to Various Trading Style
Whether you're a short term trader or a long-term investor, technical analysis can provide insights into patterns and trends to inform potential entry and exit points.
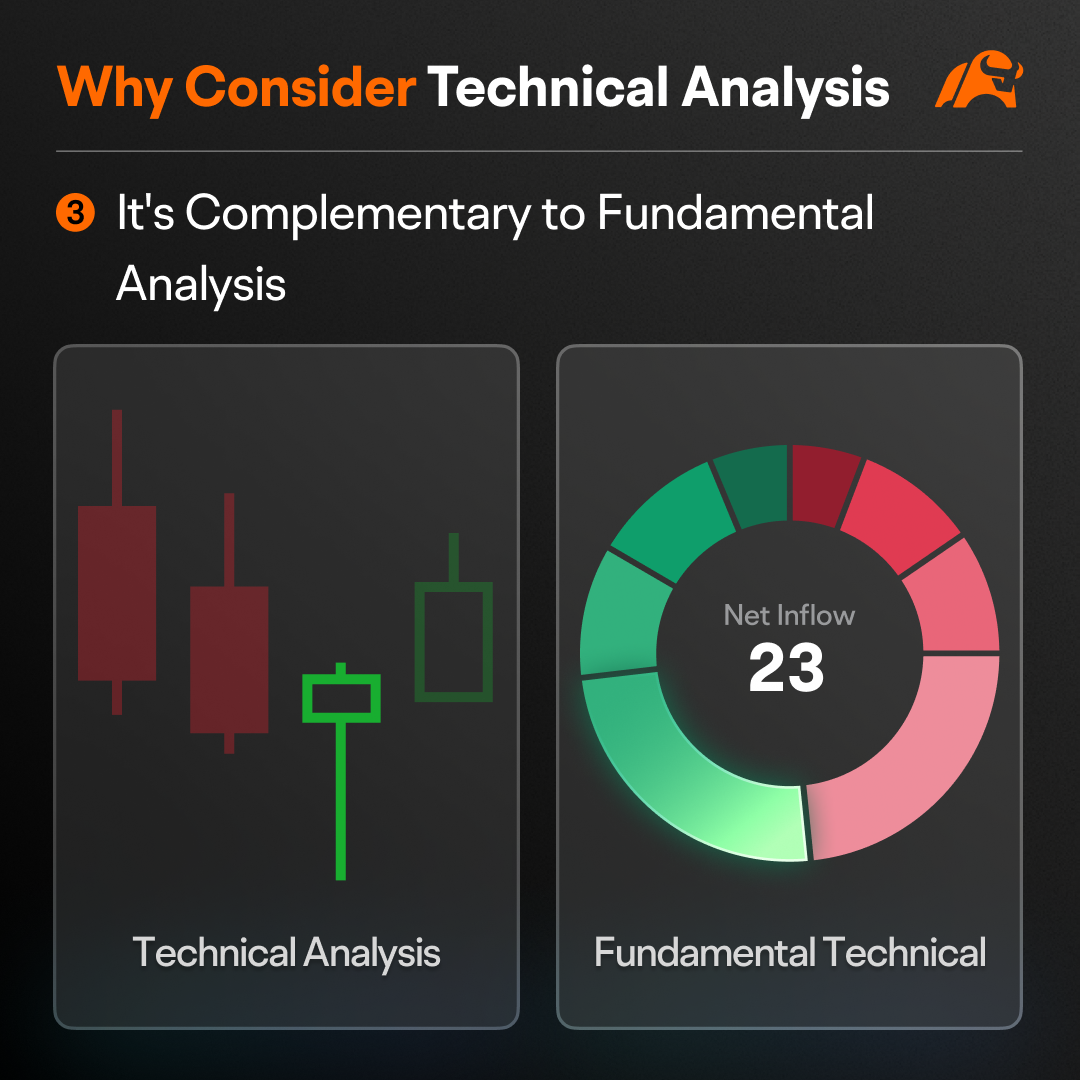
Reason#3: It's Complementary to Fundamental Analysis
Despite it being a different school of thought, traders and investors use technical analysis, focusing on price and volume, to complement fundamental analysis, that focuses on stocks's financial and intrinsic value, and market's earnings and news.
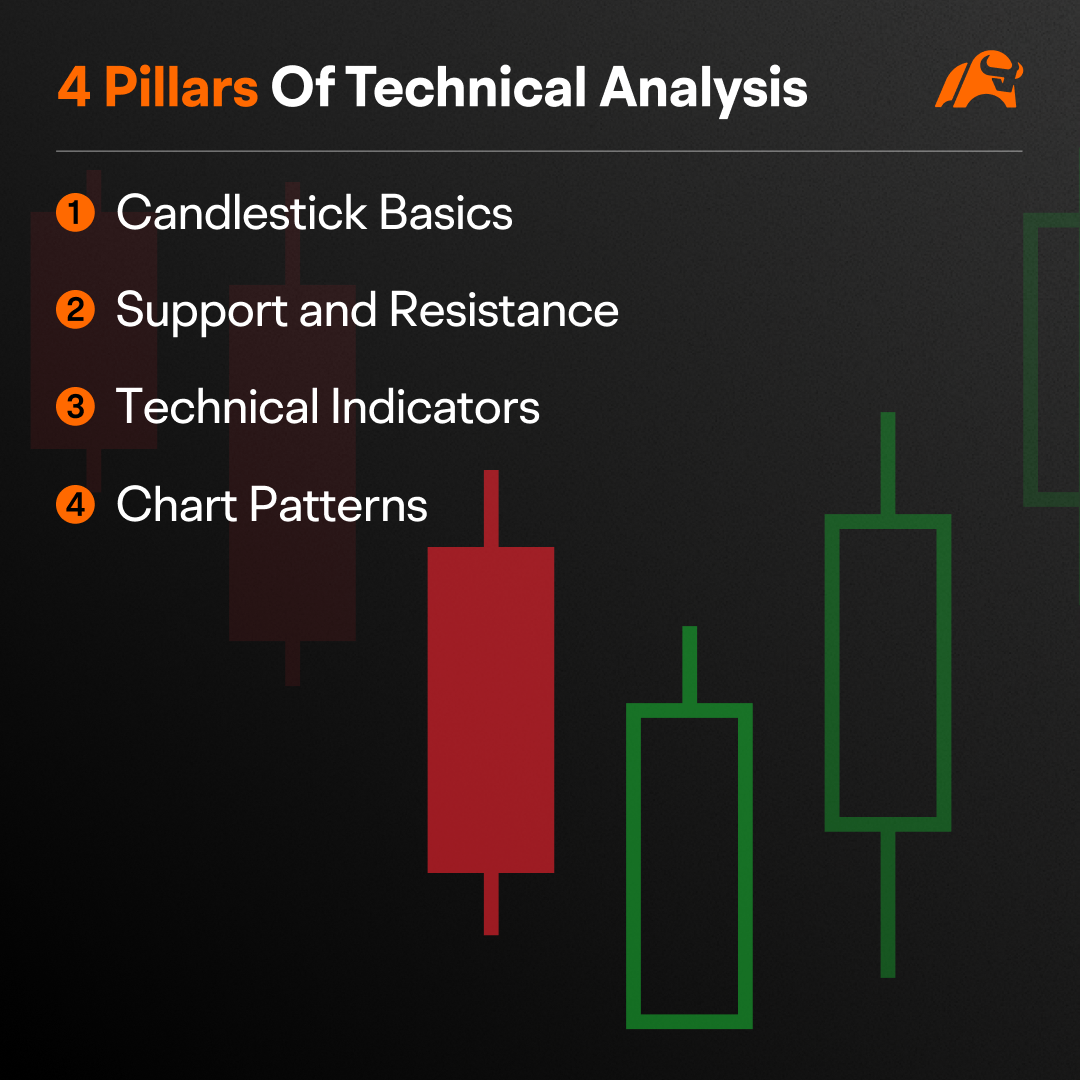
Based on these reasons, technical analysis can offer useful market insights. Next, we will explore the 4 Pillars of Technical Analysis, so you can learn to build your trading strategy. There are:
Candlestick Basics
Support and Resistance
Technical Indicators
Chart Patterns
Let’s dive into the first pillar of technical analysis: candlesticks. Every candlestick tells a story within a range of time. A green candle typically indicates that buyers had greater influence within a certain timeframe, pushing the price higher, while a red candle suggests that sellers had the upper hand, driving the price lower during that period of time. In essence, candlesticks reflect the ongoing battle between buyers and sellers in a specified timeframe—the market's heartbeat.
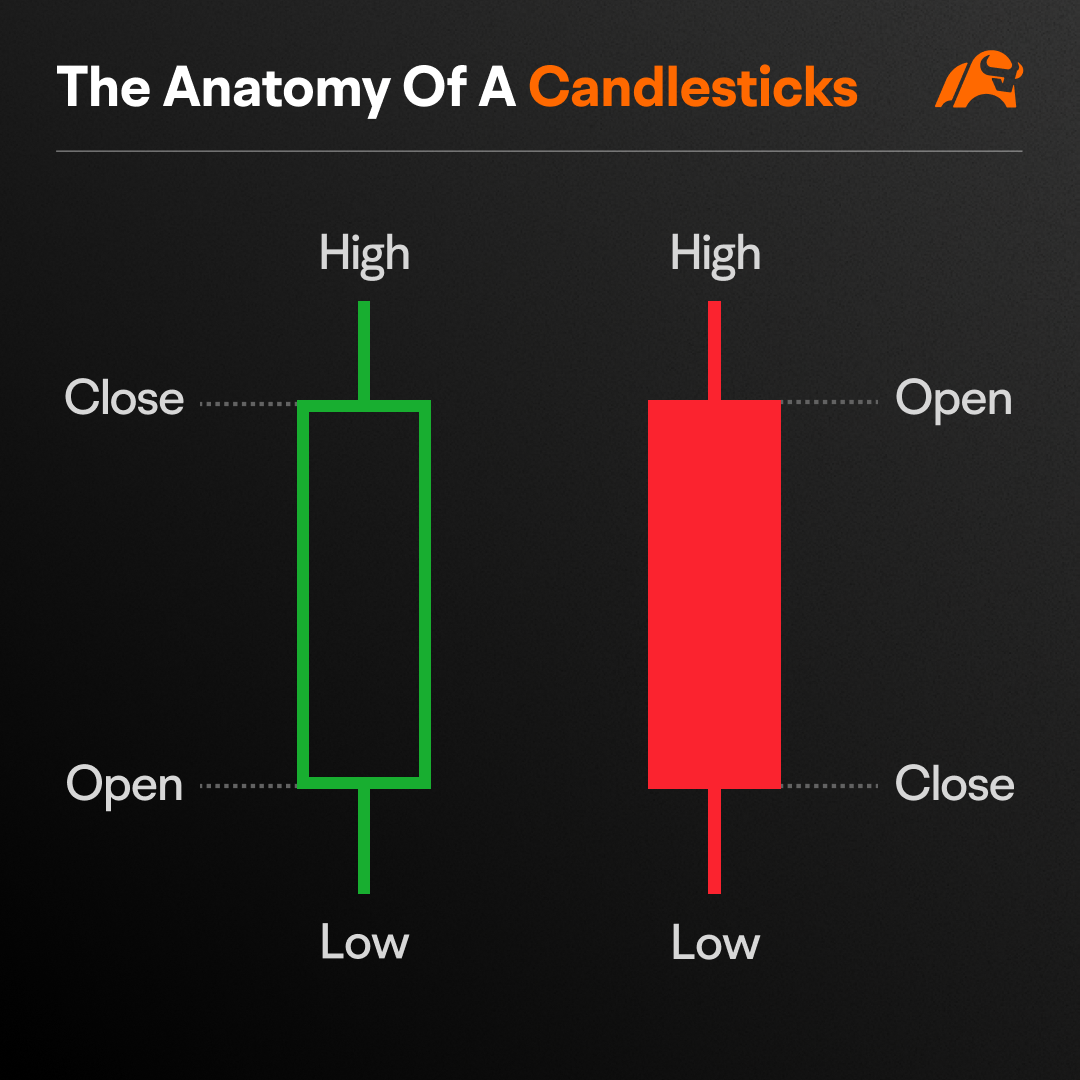
The Anatomy of a Candlestick
Each candlestick has four key components: the open, high, low, and close—commonly abbreviated as OHLC. These elements help traders gauge market sentiment by revealing whether buyers or sellers have the upper hand. Some candlesticks feature wicks, while others don't, offering additional insights into price movements.
Reading Individual Candlesticks
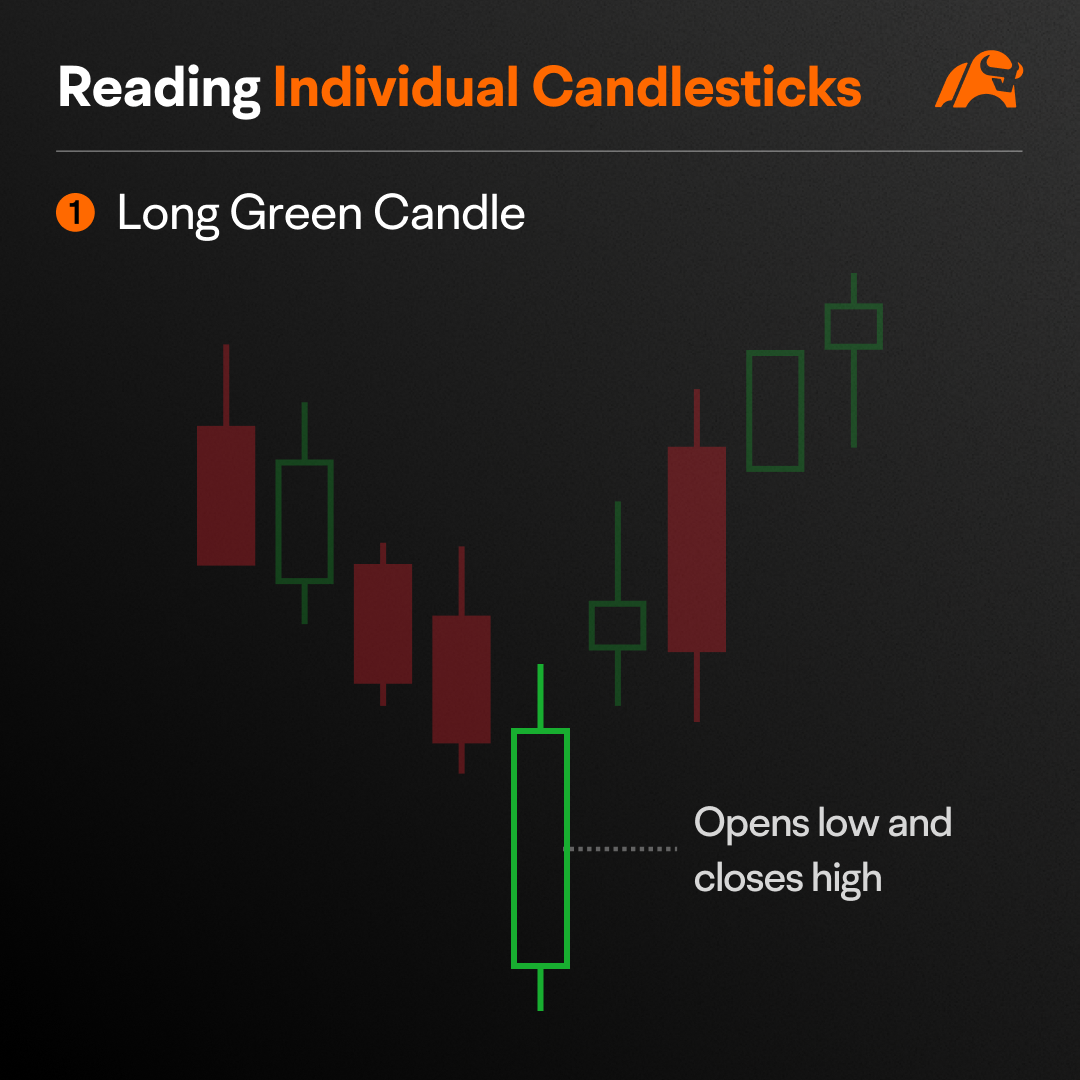
When you spot a long green candle, it means the price opens low and closes high—like buyers sprinting ahead. This potentially indicates strong buyer momentum during that period.
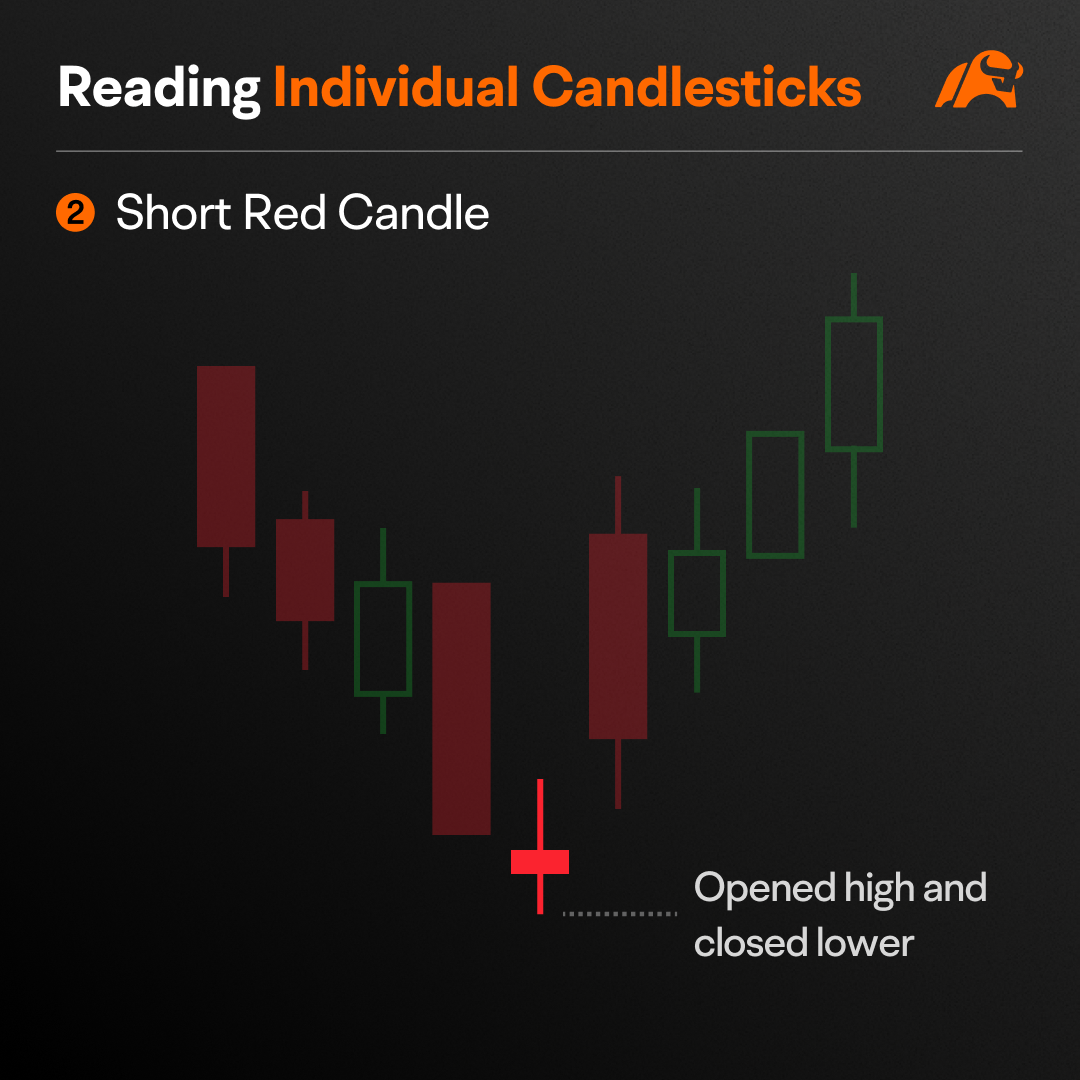
On the other hand, a short red candle signals the price opened high and closed lower. This suggests sellers may be slowing down or losing control, which may be an indication of a possible reversal in price.
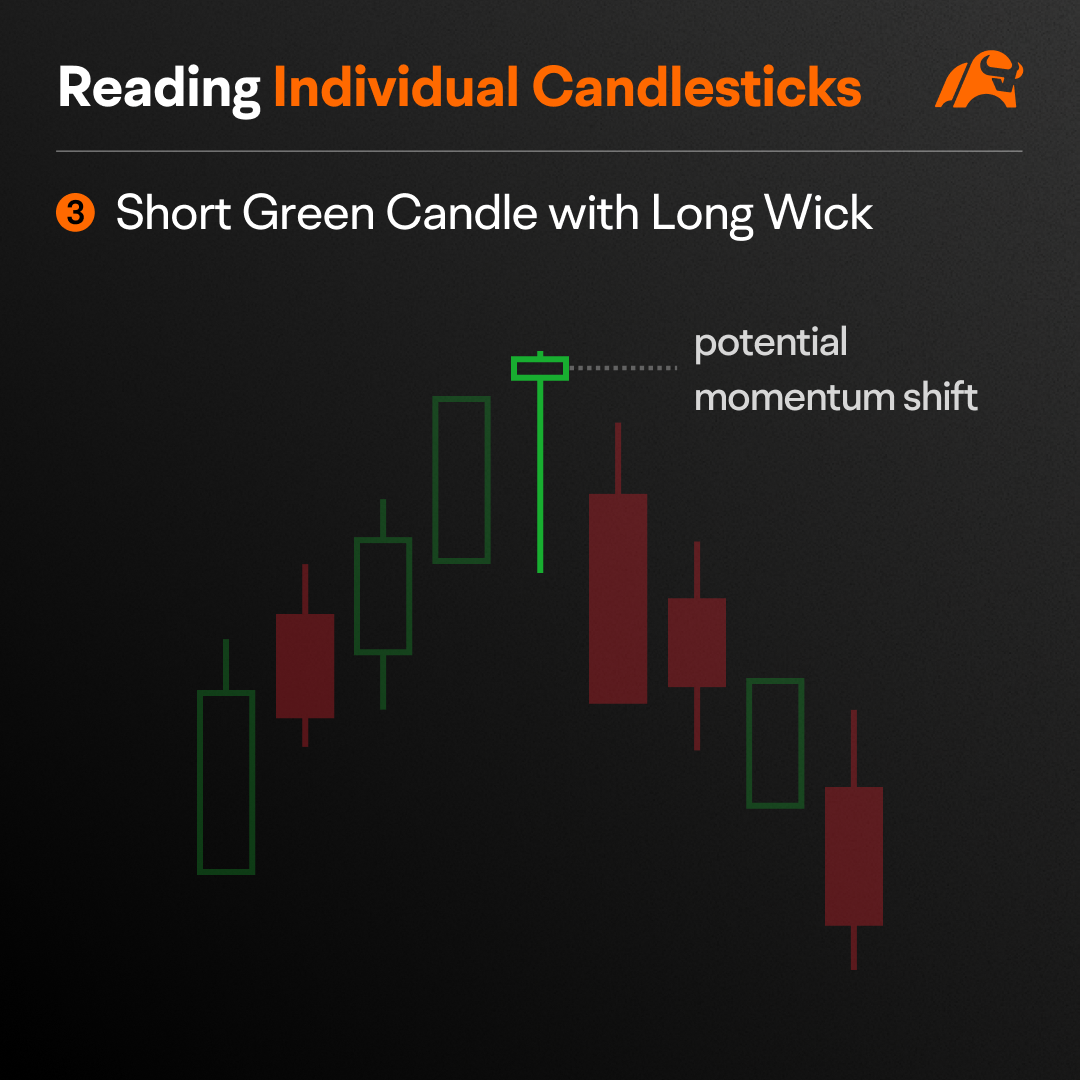
Imagine this: the buyers are strong, but the price doesn't go up much. Instead, a small green candlestick forms with a long bottom wick. What's happening here?
The green body shows buyers are still in control—but just barely. The long wick tells a deeper story: sellers pushed back hard before the candle closed. This can be a signal of sellers gaining strength.
For traders, this pattern often signals a potential momentum shift or even a trend reversal, depending on the timeframe and market context. While buyers may currently be in control, the presence of seller strength suggests that a shift in momentum could occur in the near future.
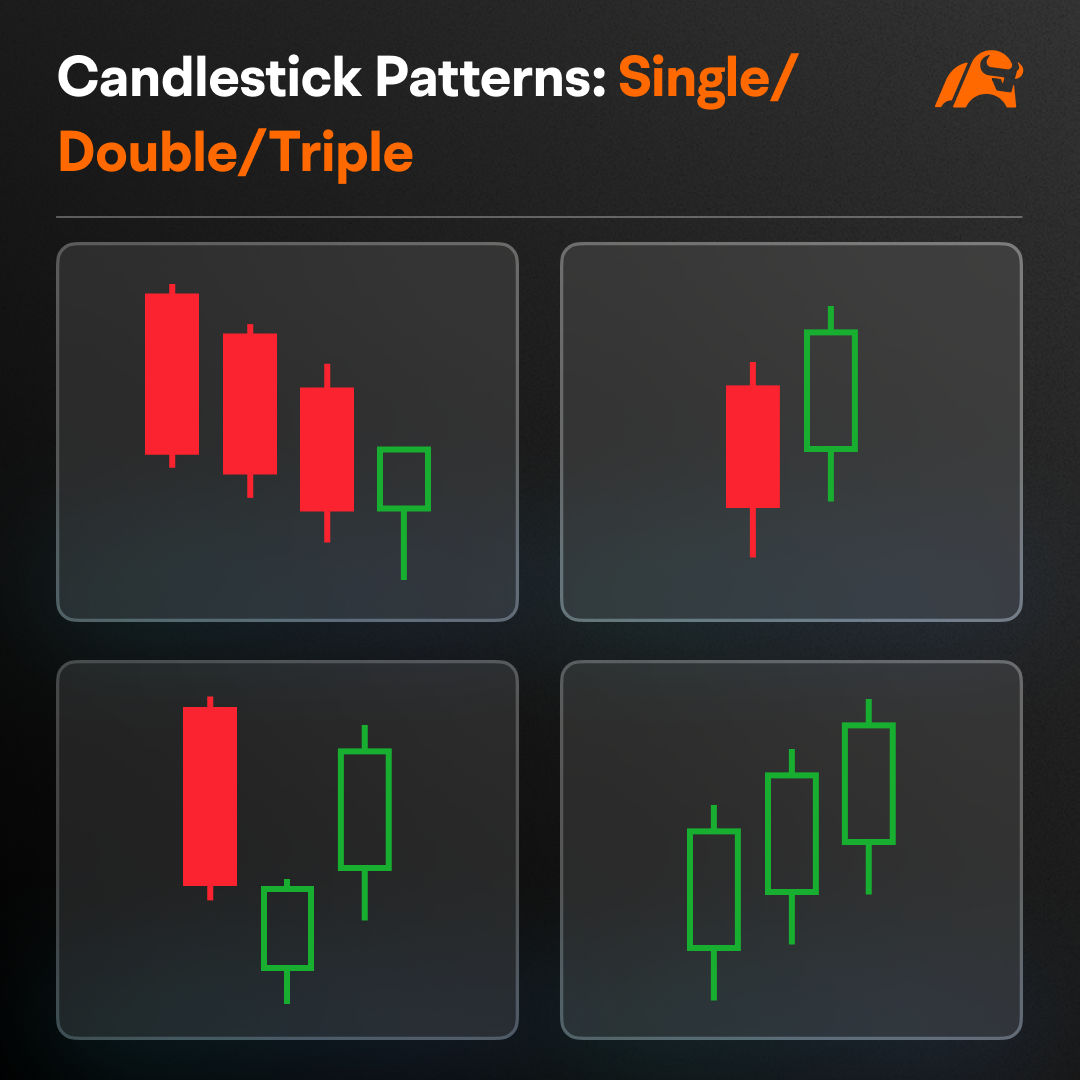
Single/Double/Triple Candlestick Patterns
With just one candlestick, you can extract trading signals without using technical indicators like moving averages (MA) or relative strength index (RSI). But what happens when you analyze two or even three candlesticks together? This is where it gets exciting. By observing multiple candlesticks, you can potentially uncover the market's rhythm using naked chart reading techniques.
These multi-candlestick formations are known as bullish or bearish patterns, often combining both red and green candles. A trained eye can identify whether the chart is indicating momentum on the side of buyers (bullish patterns) or sellers (bearish patterns).
Mastering candlestick basics allows you to evaluate and adjust to market dynamics using one of the methods of technical analysis. Understanding these patterns can help you gain more confidence while keeping your approach straightforward.
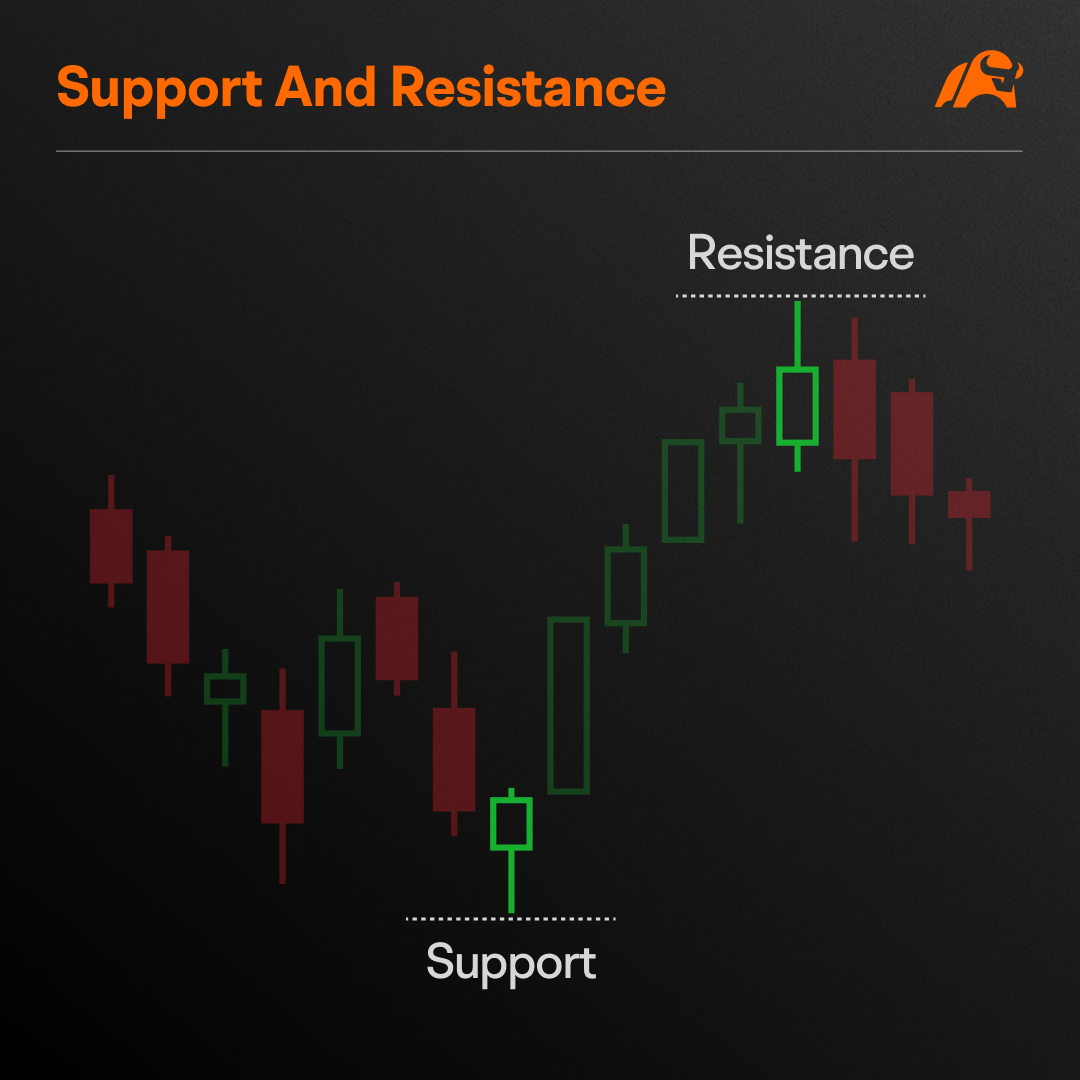
The second pillar of technical analysis is support and resistance.
Picture a game of tug-of-war.
Support is like the price floor, whereby buyers take control of this key level or zone, to stop prices from falling further.
Resistance is like the price ceiling, whereby sellers take control of this key level or zone, to prevent prices from rising further.
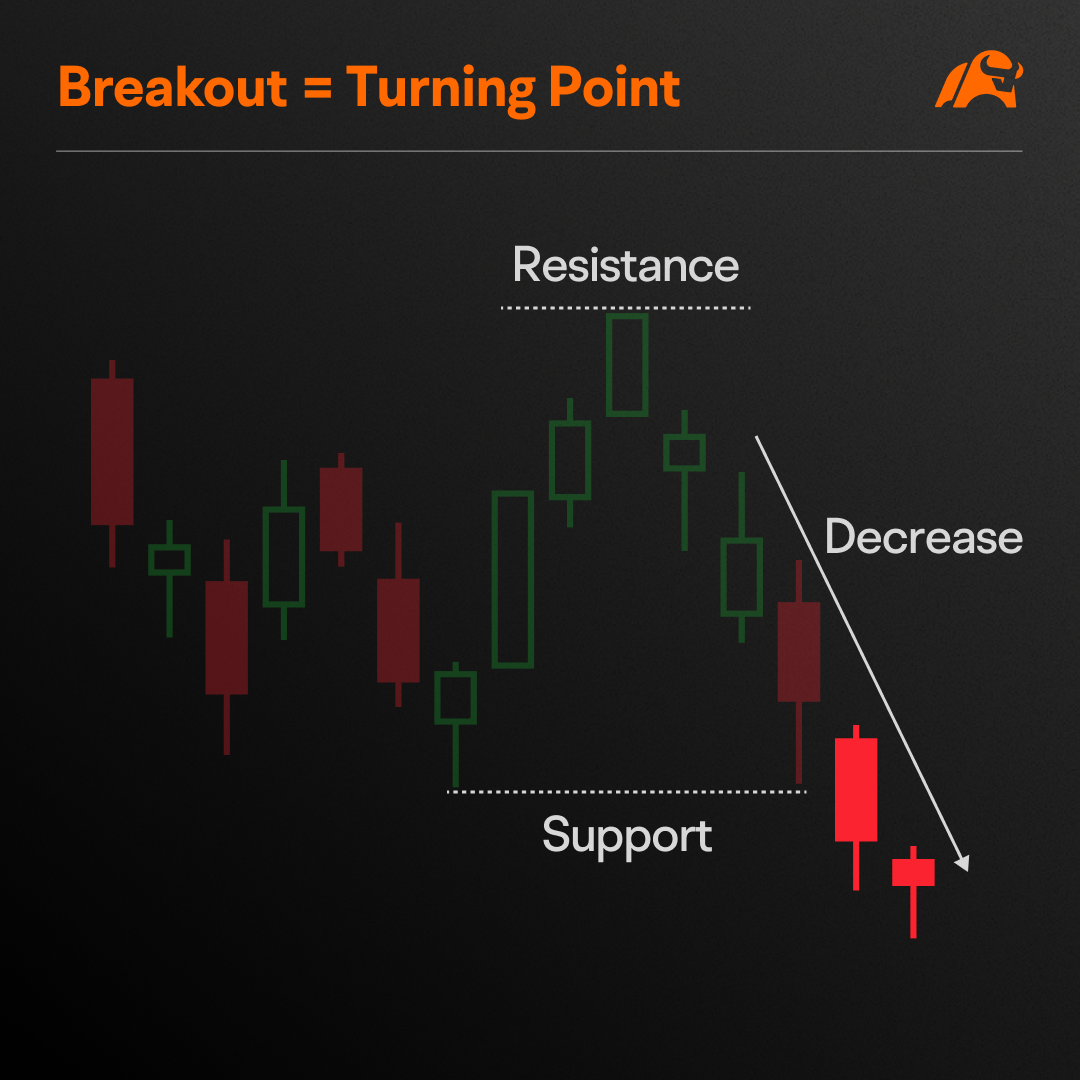
Imagine this: when the price breaks below indicated support, it's as if the buyers lose their grip in the tug-of-war, and sellers take charge. On the flip side, when the price breaks above indicated resistance, the sellers are overpowered, and buyers take control.
These support and resistance levels and zones often act as the market's turning points. They grab traders' attention because breaking these levels may mark the start of a new chapter in the market's story.
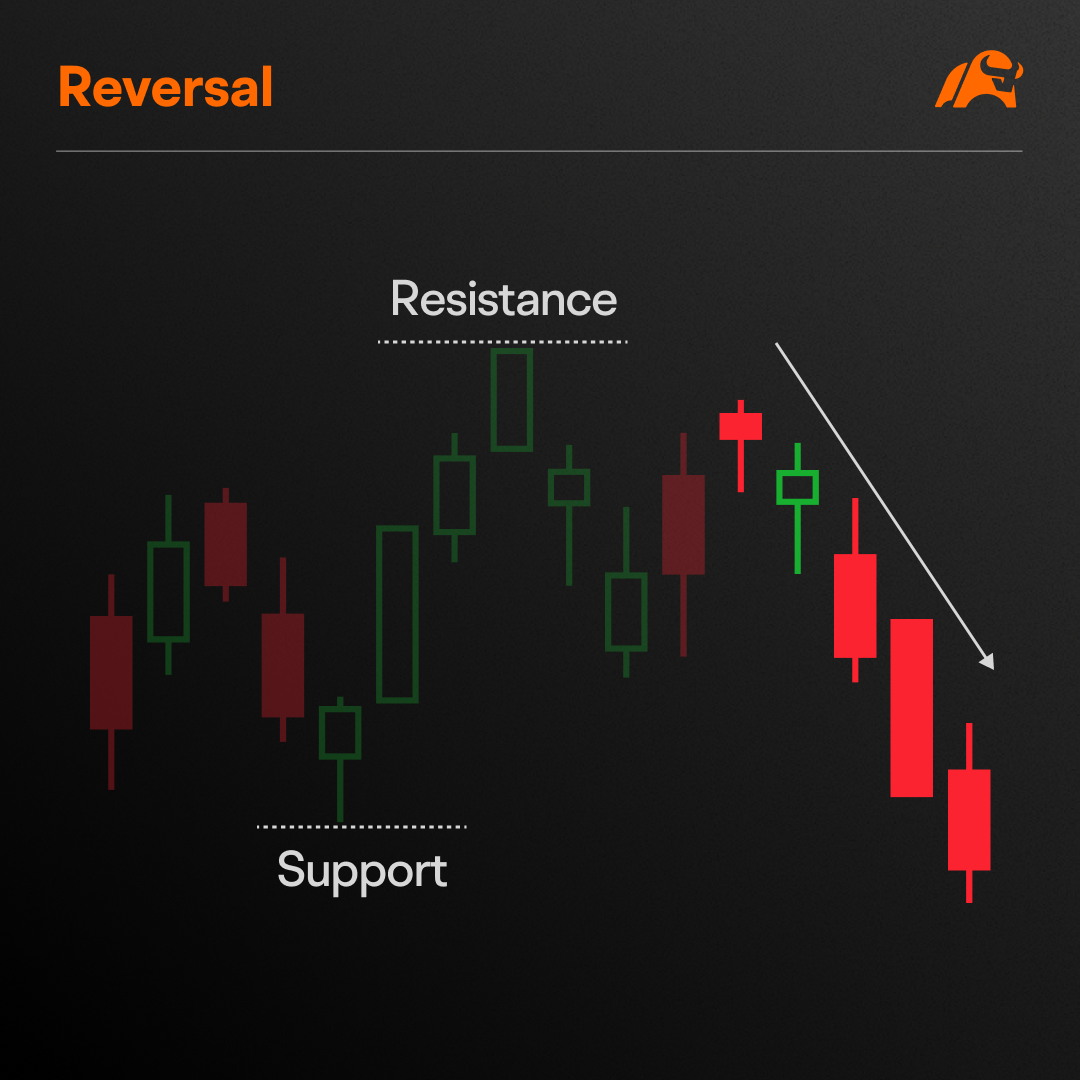
But here's the twist: prices don't always touch these key levels. Sometimes they reverse direction before reaching them. And also, sometimes the movement out of previous support and resistance levels doesn't last. This is called a false breakout. That's why traders need more than just these levels—they need additional signals to understand the market's story.
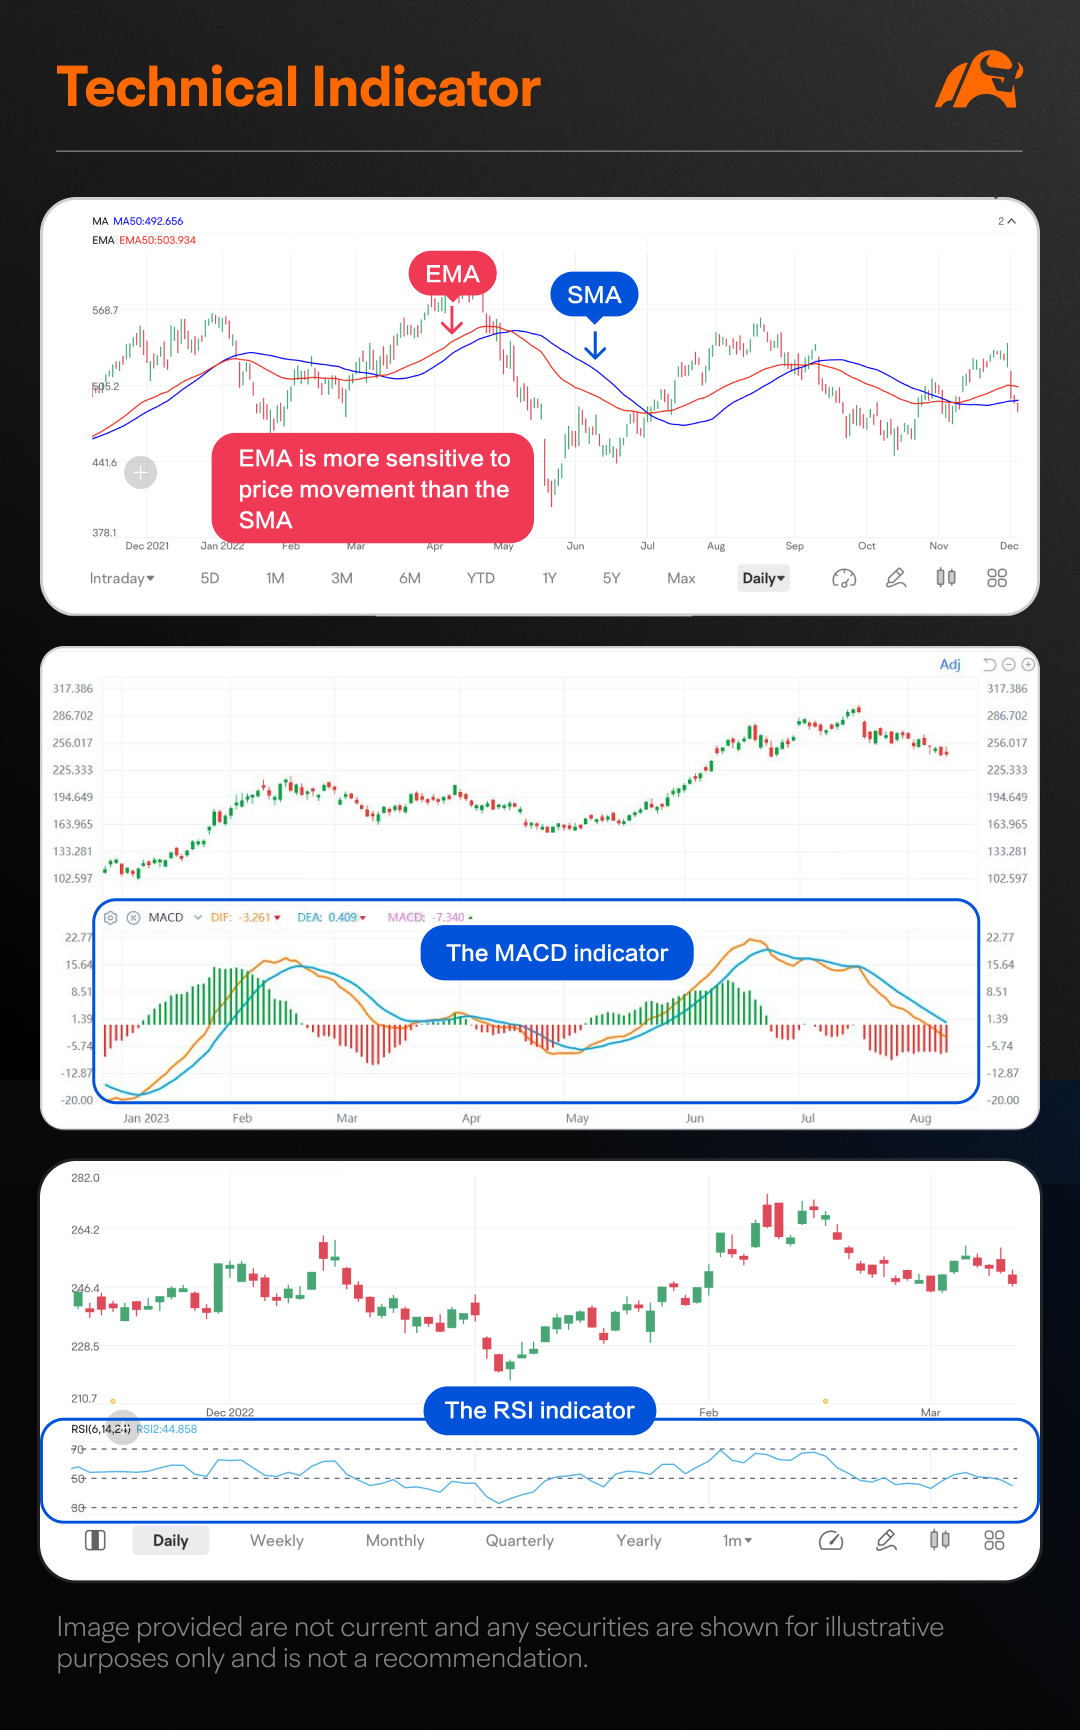
To round out the picture, we turn to the third pillar of technical analysis: technical indicators.
Technical indicators are akin to a compass for traders to better navigate the unpredictable waters of the market with objective trading signals
Some of the most trusted technical indicators are:
EMA (Exponential Moving Average): It smooths out price movements, revealing the market's trends.
RSI (Relative Strength Index): A momentum indicator that whispers, "Is this market overbought or oversold?"
MACD (Moving Average Convergence Divergence): Your guide to spotting trend strength and potential reversals.
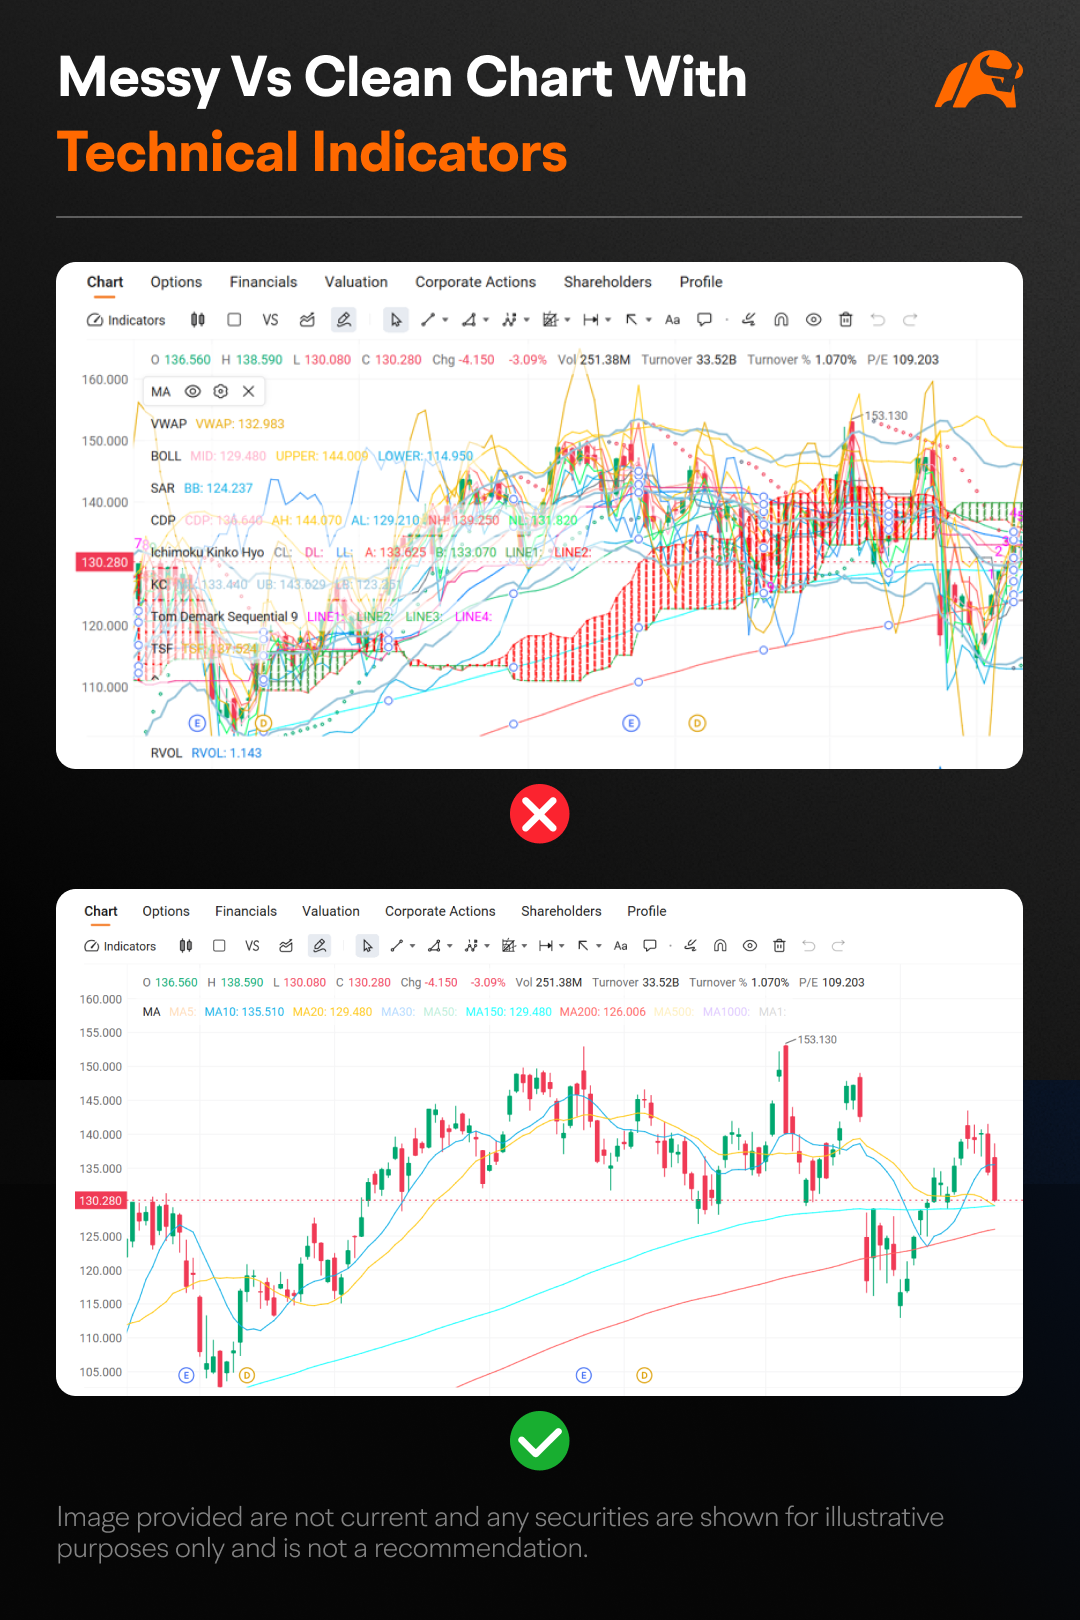
But here's a critical tip: overcrowding your chart with too many indicators can be like trying to follow too many compasses—you'll only end up lost. Instead, it may be beneficial to choose a few that match your style and integrate them into your trading strategy.
Remember, indicators are your allies, not your fortune-tellers. Use them wisely to stay on course.
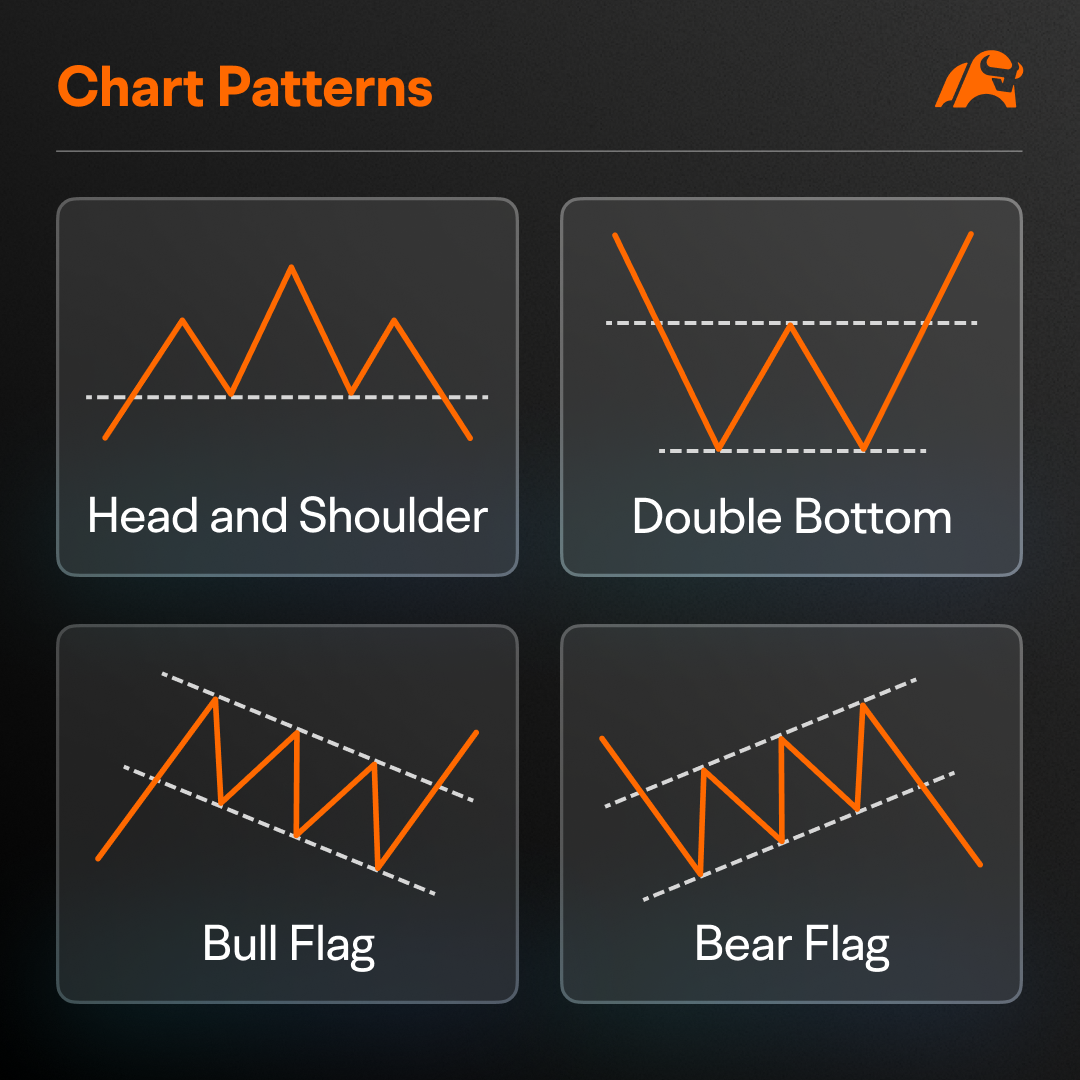
Now, let's explore the fourth and final pillar of technical analysis: chart patterns. Think of them as your roadmap, turning market chaos into potential opportunities.
Here are three key patterns to keep on your radar:
Head-and-Shoulders: A signal that a trend might be reversing—like a warning sign on the road.
Double-Bottom: A clue that prices could rebound, similar to hitting a speed bump and bouncing back.
Bullish or Bearish Flags: Indicators of a trend likely to continue.
There are countless chart patterns out there. With practice, you may be able to start spotting opportunities that others overlook.
In conclusion, candlesticks reveal the market's story, support and resistance highlight key turning points, technical indicators serve as your trading compass, and chart patterns act as your trading map. Together, they can enable you to craft a confident trading strategy and make informed buy/sell decisions—without relying on emotions alone.
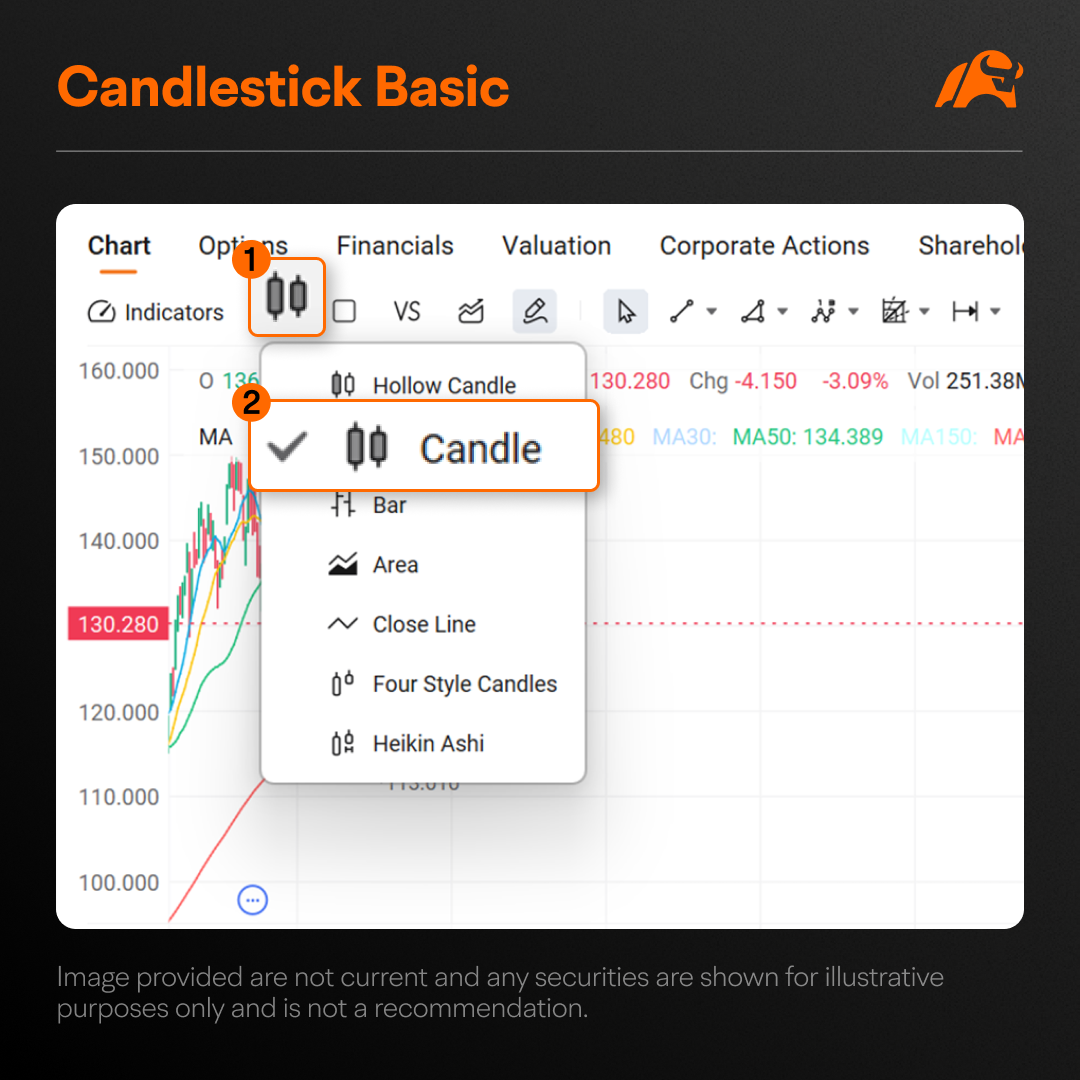
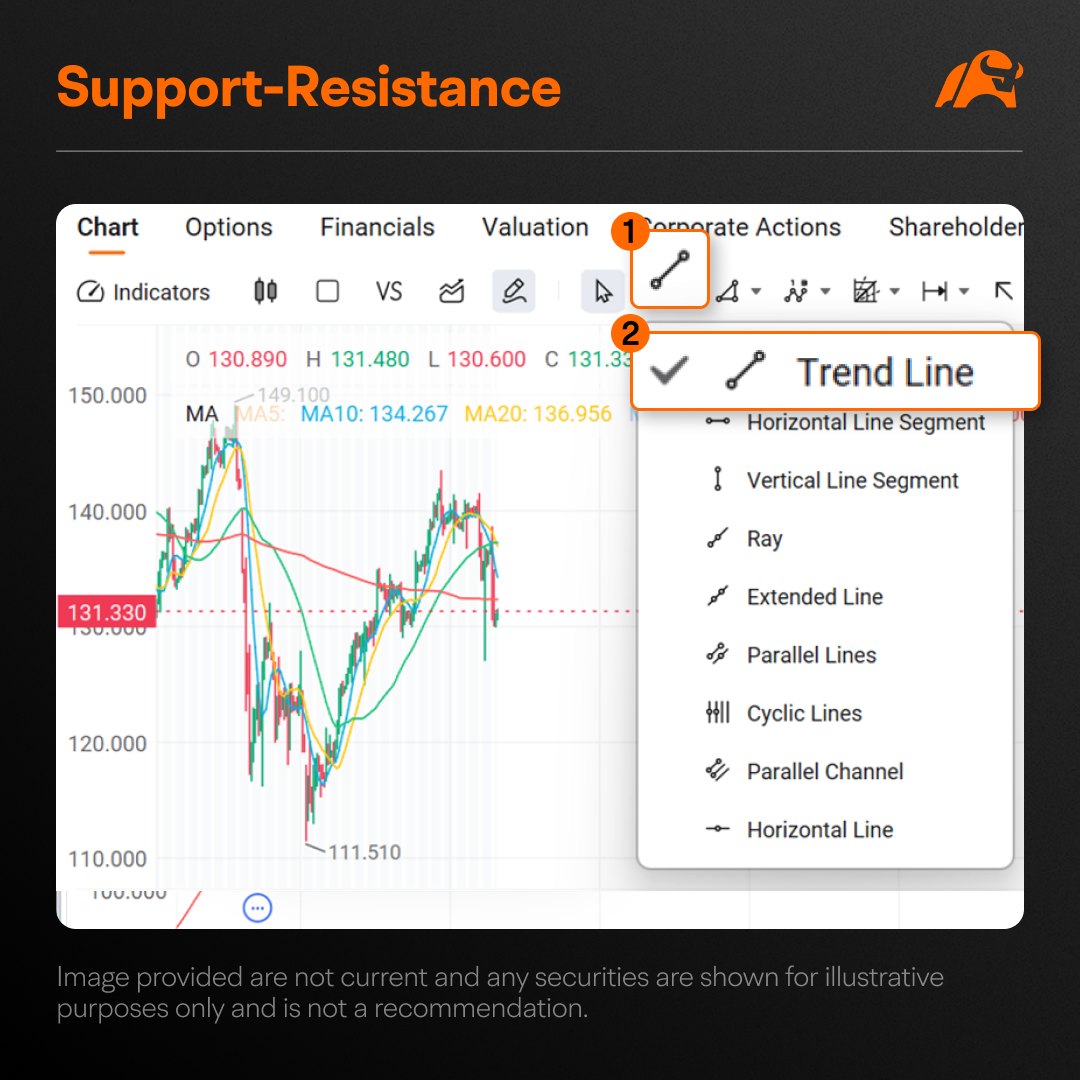
Lets have a quick walkthrough on the moomoo platform on all the basic technical analysis features:
Understanding candlestick basics - click on 'Candle' to see the candles display as green and red color
The power of support-resistance - click on 'Horizontal line Segments' to draw your indicated support-resistance
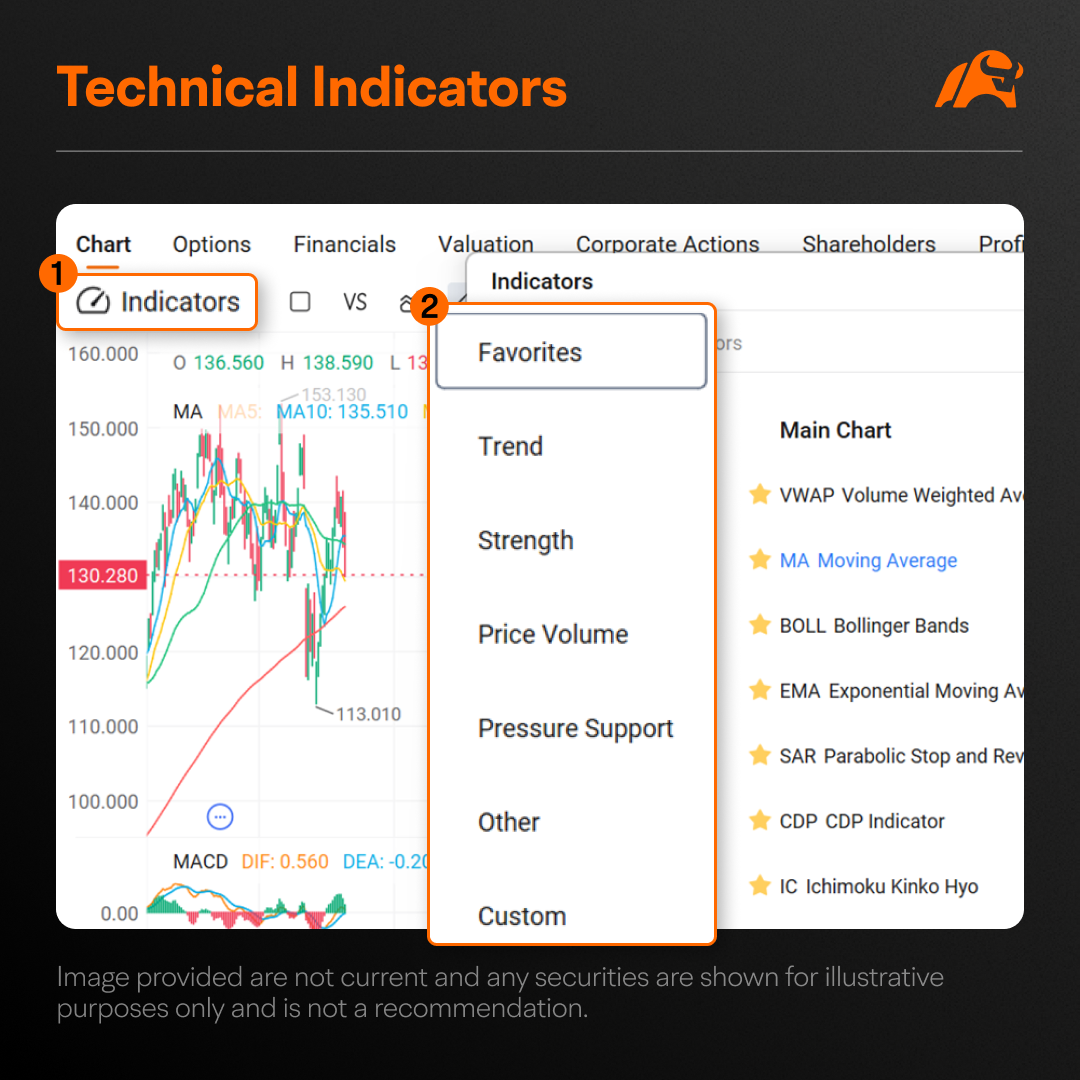
Decoding technical indicators - click on 'Technical Indicators' to explore the different category of technical indicators
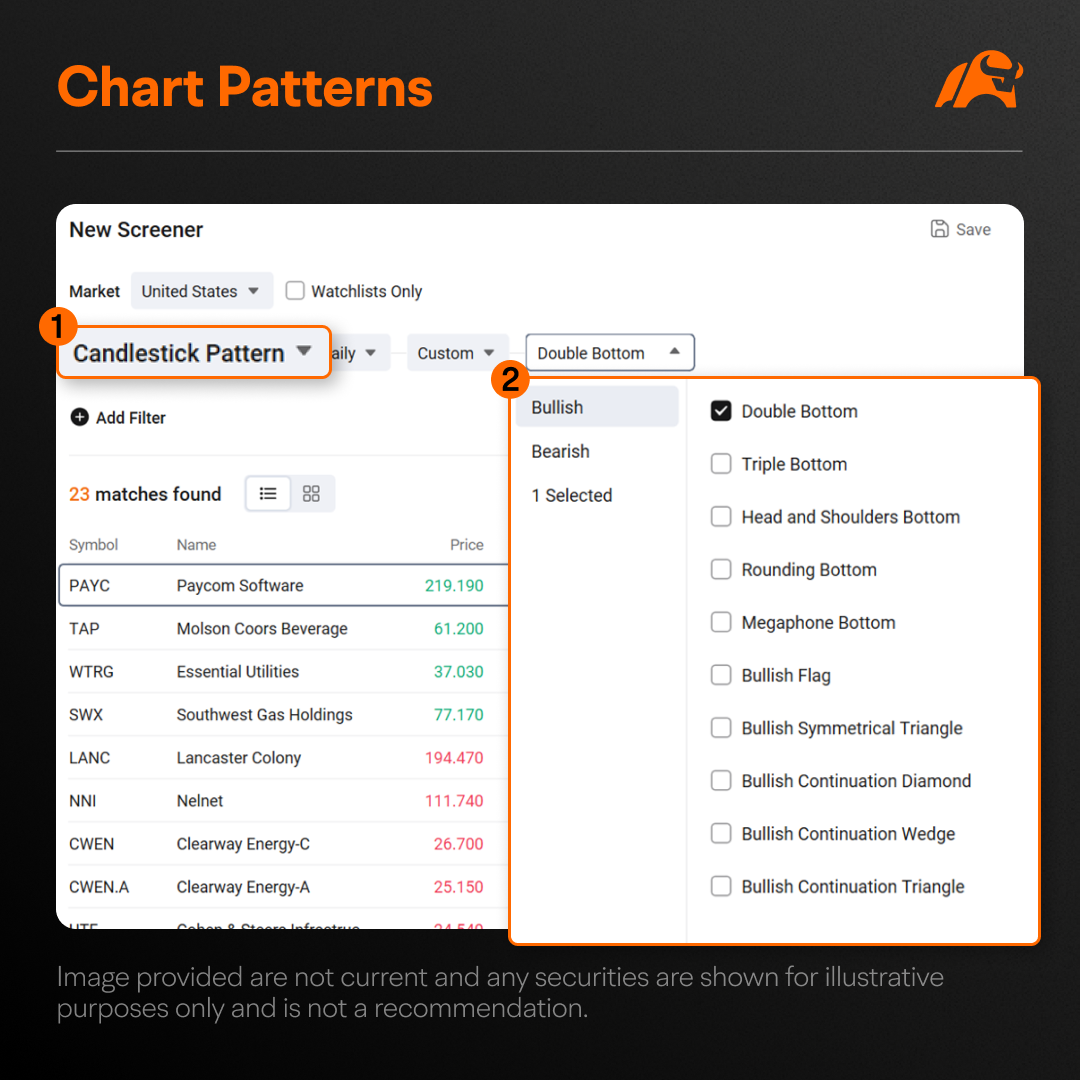
Identifying chart patterns - click on 'Screeners' > Candlestick Patterns > Bullish/Bearish Patterns
Here's the good news: moomoo makes detecting these patterns easier, saving you time and effort. Stay tuned to see how it works!
From the rice markets of Japan to today's digital platforms, technical analysis has stood the test of time—helping traders and investors navigate markets with greater precision, confidence, and success.
Think of the market as a complex puzzle. Now, you have the key pieces to start solving it, thanks to your grasp of the basics of technical analysis. However, traders should always consider additional confirmation signals and analyze the broader market conditions before making decisions, as patterns alone do not guarantee specific outcomes. Ready to take the next step? Read the next lesson to learn how to choose the right chart type with moomoo, tailored to your trading style.
This presentation is for informational and educational use only and is not a recommendation or endorsement of any particular investment or investment strategy. Investment information provided in this content is general in nature, strictly for illustrative purposes, and may not be appropriate for all investors. Read more