Multiple time frame analysis
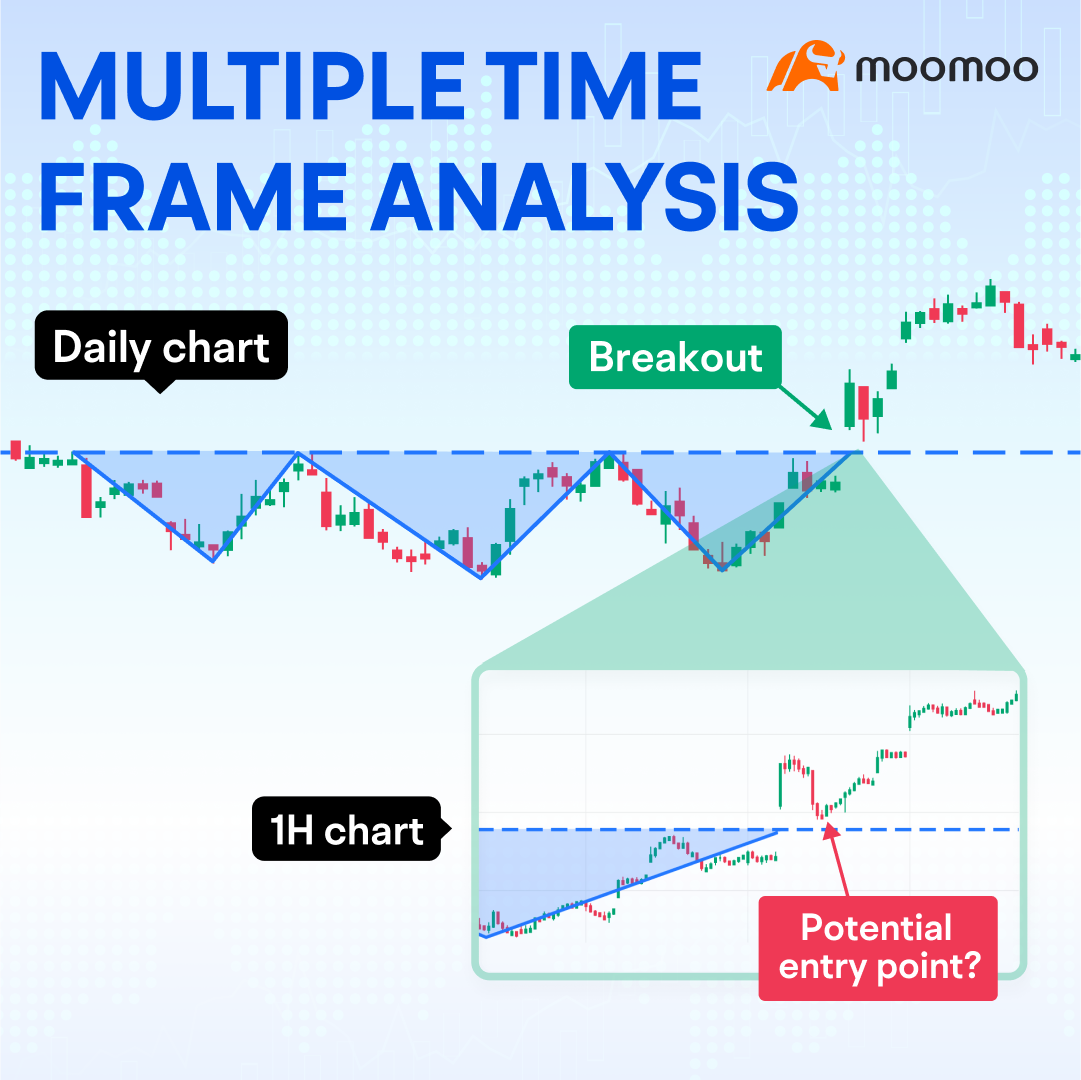
01 What is multiple time frame analysis?
“The trend is your friend.” Many traders believe that by trading with the trend, they increase their chances of achieving better results.
When you examine a price chart, you’ll notice that there are different time frames being provided, for example, the daily, weekly, and hourly charts. This is because different market participants prefer trading in various time frames.
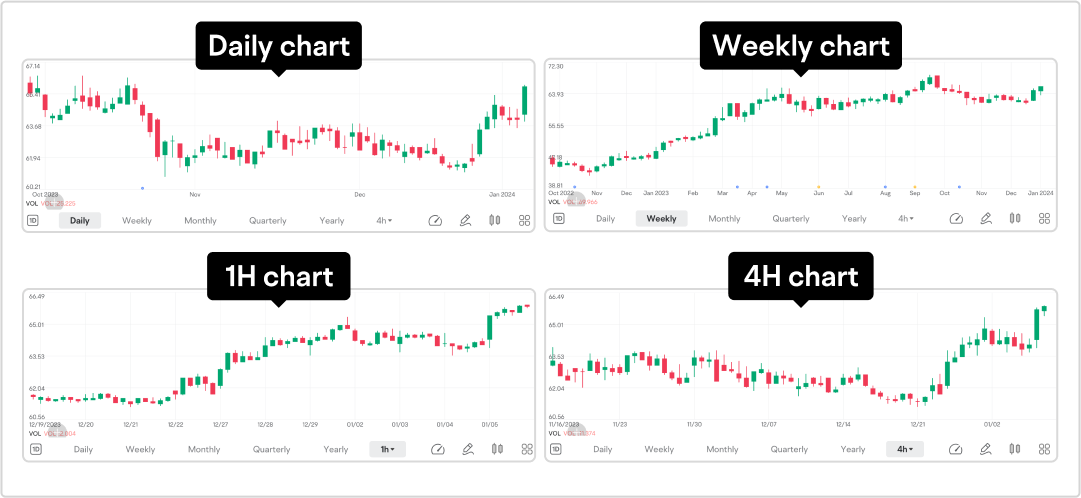
Multiple time frame analysis involves scrutinizing an asset’s price charts across various time frames to enhance chart interpretation and trading decisions.
Many beginner traders tend to focus on price actions in just one chart and overlook other time frames. This narrow focus may restrict their analysis and grasp of the market’s broader trends and dynamics.
Seasoned traders, on the other hand, often refer to multiple time frames to gain a more comprehensive view of price movements and potentially improve their trading decisions, such as spotting potential trend changes earlier.
02 How to perform multiple time frame analysis?
Different time frames provide different perspectives on the market. For instance, a longer time frame trending market could be a ranging market on a shorter time frame.
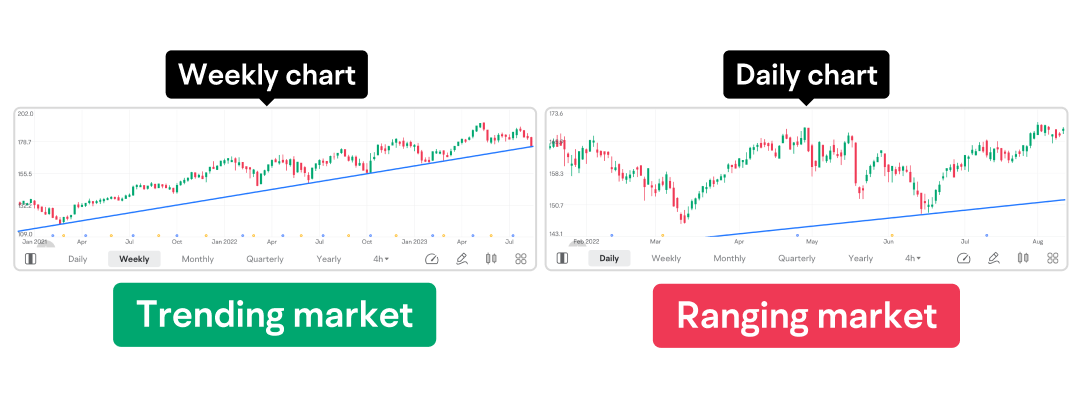
A common mistake among beginners is starting their analysis on a shorter time frame and then working their way up to larger time frames. This is called a bottom-up approach, where traders base their trading decisions on the shorter time frame and then use larger time frames to potentially confirm their ideas.
What would generally work better, however, is the top-down method. With this approach, a trader’s analysis starts on larger time frames that provide a big picture of the market trend, and then the study of shorter time frames helps spot potential trading opportunities.
On a larger time frame, traders can take a broad look at what’s happening in the market and decide whether to go long or short. Additionally, traders may identify potential support and resistance levels, which are generally more significant on larger time frames.
When a shorter time frame is applied, traders can more closely monitor short-term price action, which helps in identifying potential entry and exit points.
03 Case study
Chart 1 on the daily time frame shows a Triple Bottom price pattern. A large gap up occurs when the price breaks above the neckline with a spike in volume. This is generally considered a real breakout, and presents potential trading opportunities.
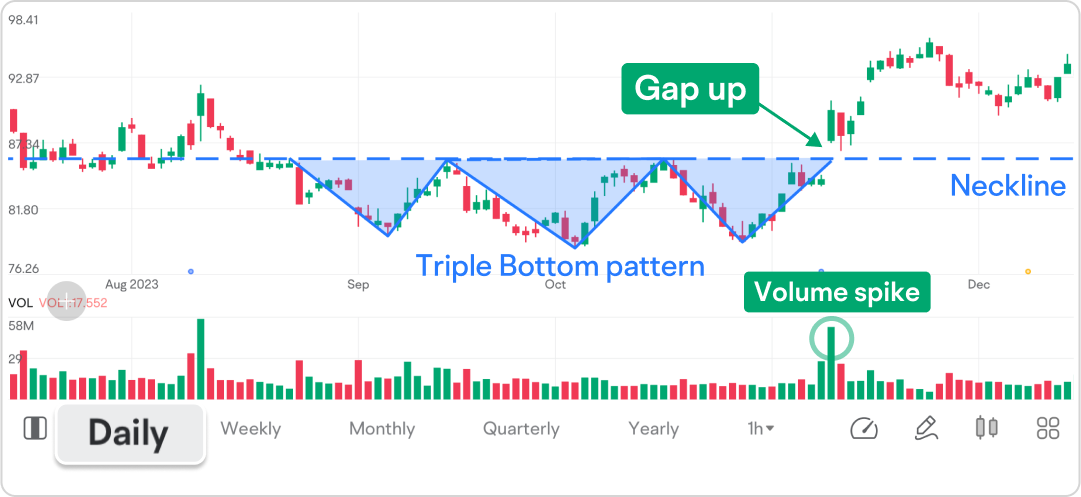
A shorter time frame, for example, a 1-hour (1H) chart, can offer detailed insights into the asset’s short-term price movements.
Chart 2 on the 1H time frame indicates a price retracement around the Neckline, which is considered a potential support level. Traders might argue that the price is expected to rise further if it stays above the support level, and a potential entry point could be near this support.
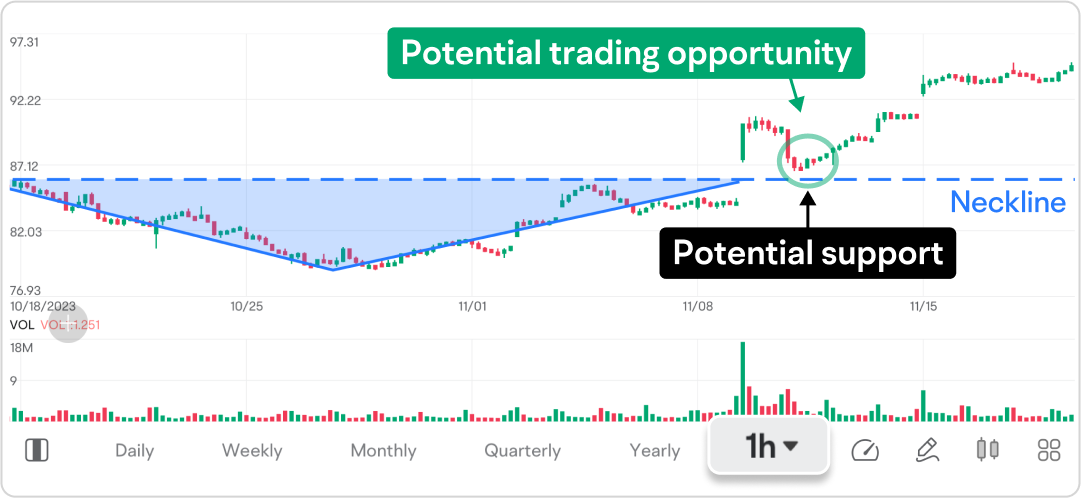
Chart 3 on the daily time frame shows the price makes a tentative breakout below an uptrend line, which is considered a warning signal to the downside, before moving higher.
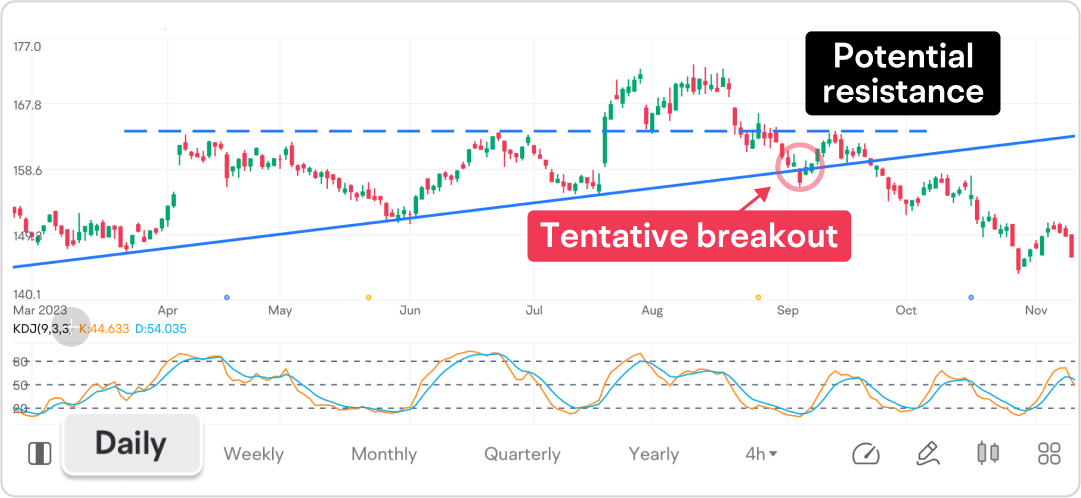
Another warning signal occurs several days later when the price approaches a horizontal resistance line.
To potentially confirm a bearish bias, traders might consult technical indicators and shorter time frame charts, such as the 4-hour (4H) chart.
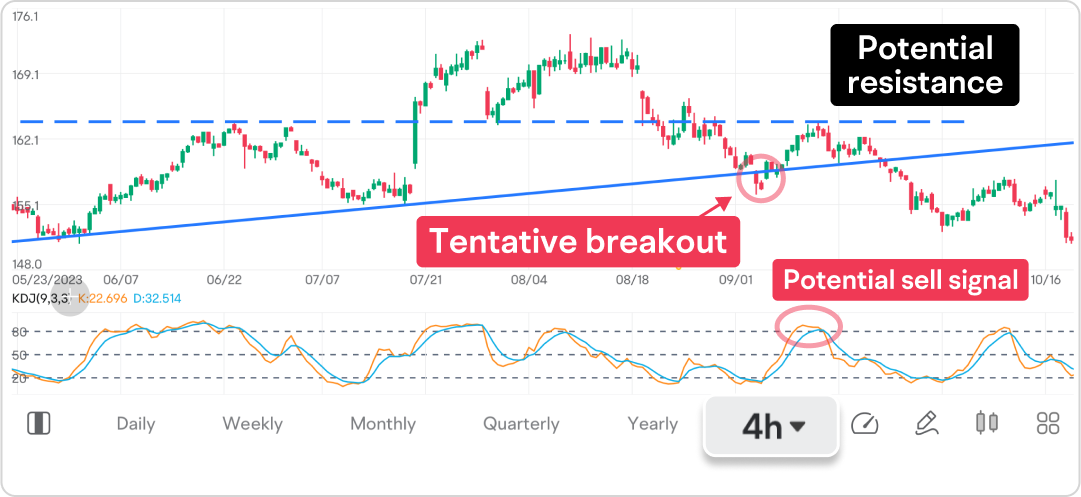
Chart 4 on the 4H time frame shows a more detailed price action compared to Chart 3. A potential sell signal could be identified by the KDJ indicator, a stochastic-like indicator, with the K line rising above 80 (considered overbought) and then crossing below the D line.
This presentation discusses technical analysis, other approaches, including fundamental analysis, may offer very different views. The examples provided are for illustrative purposes only and are not intended to be reflective of the results you can expect to achieve.
All investing involves risk, including the potential loss of principal, and there can be no guarantee that any investing strategy will be successful.
This presentation is for informational and educational use only and is not a recommendation or endorsement of any particular investment or investment strategy. Investment information provided in this content is general in nature, strictly for illustrative purposes, and may not be appropriate for all investors. Read more