Channel trading strategies

01 What is a channel?
A channel in technical analysis typically refers to a trading range that occurs when the price is moving between two parallel trend lines. It is also known as a trading channel or price channel.
Channels can be used to help identify potential areas of support and resistance. The upper trend line marks resistance and the lower trend line marks support.
There are three types of channels depending on market trends.
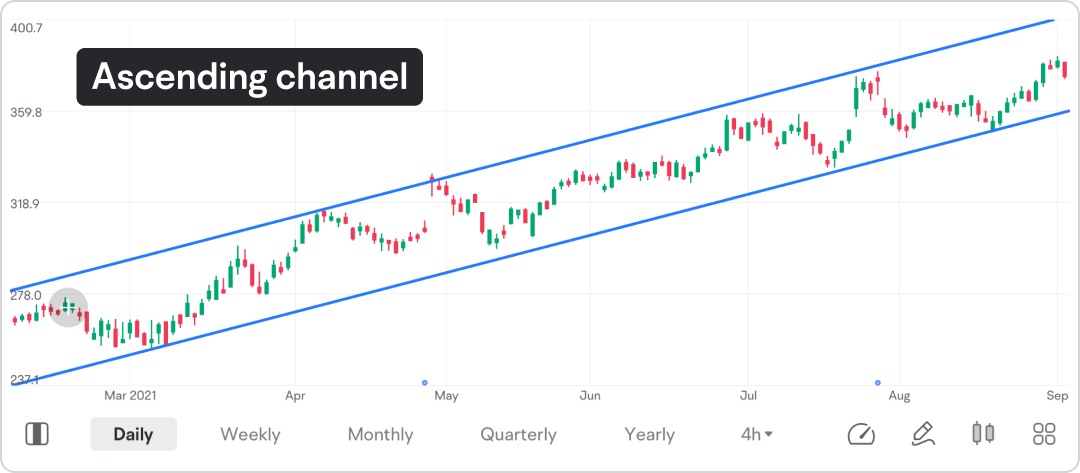
Ascending channels occur when the price is trending upward, with a series of higher highs and higher lows created at relatively the same speed.
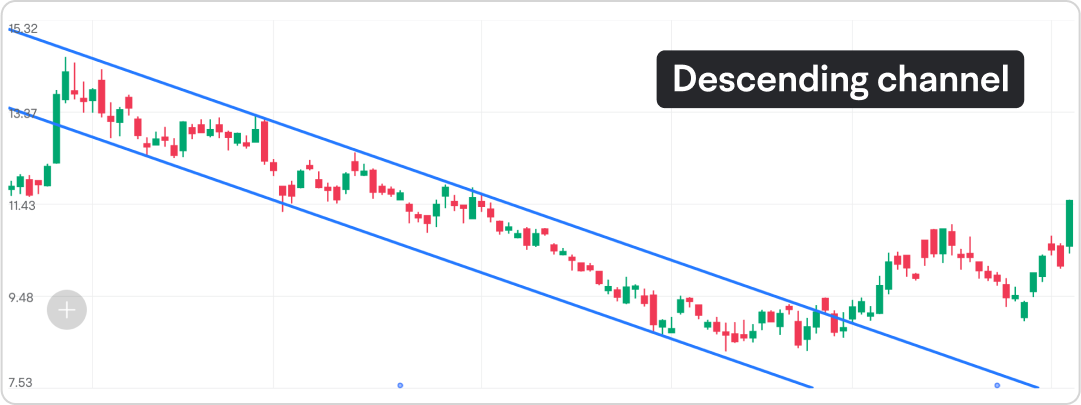
Descending channels occur when the price is trending downward, with a series of lower highs and lower lows forming at relatively the same speed.
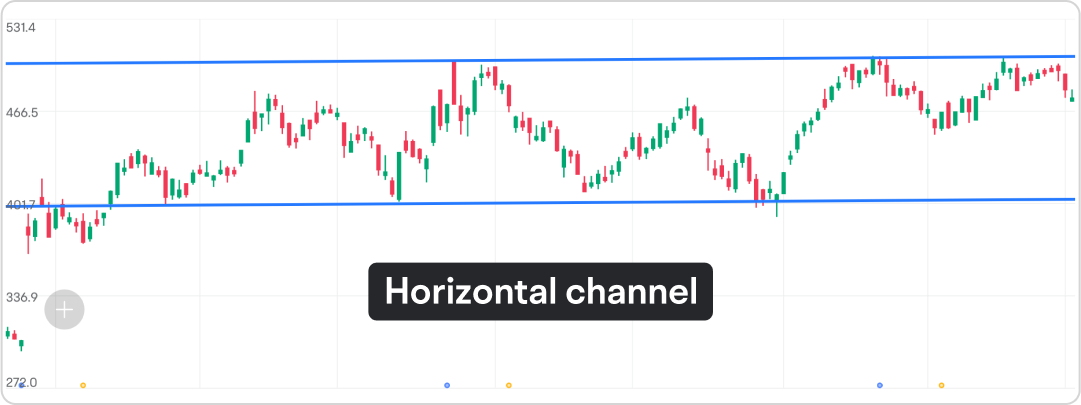
Horizontal channels, also known as ranging channels, occur when the price is trading within a range and is not showing a clear upward or downward trend.
Each type of channel can help traders potentially make more informed decisions, such as when to initiate a position or take profits.
02 Common channel trading strategies
A channel trading strategy involves identifying and drawing a channel.
A channel consists of a basic trend line, and a parallel line to it. Drawing a channel is relatively simple once it is recognized.
In an uptrend, for example, the first step is to draw a basic uptrend line connecting at least two swing lows. The second step is to draw a parallel line at relatively the same angle as the basic uptrend line.
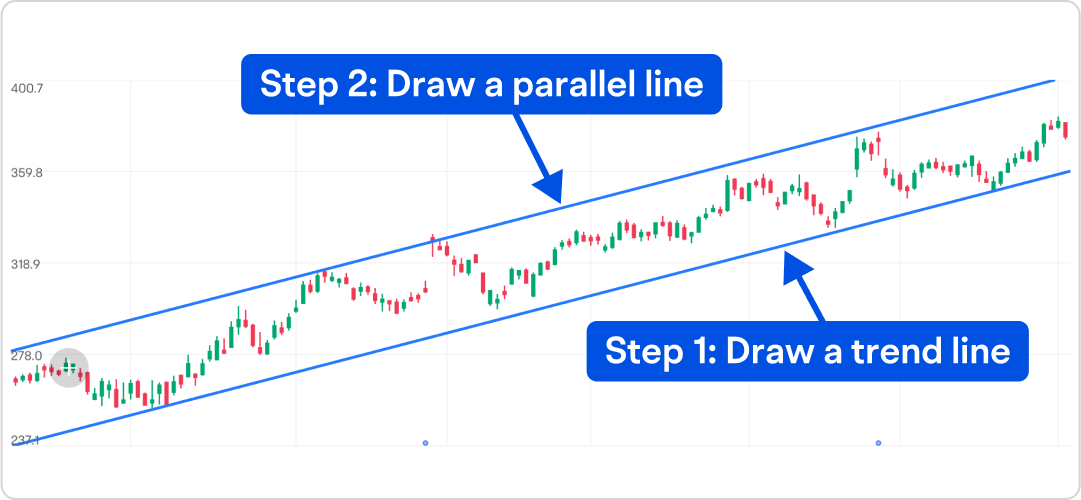
The parallel line should be drawn along the swing highs of the price action. Traders should not be forced to draw a parallel line. If it doesn’t match the price action, then there is simply no channel.
There are two common ways to trade with a channel: trading the range or trading the breakout, if it occurs. As a rule of thumb, traders should always consider combining channel trading with other trading methods to potentially improve their trading decisions.
Trading the range
Since the boundaries of a channel can serve as potential support and resistance levels, a “buy low and sell high” strategy within the channel may work.
A potential buy signal occurs when the price bounces off the lower trend line. A potential sell signal occurs when the price bounces off the upper trend line. For more aggressive traders, potential trading signals might occur when the price approaches the upper or lower trend line.
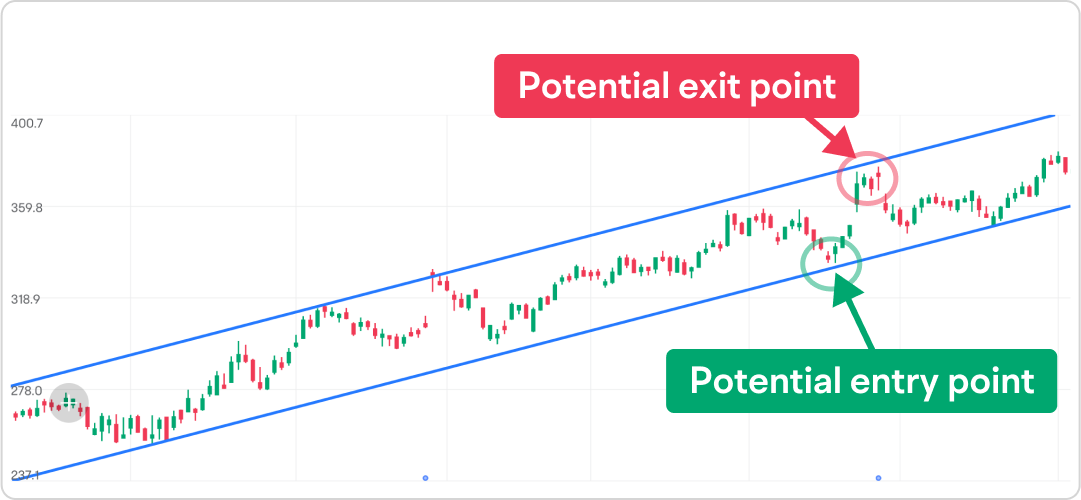
This strategy can help traders better manage risk as it determines potential stop-loss and take-profit levels.
However, a limitation of trading the range is that channels heavily rely on historical price action, which doesn’t necessarily indicate future movements. Moreover, a channel will eventually be broken.
Trading the breakout
A breakout occurs when the price moves outside of the channel, typically on a closing price basis, often accompanied by increased trading volume and volatility.
A breakout could mean that the channel is no longer intact and indicates a potential strong move in the direction of the breakout.
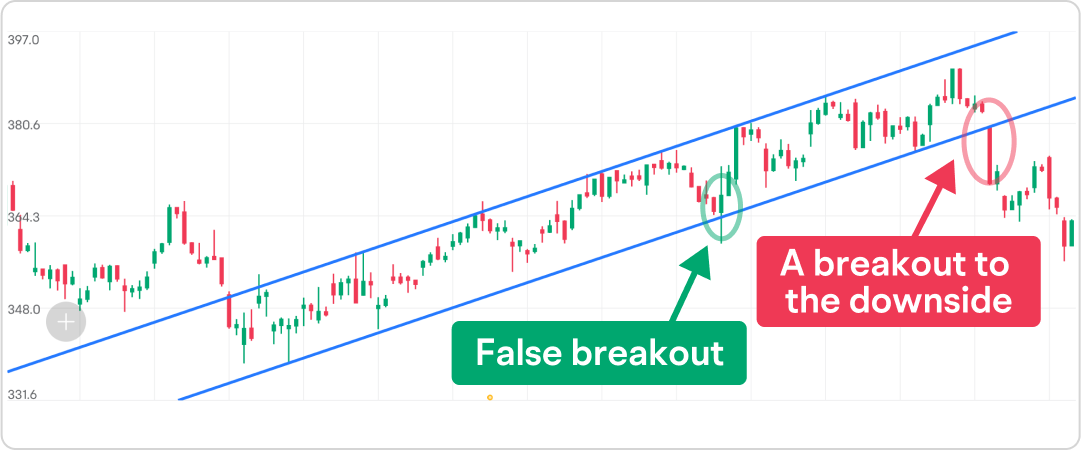
If the price breaks out of the channel to the upside, traders may go long, and if the price breaks out of the channel to the downside, traders may go short.
Trading the breakout may carry greater risk as the market will sometimes provide false breakout signals. A more conservative approach, however, is to wait for potential confirmation. For example, wait for a retest of the trend line.
03 Case study
Chart 1 shows an uptrend with the price making higher highs and higher lows at relatively the same angle, which enables traders to draw an ascending channel.
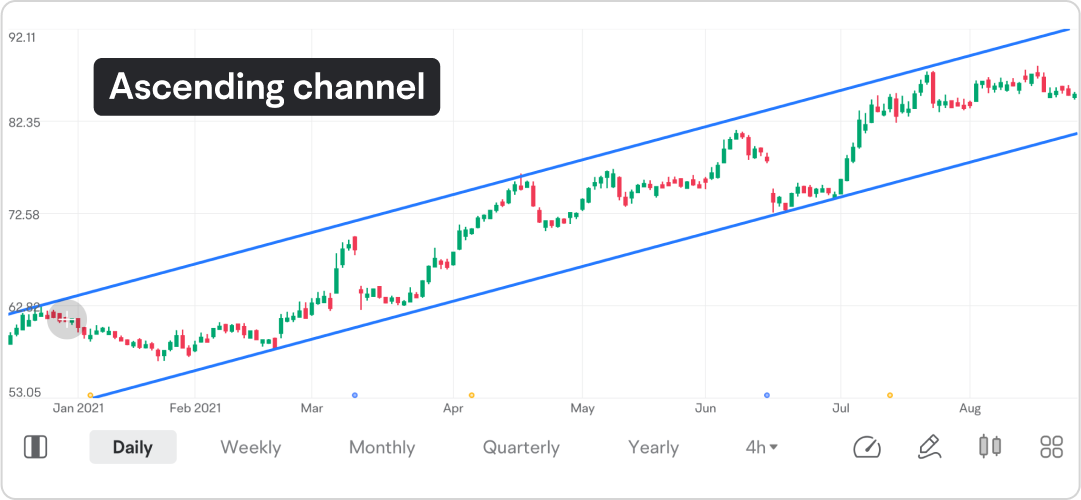
Many traders believe it is wise to trade with the trend. In an uptrend, it would be better to go long.
Chart 2 combines the channel with other technical indicators to help identify potential trading signals.
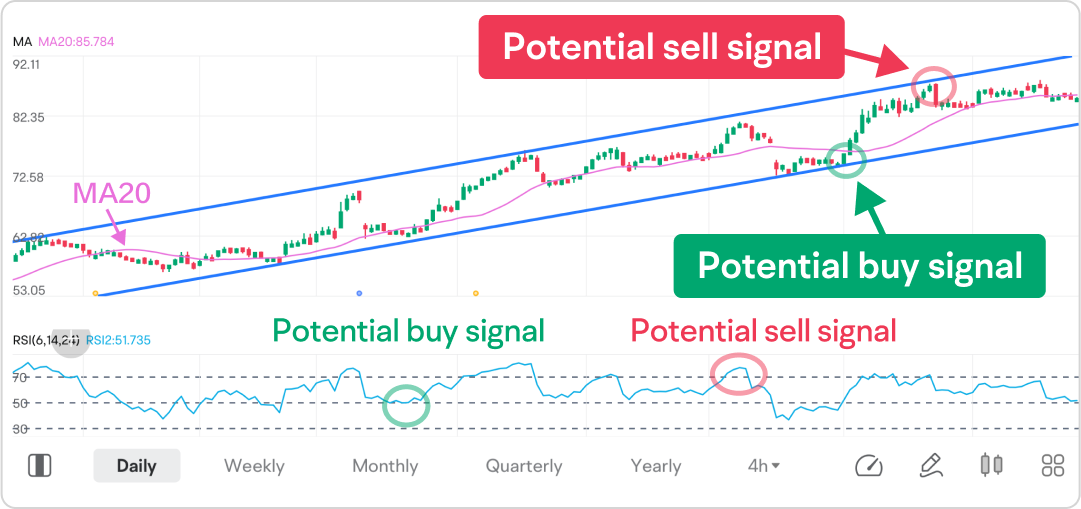
Potential buy signals occur when the price bounces off the lower trend line. Some traders might take some early signals into consideration, for example, when the price bounces off the 20-day moving average (MA20), or when the RSI approaches the 50 level.
Potential sell signals occur when the price bounces off the upper trend line, or when the RSI crosses below 70 after being overbought.
Chart 3 shows a descending channel on the daily time frame. As the price moves above the upper trend line multiple times in a couple of trading days, traders may prepare for a potential breakout to the upside.
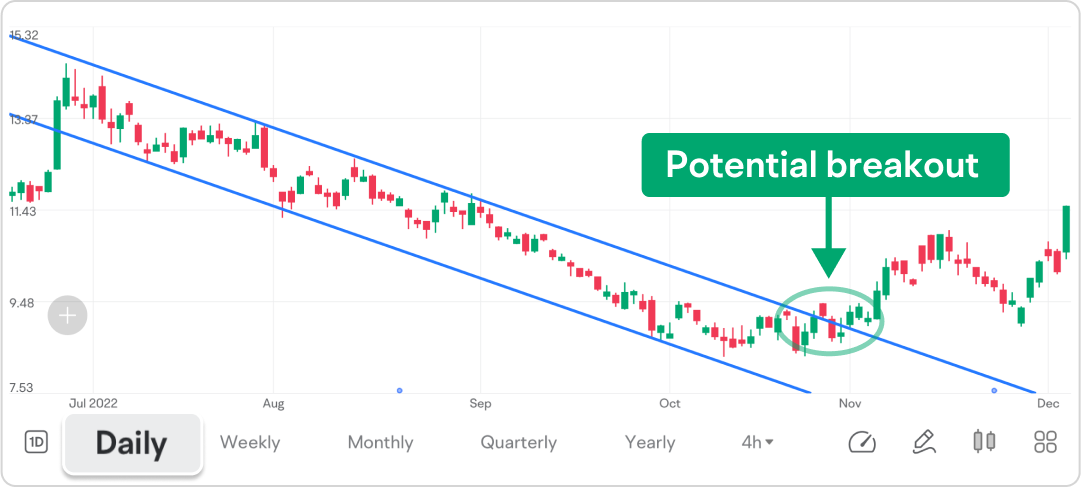
To potentially confirm a bullish trading bias, other time frames, for example, the 4-hour (4H) chart, may provide more detailed information.
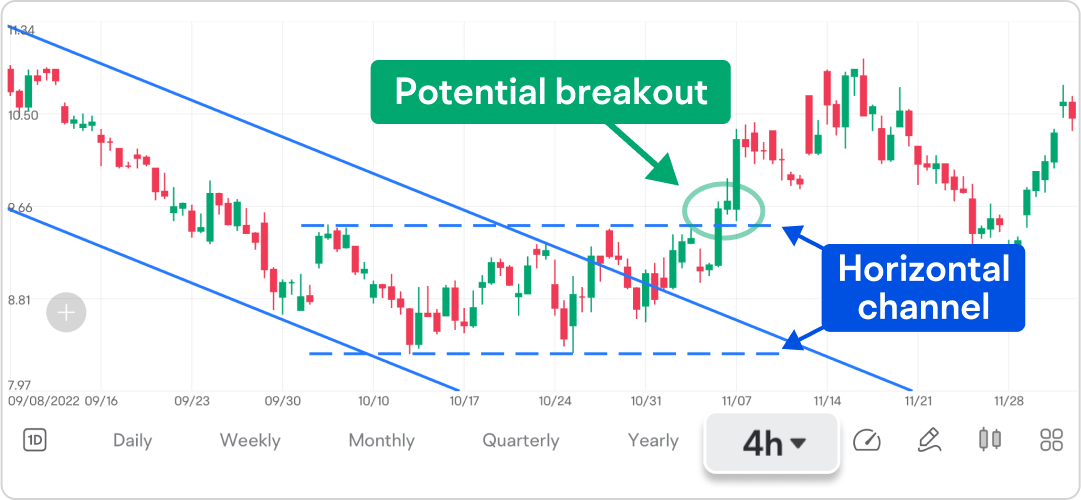
Chart 4 on the 4H time frame shows another channel, a horizontal channel, indicating the prior downside momentum in price has subsided. Moreover, the horizontal channel is also likely to see a potential breakout to the upside.
This presentation discusses technical analysis, other approaches, including fundamental analysis, may offer very different views. The examples provided are for illustrative purposes only and are not intended to be reflective of the results you can expect to achieve.
All investing involves risk, including the potential loss of principal, and there can be no guarantee that any investing strategy will be successful.
This presentation is for informational and educational use only and is not a recommendation or endorsement of any particular investment or investment strategy. Investment information provided in this content is general in nature, strictly for illustrative purposes, and may not be appropriate for all investors. Read more