How to Identify a Piercing Line
Where there is a large bullish candle, there is usually bullish momentum in the market.
In certain situations, a large bullish candle can signal a potential bullish reversal in a downtrend.
This week we’ll walk you through a bullish reversal candlestick pattern: the piercing line.
What is a piercing line?
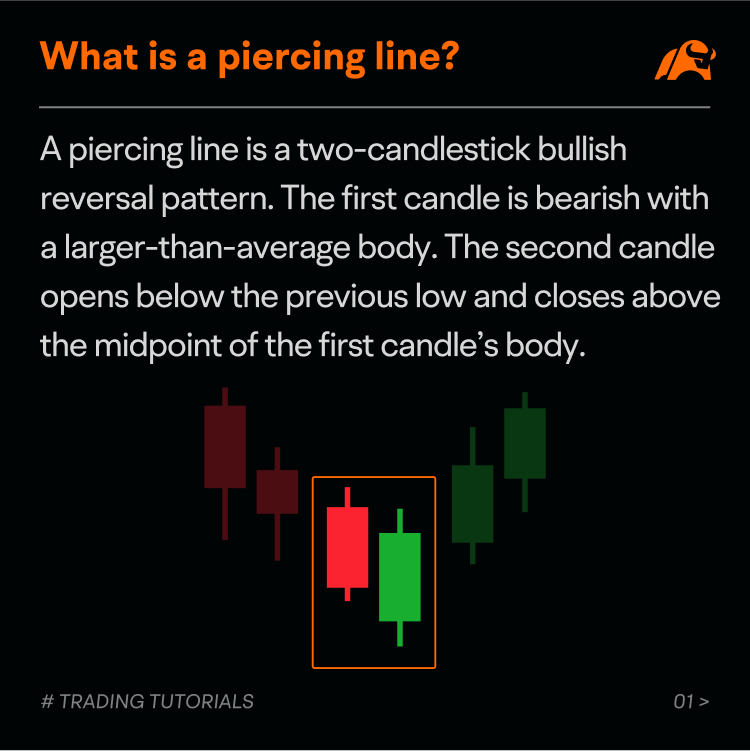
A piercing line is a two-candlestick bullish reversal pattern formed in a downward trend.
The first candle is bearish with a larger-than-average body, suggesting sellers dominate the market on the first day.
The second candle is bullish with the opening price below the first candle’s low, creating a gap down, and the closing price above the midpoint of the first candle’s body.
This suggests a potential bullish reversal as buyers exert more influence on the market.
How does a piercing line occur?
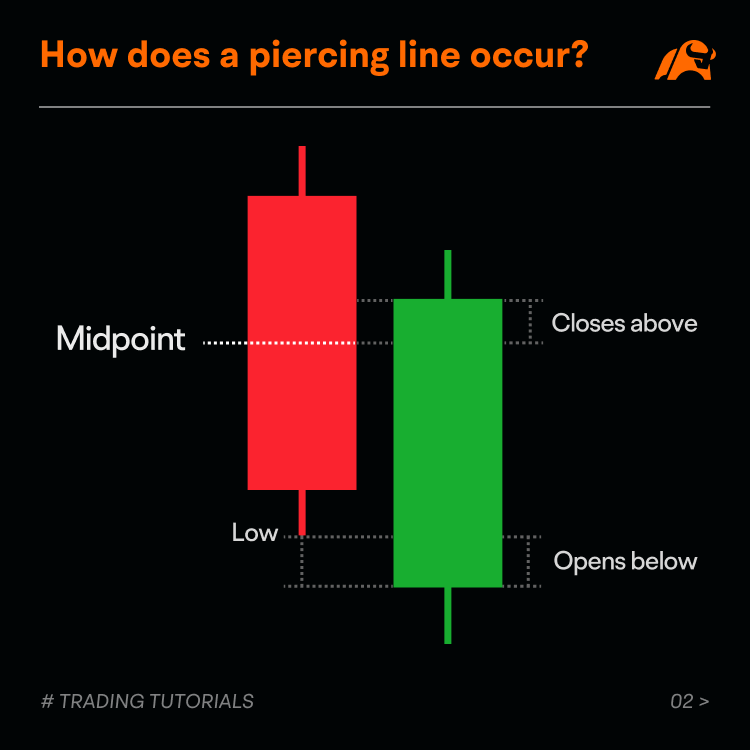
A piercing line typically occurs in a prominent downtrend, where the price makes lower lows.
The first bearish candle, with a larger-than-average body, suggests strong selloffs in the market.
The second candle opens below the first candle’s low and, thus, creates a gap down, indicating again that market sentiment remains bearish in the early session.
However, as the session progresses, price action reverses with the bulls stepping in, and the second candle is able to close above the midpoint of the first candle’s body, forming a piercing line.
This suggests the price might have found its supporting levels around the gap down, and the bulls might take further actions in the short term.
How to identify a piercing line?
Traders might consider the following factors when trying to identify a piercing line.
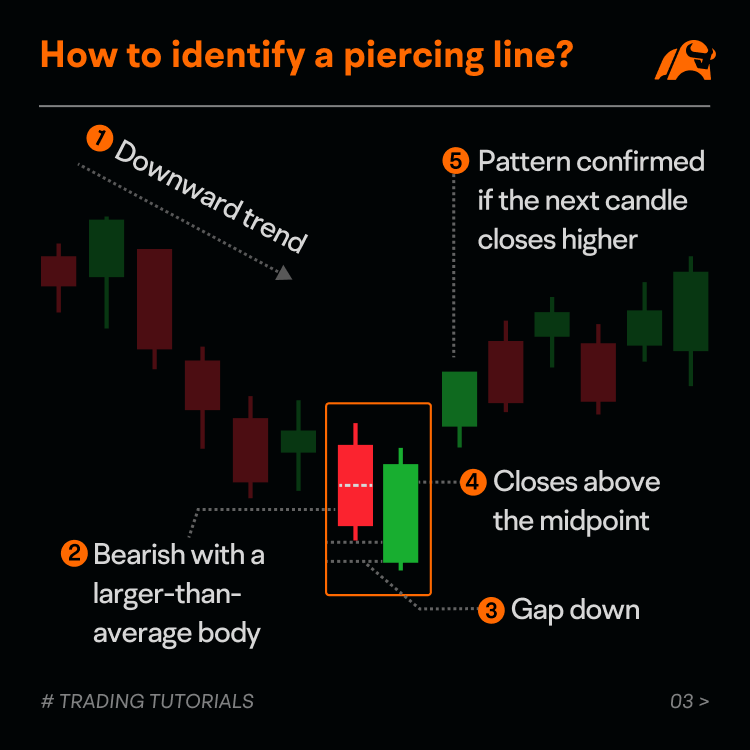
● Downtrend
A piercing line is typically found after a downtrend, as the pattern is considered a bullish reversal candlestick pattern.
● The first candle
The first candle should be bearish and have a larger-than-average body, suggesting sellers are totally in control.
● The second candle
The second candle should be bullish with the closing price above the midpoint of the first candle’s body, indicating strong buying pressure.
● Gap down
There should be a gap down between the first candle’s low and the second candle’s open. The gap down might indicate how powerful the potential price reversal would be.
● Confirmation
To confirm the potential bullish signal, traders often look for the pattern’s next candle to close higher.
Case study
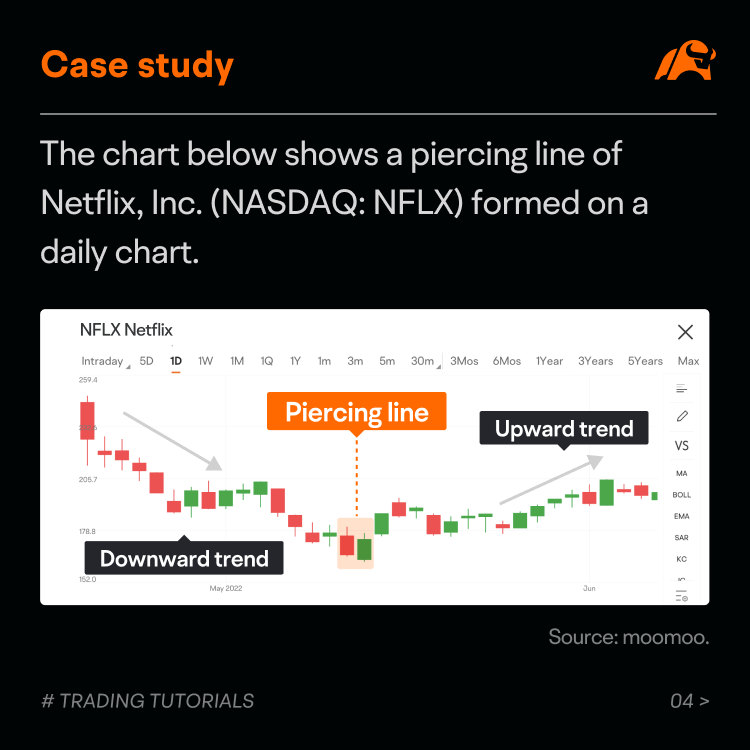
The chart below shows a piercing line of Netflix, Inc. (NASDAQ: NFLX) formed on a daily chart.
The stock was in a downtrend before the piercing line showed up.
The first candle of the pattern, a large bearish one, was part of the downward price movement.
The second candle opened below the first candle’s low and closed above 50% of the first candle’s body, suggesting the bulls managed to control the market and signaling a potential bullish reversal in the short term.
The next day after the piercing line occurred, the price made a sharp jump, helping to confirm the potential bullish trading signal.
Summary
The piercing line is a two-candlestick bullish reversal pattern formed in a downtrend.
The pattern might help traders confirm a potential entry point for a long trade, but it does not always work.
When trading candlestick patterns, don’t forget to factor in other technical tools.
This presentation is for informational and educational use only and is not a recommendation or endorsement of any particular investment or investment strategy. Investment information provided in this content is general in nature, strictly for illustrative purposes, and may not be appropriate for all investors. Read more