Using Fibonacci extensions in trend trading
01 What are Fibonacci extensions?
Fibonacci is a broad topic with applications across various fields. In technical analysis, traders use a range of tools based on the Fibonacci sequence or ratios to better understand market price movements.
A popular Fibonacci tool is the Fibonacci retracement, which traders use to predict where a price correction may stop and reverse.
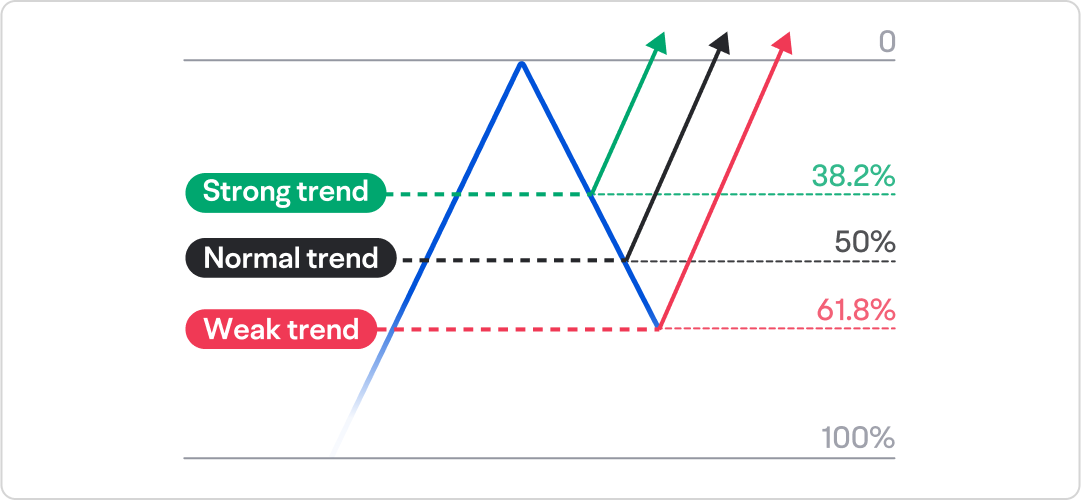
Once the retracement concludes, the expectation is that the price will resume its previous direction. Traders often look for where the future support or resistance levels might lie, or where to set “take profit” targets. This is where Fibonacci extensions come into play.
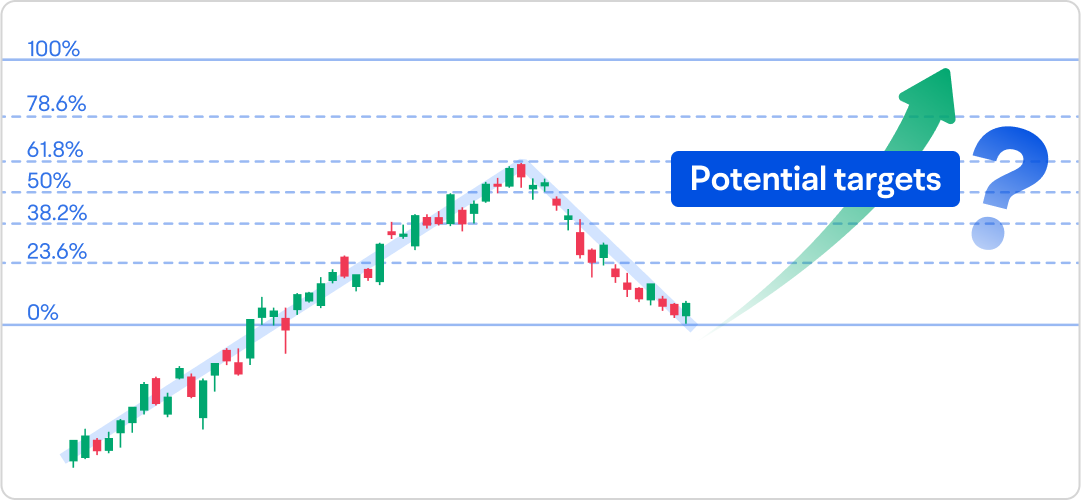
Fibonacci extensions use similar percentage-based ratios as retracements, such as 38.2% and 61.8%, to predict potential support or resistance levels. However, they are specifically used to forecast the extent of a price move following a retracement’s conclusion.
As a general practice, traders who use Fibonacci retracements might also employ Fibonacci extensions to gain further insight into market trends.
02 How to use Fibonacci extensions?
Fibonacci extensions are often used when traditional methods of finding support or resistance levels aren’t clear, such as when the market reaches new highs or lows.
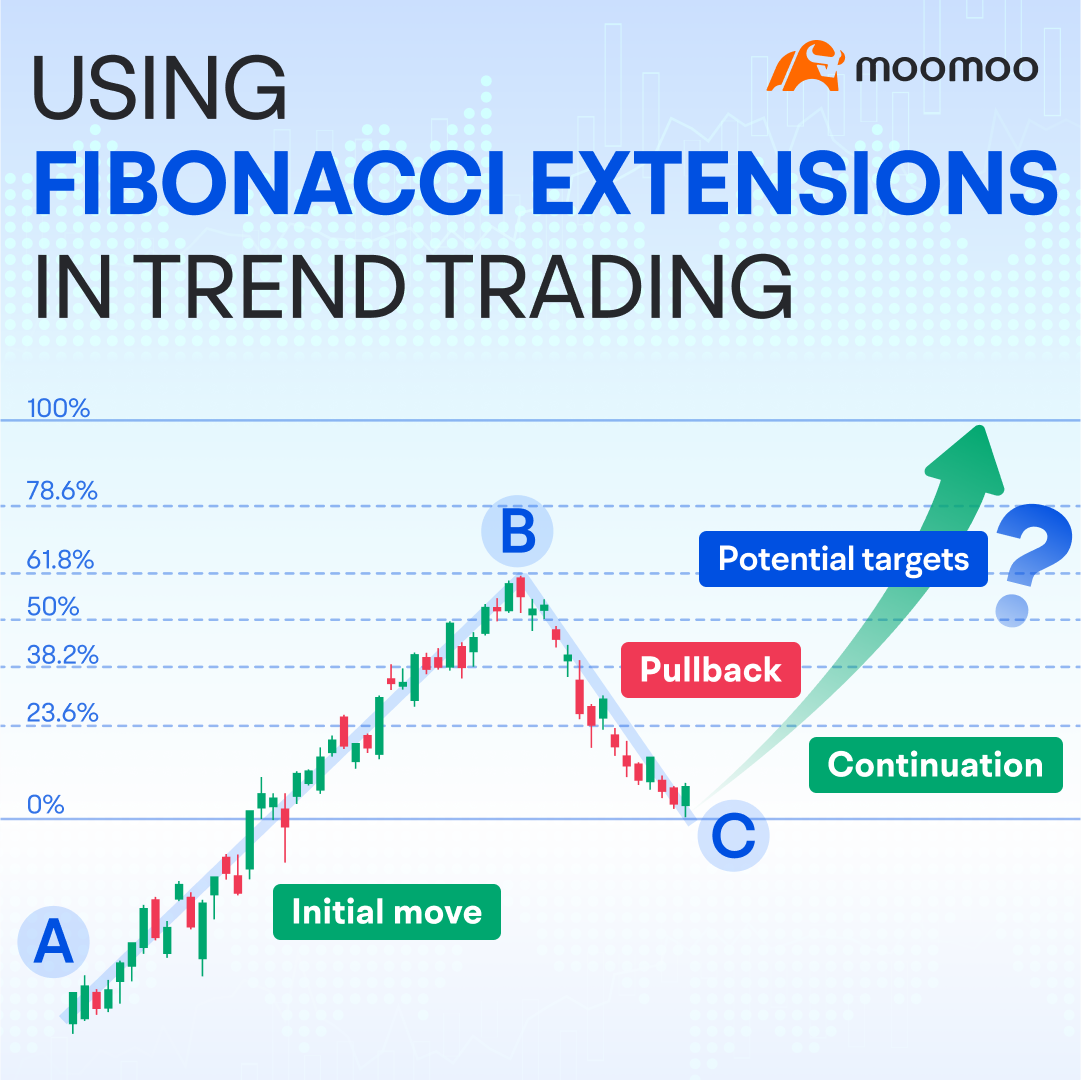
To draw Fibonacci extensions, traders first identify a significant price swing in the market, and then connect three price points.
In an upward trend, for example:
Point A is the start of a significant upward trend. It is typically a swing low or a market bottom.
Point B is where the trend pauses and starts to retrace a portion but not all of the prior move.
Point C is the end of the retracement, indicating a continuation of the prior trend.
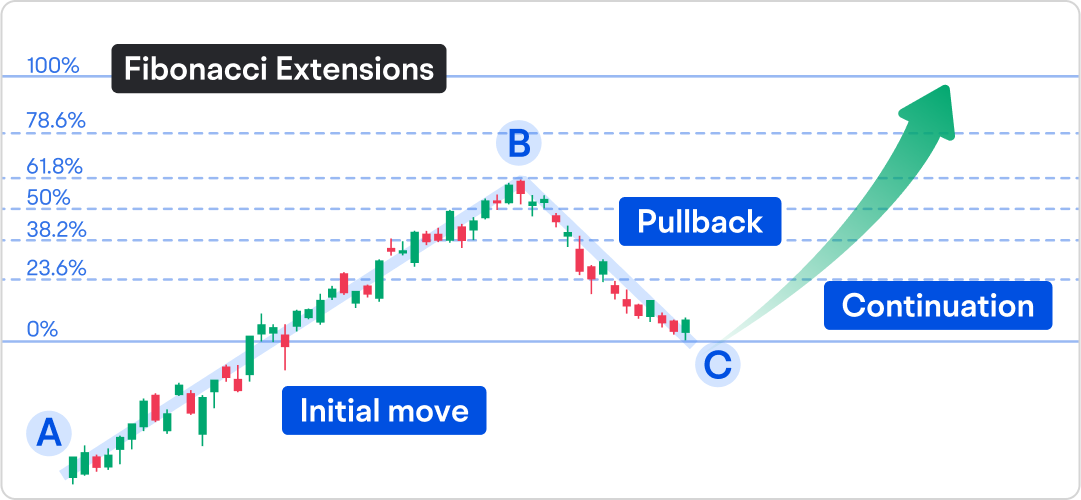
Traders use Fibonacci extensions to measure the original A-B move against the subsequent move from Point C. Popular extension levels include 38.2%, 50%, 61.8%, and 100%.
These levels help traders set potential price targets for a bullish position. If the price passes one Fibonacci level, it might proceed to the next one.
It is worth noting that the B-C move in price should not surpass that of the A-B move. Also, many traders hold that if the B-C retracement is more than 61.8% of the A-B move, it could signal a potential reversal instead of a continuation.
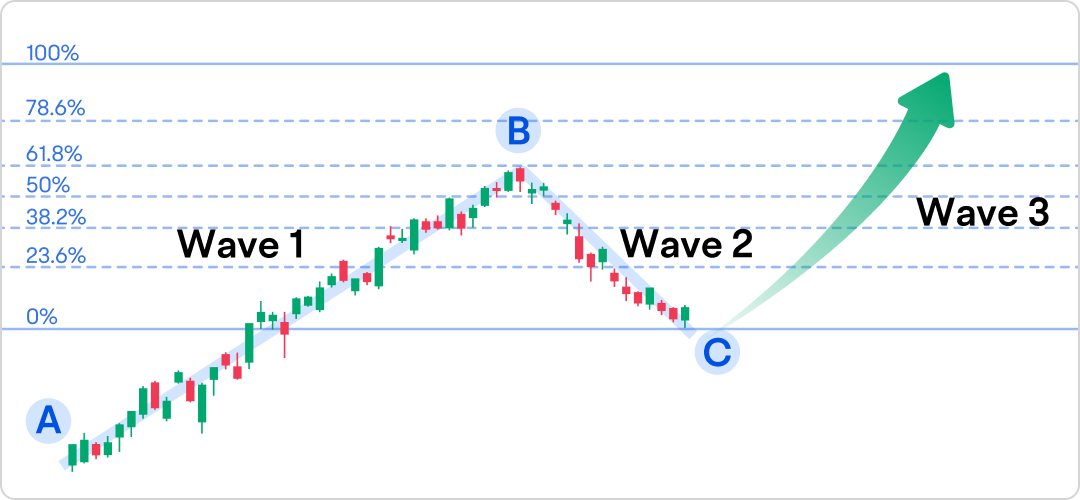
Fibonacci extensions also play a role in Elliott Wave Theory. Within this framework, the A-B move is seen as the first wave, representing the beginning of a trend. The B-C segment is the second wave, pulling back from the initial wave. Fibonacci levels are then applied to forecast where the third wave might end, which is often expected to extend beyond the initial wave.
03 Case study
Chart 1 displays a pronounced upward trend that later experiences a price pullback. This movement allows traders to apply the Fibonacci retracement tool by linking the starting low point with the following high point.
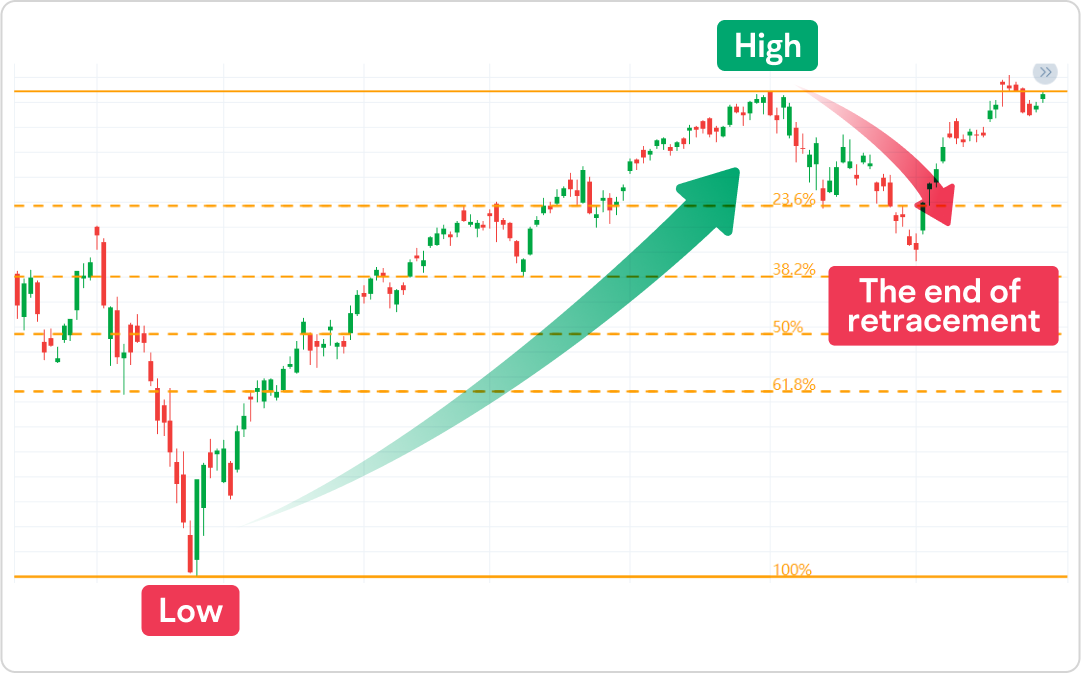
As illustrated, the price rebounds just above the 38.2% retracement level, suggesting the prior uptrend is robust and that a continuation of the upward trend is probable after the initial surge.
To estimate potential resistance levels and price targets, traders can use the Trend-Based Fib Extension tool.
Chart 2 shows using Fibonacci extension levels and the RSI indicator to help identify potential price targets. The first price target could be situated near the 38.2% extension level, coinciding with an overbought condition by the RSI hitting 70.
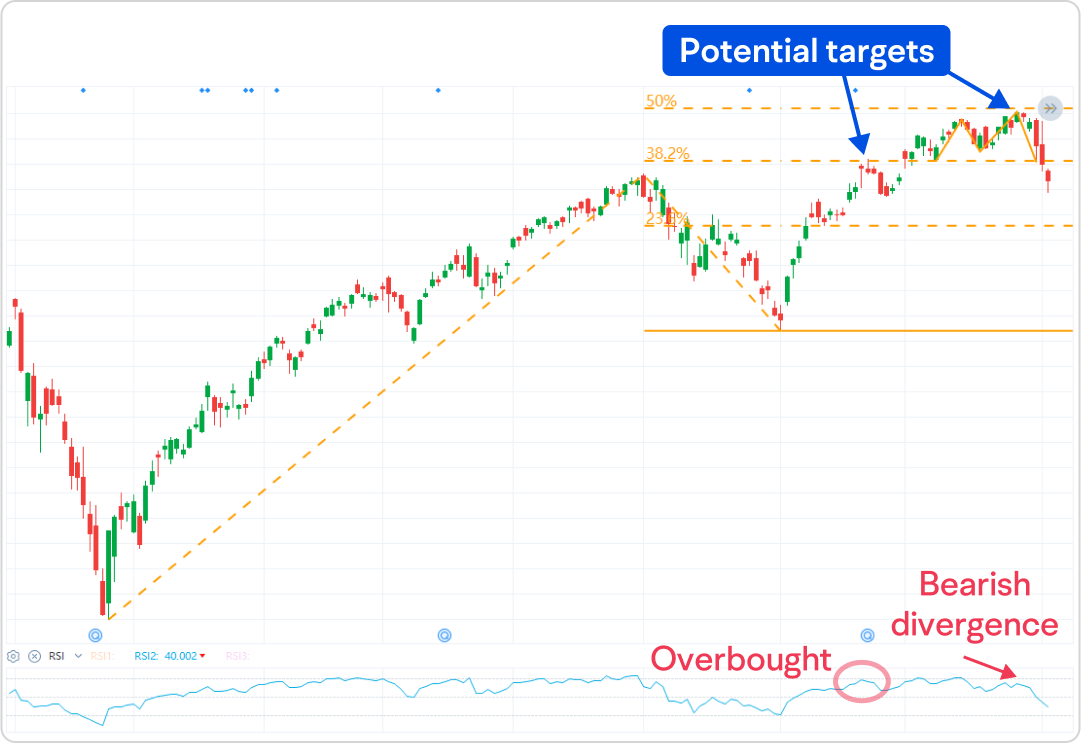
The second price target is one to watch around the 50% extension level, where a Double Top price pattern forms and a bearish divergence signal occurs between the price and the RSI indicator.
Although Fibonacci extensions may sometimes provide insights into potential support and resistance levels, they are flawed like any other technical tool.
A significant drawback is the subjective nature of drawing Fibonacci levels, as analysts may select different swing points for their calculations, resulting in different decisions.
This presentation discusses technical analysis, other approaches, including fundamental analysis, may offer very different views. The examples provided are for illustrative purposes only and are not intended to be reflective of the results you can expect to achieve.
All investing involves risk, including the potential loss of principal, and there can be no guarantee that any investing strategy will be successful.
This presentation is for informational and educational use only and is not a recommendation or endorsement of any particular investment or investment strategy. Investment information provided in this content is general in nature, strictly for illustrative purposes, and may not be appropriate for all investors. Read more